INVESTIGATION OF IMPROVED
IMMUNOSTIMULATORY ACTIVITY OF D
AND K TYPE CpG ODNS IN LIPOSOMES
a thesis
submitted to the department of molecular biology and
genetics
and the graduate school of engineering and science
of bilkent university
in partial fulfillment of the requirements
for the degree of
master of science
By
˙Ihsan Dereli
August, 2013
I certify that I have read this thesis and that in my opinion it is fully adequate, in scope and in quality, as a thesis for the degree of Master of Science.
Assoc. Prof. ˙Ihsan G¨ursel(Advisor)
I certify that I have read this thesis and that in my opinion it is fully adequate, in scope and in quality, as a thesis for the degree of Master of Science.
Assoc. Prof. Dr. Reng¨ul C¸ etin Atalay
I certify that I have read this thesis and that in my opinion it is fully adequate, in scope and in quality, as a thesis for the degree of Master of Science.
Assoc. Prof. Dr. Uygar Tazebay
Approved for the Graduate School of Engineering and Science:
Prof. Dr. Levent Onural Director of the Graduate School
ABSTRACT
INVESTIGATION OF IMPROVED
IMMUNOSTIMULATORY ACTIVITY OF D AND K
TYPE CpG ODNS IN LIPOSOMES
˙Ihsan Dereli
M.S. in Molecular Biology and Genetics Supervisor: Assoc. Prof. ˙Ihsan G¨ursel
August, 2013
CpG ODNs are potent immunotherapeutic agents. In human, two major classes of CpG ODNs were shown to induce differential immune activation. D ODNs are strong IFNα inducers, thus promising antiviral agents, whereas K ODNs are effective against bacterial infections. However, their effects cannot be combined. When K and D type ODNs are used simultaneously, K ODN cancels D specific effect, a phenomenon known as K and D ODN dichotomy. The prime reason for this counter acting K ODN action was subcellular compartmentalization of K type CpG ODNs upon internalization. Besides, CpG ODNs have labile nature. When investigated in clinical trials, these nucleic acid based ligands are eliminated upon administration and displayed limited bio-availability due to nuclease digestion. Hence, efforts to protect in vivo performance, and increase stability and accumulation near target cells became a crucial task. Liposome technology offers a simple and mild approach to harbor these ODNs within membrane bilayers and protect them. We also reasoned that, if we use liposomes that alter subcellular fate of K and D ODNs, we can retain both K and D effect when liposomal ODNs are co-administered and the breadth of immunotherapeutic spectrum could be improved. This thesis was designed to understand and characterize different types of CpG ODNs loaded into different liposomes and aimed to determine their activities in different in vitro and in vivo settings. Our results revealed that when two different classes of clinically important CpG ODNs were encapsulated within proper liposome types, it is possible to recapitulate both K and D type ODN effect in PBMCs. Furthermore, in a vaccine model against H. felis, although initially did not induce significantly higher anti H.felis immunity, liposomal CpG ODNs improved persisting antibody levels for extended periods compared to free counterparts. Collectively, our results demonstrate that this platform allows more effective in vivo utilization of CpG ODNs and can be formulated to develop more efficient means to combat several health problems, ranging from cancer to allergy.
¨
OZET
L˙IPOZOMLARA Y ¨
UKLENM˙IS
¸ K VE D CpG ODNLER˙IN
ARTAN ˙IMM ¨
UN UYARICI ETK˙ILER˙IN˙IN
ARAS
¸TIRILMASI
˙Ihsan Dereli
Molek¨uler Biyoloji ve Genetik, Y¨uksek Lisans Tez Y¨oneticisi: Assoc. Prof. ˙Ihsan G¨ursel
A˘gustos, 2013
CpG ODNler etkili imm¨unoterap¨otik ajanlardır. ˙Insanda iki ana ODN sınıfının ayrık imm¨un aktivasyonları tetikledi˘gi g¨osterilmi¸stir. D ODNler g¨u¸cl¨u IFNα ind¨ukleyicileri olarak ¨onemli antiviral ajanlar iken, K ODNler bakteriyel enfeksiyonlara kar¸sı ¨one ¸cıkar. Fakat, bu ODNlerin birlikte aynı anda uygulanması ¸calı¸smaları D ODNe ¨ozg¨u etkilerin yok oldu˘gunu g¨ostermi¸stir. Bu olgu K ve D ODNlerin zıt etkisi olaraka bilinir. Bu zıt etkinin en ¨onemli sebebi K ve D s ODNlerin i¸ce alımı sırasında h¨ucre i¸cinde farklı kompartmanlara konu¸slanmasıdır. Bundan bas¸sa, kırılgan bir do˘gaya sahip olan CpG ODNler , bula¸sıcı hastalıklar ve alerjik semptomlar gibi belirli durumlara kar¸sı klinik denemelerde n¨ukleazlar tarafından par¸calandıkları i¸cin sınırlı etki g¨ostermektedirler. In vivo etkisini korumak , dayanıklılı˘gını, hedef h¨ucreler tarafından alınımını artırmak i¸cin bu ajanları uygun ta¸sıyıcalara y¨uklemek ¨onem arz etmektedir. Lipozom teknolojisi bu ODNleri ¸cift zar tabakası i¸cinde korumak i¸cin basit ve zararsız bir yakla¸sım sunmaktadır. Bundan ba¸sk a, K ve D sınıfı ODNLerin h¨ucre i¸cindeki akıbetlerini de˘gi¸stirebilen lipozomlara ayrı ayrı y¨uklenerek birlikte uygulanması ile K ve D ODN etkisinin birle¸stirilebilece˘gini ¨ong¨ord¨uk. Bu tez farklı lipozomlara y¨uklenmi¸s de˘gi¸sik CpG ODNleri daha iyi anlamayı, karakterize etmeyi, in vitro ve in vivo ortamlarda uygulamayı ama¸clamaktadır. Bizim sonu¸clarımız g¨ostermi¸stir ki K ve D sınıfı ODNleri uygun lipozomlara y¨ukleyip iki tip ODN etkisini de insan kan periferik kan h¨ucrelerinde g¨ormek m¨umk¨und¨ur. Bundan ba¸ska lipozomal CpG ONDNler H. felis a¸sı modelinde, ba¸sta daha iyi performans g¨osteremeseler de, daha uzun s¨ureli antikor ¨uretimi sa˘glamıslardır. Dolayısıyla, n¨ukleik asit tabanlı TLR ligandlarının in vivo etkisini klinik ortamda iyile¸stiren bu platform, kanserden alerjiye bir ¸cok sa˘glık problemine kar¸sı daha etkili tedaviler geli¸stirilmesi i¸cin kullanılabilir.
Anahtar s¨ozc¨ukler : Lipozom, CpG ODN, Helikobakteri, A¸sılama, K ve D kar¸sıt etkileri.
Acknowledgement
I would like to thank my advisor Assoc. Prof. Dr. Ihsan Gursel, for the opportunity to be a member of his group and accepting to become my mentor. I learned great deal from him, regretting that I should have learned much. His personal and academic advices besides his guidance and patience, was very valuable for me
I would like to thank to all present and past IG Group members for their help and support in the lab and in my experiments. IG group Undergrad students Ece, Berna and Sevgican were not only very helpful for my experiments, but their thoughtful and joyful personalities helped me to retain my will as much. I should also mention all senior project students past two years, I am grateful for their support.
I am indebted for H. felis cell extract to Assist. Prof. Ay¸ca Sayı Yazgan. Without her help, an important part of this work would not be possible.
I would also like to thank to The Scientific and Technological Research Council of Turkey (T¨uB˙ITAK) for their financial support throughout my master studies.
Moreover, I would like to thank to all my friends in MBG graduate school for their support and for always being there whenever I needed. I also thank to veterinarians Emre Bu˘gdaycı and Gamze Aykut, and Turan amca for their her help, support and patience during animal experiments. I also thank Abdullah amca for solving every technical problem I have encountered. He is our secret hero in this department. My sincere thanks go to MBG Family members ,whom I spent six years among, for their guidance, companionship and assistance.
My heartfelt thanks to Assoc. Prof Mayda Gursel, she have a special place in hearts of all IG group members. I would like to offer my special thanks to Mayda Gursel Group members, Bilgi, Esin, Mine and Soner for their friendliness and helping me in my research.
Without my family, I wouldn’t be born from the beginning, but their support and love had much more important reasons for my accomplishments than that.
Contents
1 Introduction 2
1.1 The Immune System . . . 2
1.2 Innate Immune System . . . 4
1.2.1 PAMPs and PRRs . . . 7
1.2.1.1 Cell Surface Toll-Like Receptors . . . 9
1.2.1.2 Intracellular Toll-Like Receptors . . . 10
1.2.1.3 TLR Signaling Pathway . . . 11
1.2.1.3.1 MyD88 Dependent Pathway: . . . 11
1.2.1.3.2 MyD88 Independent-TRIF Dependent Pathway: . . . 12
1.3 Synthetic CpG ODNs . . . 12
1.3.1 A or D Type ODN . . . 14
1.3.2 B or K type ODNs . . . 14
CONTENTS vii
1.3.4 Competitive Action of Mechanisms of D and K Type ODNs 15
1.4 Helicobacter Vaccine . . . 17
1.4.1 Helicobacter Infection . . . 17
1.5 Liposome Technology . . . 18
1.5.1 Liposomal Vaccines . . . 20
2 Aim of The Study 22 3 Materials and Methods 23 3.1 Materials . . . 23
3.1.1 ELISA Reagents . . . 23
3.1.2 TLR Ligands . . . 24
3.1.3 Lipids . . . 24
3.2 Methods . . . 25
3.2.1 Cell Line Maintanence . . . 25
3.2.2 Stimulation of RAW 264.7 cells for Gene Expression Analysis 25 3.2.3 Spleen Single Cell Suspension Preparation . . . 25
3.2.4 Cell Counting by Hemocytometer . . . 26
3.2.5 Cell Counting by Flow Cytometer . . . 26
3.2.6 In vitro Splenocyte Stimulation . . . 26 3.2.7 Human Peripheral Blood Mononuclear Cell (PBMC) Isolation 27
CONTENTS viii
3.2.8 In vitro PBMC stimulation . . . 27
3.2.9 Liposome Preparation . . . 28
3.2.10 Enzyme Linked ImmunoSorbent Assay (ELISA) . . . 29
3.2.10.1 Cytokine ELISA . . . 29
3.2.10.2 IgG ELISA . . . 31
3.2.11 Total RNA Isolation . . . 32
3.2.12 cDNA Synthesis . . . 33
3.2.13 PCR . . . 33
3.2.14 Agarose Gel Electrophoresis . . . 34
3.2.15 Immunization Protocol . . . 35
3.2.16 Sera Collection from Immunized Mice . . . 35
3.2.17 Maintenance of Animals . . . 36
3.2.18 Statistical Analyses . . . 36
4 Results 37 4.1 Effects of Liposomes Encapsulating D-ODN and K-ODN on RAW 264.7 Gene Expression . . . 37
4.2 In Vitro Stimulation of Splenocytes with Liposomal CpG ODN . . . 39
4.3 Immunization with Liposomes Co-Encapsulate CpG ODN and H. felis Total Cell Extract . . . 47
CONTENTS ix
4.4 Simultaneous Stimulation of PBMCs with liposomes encapsulating D35 or K3 . . . 54
5 Discussion 66
6 Future perspectives 70
List of Figures
1.1 Activation of DC upon Ag internalization and presentation of epitopes to T and B cells . . . 5 1.2 Cell surface and endosome associated TLRs with their representative
ligands . . . 9 1.3 Initiation of MyD88 and TRIF dependent signaling cascade upon
TLR-ligand interaction . . . 13 1.4 Differential immune activation of human pDC following D and K
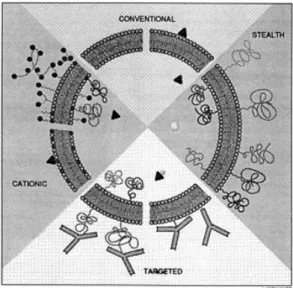
triggered signaling cascade . . . 16 1.5 Conventional, cationic, stealth and targeted liposome . . . 20
3.1 Timeline for immunization experiment . . . 35
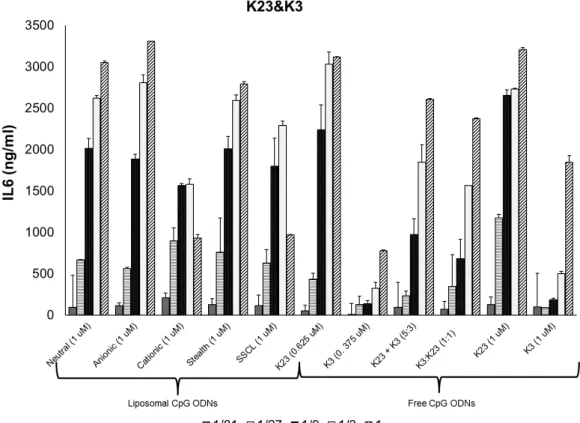
4.1 Gel photomicrographs of several gene products following RT-PCR obtained from total RNA of CpG stimulated RAW 264.7 cells . . . 39 4.2 Dose dependent IL6 secretion profiles of different liposome
LIST OF FIGURES xi
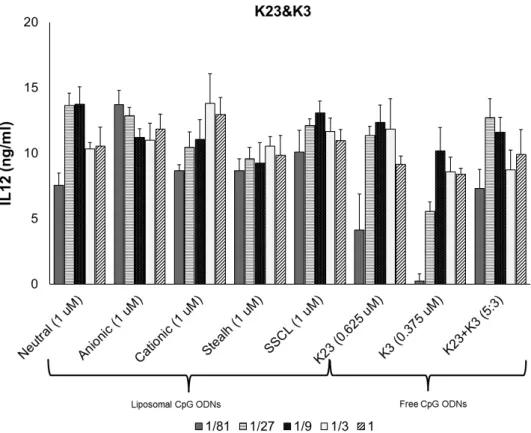
4.3 Dose dependent IL6 secretion profiles of different liposome formulations co-encapsulating 1466 Acore MB, and D3CG MB. . . . 43 4.4 Dose dependent IL12 secretion profiles of different liposome
formulations co-encapsulating K23, and K3. . . 44 4.5 Dose dependent IL12 secretion profiles of different liposome
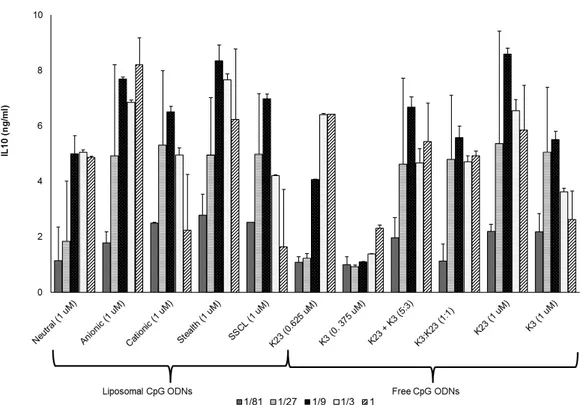
formulations co-encapsulating 1466 Acore MB, and D3CG MB. . . . 45 4.6 IL10 secretion profiles of different liposome formulations co-encapsulating
K23 and K3. . . 46 4.7 Comparison of IgG levels of immunized mice against H. felis 2 weeks
after 1st injection . . . 50 4.8 Comparison of IgG levels of immunized mice against H. felis 2 weeks
after booster injection . . . 51 4.9 Comparison of IgG levels of immunized mice against H. felis 6 weeks
after booster injection . . . 52 4.10 Persistence of anti-H.felis responses among different treatment groups. 53 4.11 Dose and Liposome type dependent IL6 production by K and D
type CpG ODNs from human PBMCs . . . 58 4.12 Dose and Liposome type dependent TNFα production by K and D
type CpG ODNs from human PBMCs . . . 59 4.13 Dose and Liposome type dependent IFNγ production by K and D
type CpG ODNs from human PBMCs . . . 60 4.14 Dose and Liposome type dependent IFNα production by K and D
LIST OF FIGURES xii
4.15 IL6 production after simultaneous administration of liposomal K and D type CpG ODNs to human PBMC . . . 62 4.16 TNFα production after simultaneous administration of liposomal K
and D type CpG ODNs to human PBMC . . . 63 4.17 IFNγ production after simultaneous administration of liposomal K
and D type CpG ODNs to human PBMC . . . 64 4.18 IFNα production after simultaneous administration of liposomal K
and D type CpG ODNs to human PBMC . . . 65
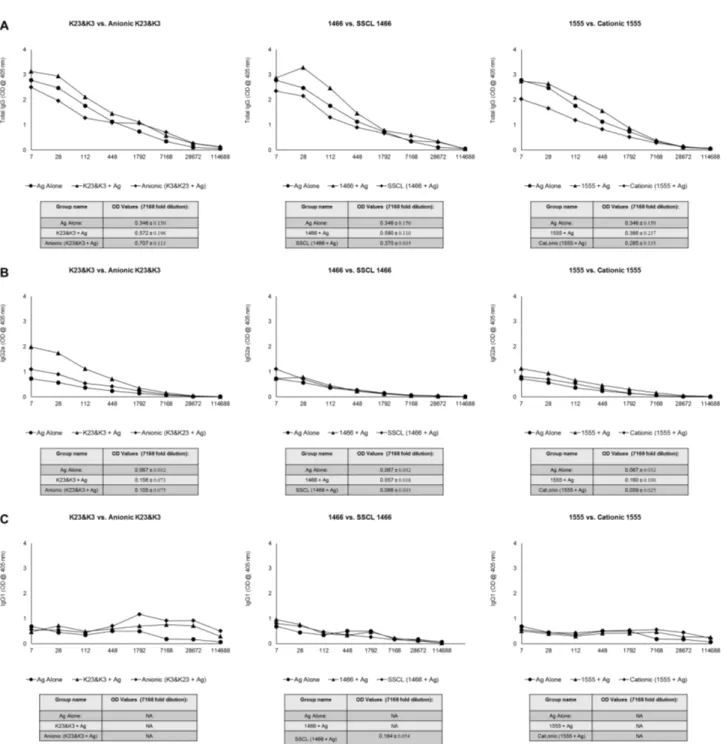
A.1 IgG levels of individual mouse immunized against H. felis 2 weeks after 1st injection. . . 88 A.2 Mean IgG levels of mice immunized against H. felis 2 weeks after
1st injection. . . 89 A.3 IgG1 levels of individual mouse immunized against H. felis 2 weeks
after 1st injection. . . 90 A.4 Mean IgG1 levels of mice immunized against H. felis 2 weeks after
1st injection. . . 91 A.5 IgG2a levels of individual mouse immunized against H. felis 2 weeks
after 1st injection. . . 92 A.6 Mean IgG2a levels of mice immunized against H. felis 2 weeks after
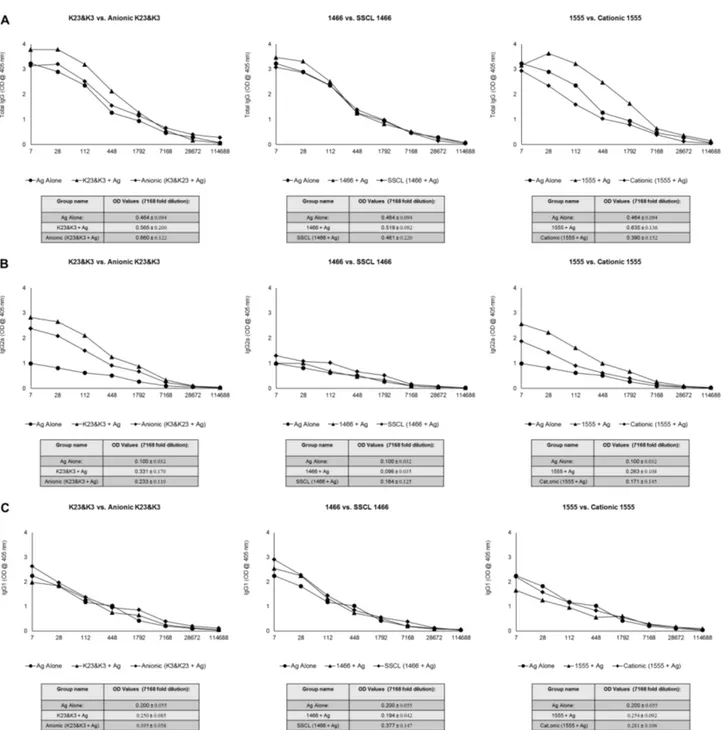
1st injection. . . 93 A.7 IgG levels of individual mouse immunized against H. felis 2 weeks
after booster injection. . . 94 A.8 Mean IgG levels of mice immunized against H. felis 2 weeks after
LIST OF FIGURES xiii
A.9 IgG1 levels of individual mouse immunized against H. felis 2 weeks after booster injection. . . 96 A.10 Mean IgG1 levels of mice immunized against H. felis 2 weeks after
booster injection. . . 97 A.11 IgG2a levels of individual mouse immunized against H. felis 2 weeks
after booster injection. . . 98 A.12 Mean IgG2a levels of mice immunized against H. felis 2 weeks after
booster injection. . . 99 A.13 IgG levels of individual mouse immunized against H. felis 6 weeks
after booster injection. . . 100 A.14 Mean IgG levels of mice immunized against H. felis 6 weeks after
booster injection. . . 101 A.15 IgG1 levels of individual mouse immunized against H. felis6 weeks
after booster injection. . . 102 A.16 Mean IgG1 levels of mice immunized against H. felis 6 weeks after
booster injection. . . 103 A.17 IgG2a levels of individual mouse immunized against H. felis 6 weeks
after booster injection. . . 104 A.18 Mean IgG2a levels of mice immunized against H. felis 6 weeks after
List of Tables
1.1 Pattern recognition receptors and their ligands . . . 8
3.1 List of Oligonucleotides that are used in this thesis . . . 24
3.2 Lipid composition and molar ratios for different liposomes . . . 29
3.3 Working concentrations for coating antibodies . . . 30
3.4 Starting concentrations for recombinant cytokines . . . 31
3.5 Designed mouse primers and amplicon sizes . . . 34
ABBREVIATIONS
APC Antigen presenting cell bp Base pairs
BCR B-cell receptor
Cag Cytotoxin associated gene CD Cluster of differentiation
cDNA Complementary Deoxyribonucleic Acid
CpG Unmethylated cytosine-phosphate-guaniosine motifs CXCL CXC-chemokine ligand
DC Dendritic cell
DNA Deoxyribonucleic acid dsRNA Double-stranded RNA
ELISA Enzyme Linked-Immunosorbent Assay FBS Fetal Bovine Serum
Ig Immunoglobulin
IκK Inhibitor kappa B kinase IL Interleukin
iNOS Inducible Nitric Oxide Synthase IFN Interferon
IP Interferon induced protein IRAK IL-1 receptor-associated kinase IRF3 Interferon-regulatory factor 3 LBP LPS-binding protein
LPS Lipopolysaccharide LRR Leucine-rich repeats LTA Lipotheicoic Acid
MALP Mycoplasmal lipopeptide MAP Mitogen-activated protein
MCP Monocyte Chemoattractant Protein MHC Major Histocompatibility Complex MIP Macrophage Inflammatory Protein
MSR Macrophage scavenger receptor
MyD88 Myeloid Differentiation Primary Response gene 88 NF-κK Nuclear factor-kappa B
NK Natural killer
NLR Nucleotide-binding oligomerization domain like proteins or receptors
NOD Nucleotide-binding oligomerization domain ODN Oligodeoxynucleotide
PAMP Pathogen associated molecular patterns PBS Phosphate buffered saline
PCR Polymerase chain reaction pDC Plasmacytoid dendritic cells PGN Peptidoglycan
pIC polyinosinic acid:cytidylic acid PNPP Para-nitrophenyl pyro phosphate PRR Pattern recognition receptors RIG Retinoic acid inducible gene RIP Receptor-interacting protein RNA Ribonucleic acid
RPMI Roswell Park Memorial Institute RT Reverse transcriptase
SA-AKP Streptavidin Alkaline-phosphatase SSCL Sterically stabilized cationic liposomes ssRNA Single-stranded RNA
TCR T-cell receptor
Th T-helper
TIR Toll/IL-1 receptor
TIRAP Toll/IL1 receptor-associated protein TLR Toll-like Receptor
TNF Tumor Necrosis Factor TRAF TNF-associated factor
TRAM TRIF-related adaptor molecules
Chapter 1
Introduction
1.1
The Immune System
History of earth and the course of evolution have been and are being influenced by continuing competition between organisms. As such, one of the most striking and interesting race happens between pathogens and their hosts. Pathogens persistently and relentlessly try to insult host organisms. Therefore, all living organisms developed means to protect themselves from pathogens. Those defence systems are usually multilayered and interrelated and most of the time complexity differs from each other. Even certain bacterial species have developed complex defense system against phage infection [1] . In higher organisms, collection of multiple defense mechanisms is called the immune system.
In mammals, although the exact content may vary, protection against pathogens starts with a natural barrier the skin, which is followed by mucosa. Mucosa do not only form a simple physical barrier, but is a crucial element of immune system, as it harbours a special site for mucosal immunity. Mucosal immunity has particular importance, as it covers the largest area in body that continuously encounter with gut or respiratory pathogens and therefore mucosal
immunity is an important branch of the innate immune system [2]. Innate immune cells are the second barrier that pathogens must breach. Working principle of innate immunity is generic, and a very unique one. Innate immunity exploits the one of the oldest mechanisms that organisms developed to survive; discriminating between self and non-self by recognizing unique molecular structures. Charles Janeway introduced the pattern recognition model for immune activation in his historical talk [3]. As mentioned above, there is a constant race between hosts and pathogens. Since pathogens has an advantage in terms of rate of evolution, mammalian innate immune system learned to differentiate evolutionary conserved Pathogen Associated Molecular Patterns (PAMPs), such as lipopolysccharide (LPS) lipoteichoic acid (LTA) or certain peptidoglycans (PGN) that are not expressed by self but only expressed by pathogens via germline encoded pathogen recognition receptors (PRRs) [4]. ). A few years later, Polly Matzinger extended Janeway’s postulation by proposing the ability of the innate immun system to discriminate between normal and pathological host sites [5], namely, The Danger Theory. Her model includes PRR recognition of Damage Associated Molecular Patterns (DAMPs), which are found in hosts normally and initiates immune reaction in disease conditions [6]. Once innate immunity is activated, an inflammatory response is ensued to eliminate the persisting infection.
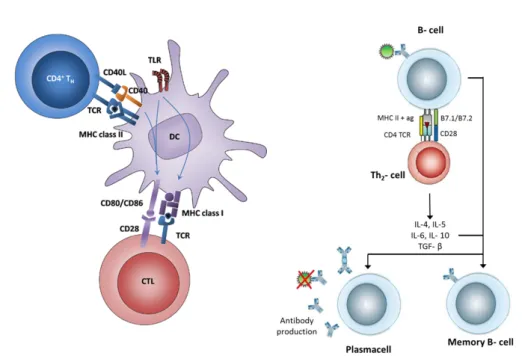
Adaptive immune system, or acquired immune system function cooperatively with innate immune system to eliminate persisting pathogens despite of initial attempts of innate immunity. In fact, adaptive immunity needs to be activated by innate immunity. When innate immunity is activated by pathogens, antigen-presenting cells (APCs) of the innate immune system, which resides within peripheral tissues in immature state, quickly phagoctose microbes or infected cells. Fragmented microbial peptides are loaded onto major histocompatibility complex (MHC) class I or II molecules and displayed on surface of APC cells. MHC class I and MHC class II molecules presents those microbial peptides to CD8 and CD4 T cells, respectively At the same time co-stimulatory proteins CD80 and CD86 on surface of APCs are upregulated, which enables naive T cell activation in the lymph node [7]. A scheme covering basics of antigen presentation is showed in
Figure 1.1.). As innate immunity cope with conserved structures of pathogens to overcome infection while developing no specific memory, adaptive immunity requires diversity in order to deal with vast range of pathogenic repertoite which are already exposed to innate system. In the naive state of T and B cells, upon encountering an antigenic determinant, a series of somatic recombination of genes that encode antigen receptors; T cell receptor (TCR) and B cell receptor (BCR) is initiated. This system allows generation of vast numbers of different receptors, specific to each epitope, with different specificity. When an antigen receptor is stimulated by an APC, the cell that receptor belongs to undergoes clonal expansion, rapid proliferation and commitment. This state is known as the formation of effector T and/or B cells, and at this stage, they are out of their naive state. B cells, however, cannot be activated de novo by APCs. They require a sub-population of T cells called T-helper cells for activation. TCRs and soluble BCRs (antibodies) specific for a peptide epitope portion of microbial antigen eventually help elimination of the insulting organisms. Adaptive immunity is specific and long lasting, due to establishment of B and T cells memory.
1.2
Innate Immune System
Innate immunity is the first line of defense of the immune system and composed of several different systems and cell types. As mentioned above, mucosal immune system covers the largest area that body encounters with pathogens or harmful substances. Some major components worth mentioning includes intestines, bronchial airways, mouth and mucosal surfaces. Moreover, epithelial tissues secretes mucosa that forge a natural barrier and antimicrobial peptides against invading pathogens [10]. Mucosal immune system also hosts several specialized immune cell types, such as mucosal-associated invariant T lymphocytes (MAIT) [11]. Thus, innate immunity provides first physical and chemical barriers against pathogens [12].
Figure 1.1: Activation of DC upon Ag internalization and presentation of epitopes to T and B cells. Adapted from [8, 9]
Innate immune system cells are challenged by diverse range of pathogens and it must have ability to deal with different complications. Therefore, immune system has cell types that are able to accomplish different tasks in case of an infection. Major cell types of innate immune system are phagocytes (i.e. neutrophils, monocytes/macrophages, DCs ), natural killer (NK) cells, mast cells, eosinophils and basophils.
NK cells destroy cells that lack MHC I molecule on their surface. All host cells normally express MHC I molecule on their surface, which prevent NK cells to attack host cells. In case of viral infection [13], or tumor growth [14, 15], MHC I molecule is downregulated and along with additional signals, NK cells recognizes and kills those altered host cells.
Mast cells, eosinophiles and basophiles are characterized by granules in their cytoplasm, and they are commonly called as granulocytes. Those granules are
histamine and heparin rich, along with chemokines and toxins. Upon infection, the contents of granules are released into environment. Histamine causes vasodilation and recruits other immune cells to site of the infection. Chemokines are also important for recruitment of other immune cells. Toxins are effective measures against pathogens. However, granulocytes are double edged swords of immune system, as they have active roles in allergic diseases [16, 17, 18]
Neutrophiles, monocytes/macrophages and dendritic cells are defined under common term phagocytes, due to their very alike working mechanisms when they encounter with pathogens. Neutrophils are the first cells that arrive the site of infection, and they help elimination of pathogens by releasing toxins or generating reactive oxygen species, such as hydrogen peroxide (H2O2), a process known as
respiratory burst). Macrophages are mature monocytes and both cell types utilize a similar system to eliminate pathogens. Macrophages differ from blood circulating monocytes as they reside on tissues. Arguably, macrophages are the most efficient type of the phagocytes, due to their ability to ingest large number of microbes. Dendritic cells are also digest microbial particles or infected cells. But their main role is not elimination of infection, rather antigen presentation to T cells, thereof mature dendritic cells are called the sentinel antigen presenting cells (APCs). Immature dendritic cells circulate through body. When an infection occurs, they migrate to site of infection, phagocytose pathogens or remnants of infected cells. They process microbial particles so that TCRs can bind them, remove them to their surfaces and present to T cells. Along with co-stimulatory molecules, this entire procedure ensures proper activation of T cells, consequently activation of adaptive immune system.
One major element of the innate system is the complement system. Complement system is actually a cascade of soluble proteins. Once this cascade is activated by presence of pathogens, complement system proteins are sequentially cleaved. Final product forms a pore structure in the membranes of pathogens, causing rapid lysis of the pathogens. Marking the pathogens via opsonization and attracting macrophages and neutrophils via chemotaxis are other crucial functions
of complement system.
Apart from cells and complement system, innate immune system is characterized by initiation of inflammation, a rapid and strong mechanism that prevents spread of infection. Inflammation is started by recognition of pathogens, through their PAMPs PRRs. PAMPs are reliable source to identify pathogens, due to their evolutionary conserved structures, presumably because they are vital for pathogens survival or function. Inflammation can be described as, and much precisely, concerted activation of immune system through communication of immune cells via chemokines and cytokines. Chemokine and cytokine secretion leads to migration of granulocytes, macrophages and dendritic cells, along with other immune cells, to the site of infection. Thereafter, immune cells try to eliminate the infection. However, once more, everything starts from recognition of pathogens by innate immune cells..
1.2.1
PAMPs and PRRs
As already mentioned numerous times, PAMPs of pathogens are recognized by PRRs of immune cells. PAMPs are evolutionary conserved and invariant structures among broad range of organisms belong to microbial world. PRRs are germline-encoded relatively small group of receptors that are highly expressed by immune cells.
Lipopolysaccharide (LPS), peptidoglycan (PGN), lipoteichoic acids and cell-wall lipoproteins, fungal cell wall product B-glucan, unmethylated cytosine-phosphate-guanine (CpG) motif rich bacterial genomic DNA, yeast zymosan, viral single and double stranded RNAs (ssRNA and dsRNA), are among widely studied PAMPs [4, 12, 19].
Some PRRs are secreted to body fluids. Mannan-binding lectin, C-reactive protein (CRP), and serum amyloid protein (SAP) are well known examples [20]. A group of PRRs are classified as cytoplasmic PRRs. Nucleotide binding
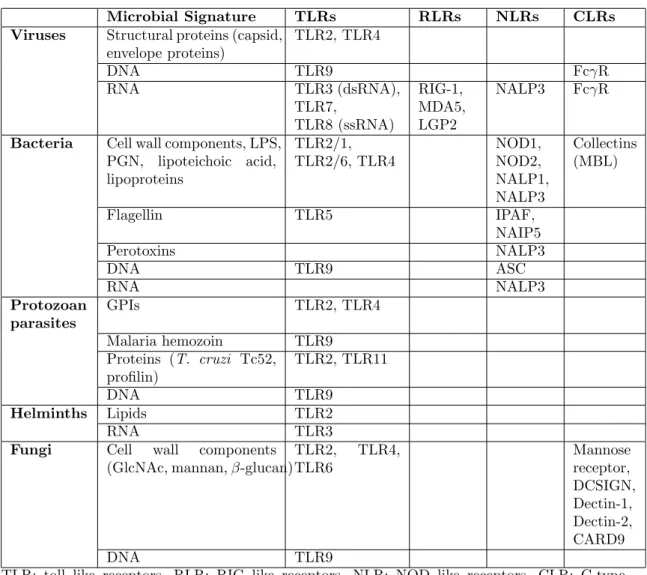
oligomerization domain (NOD)-like receptors (NLRs) and retinoic acid-inducible gene I (RIG)-like helicases (RIHs) are cytoplasmic PRRs [4]. NLRs are mainly responsible for detecting bacterial or viral components, while RLRs s and TLRs can recognize variety of PAMPs [20, 21]. A summary of PAMPs and PRRs is given in Table 1.1
Table 1.1: Pattern recognition receptors and their ligands. Adapted from Ishii et. al. [19]
Microbial Signature TLRs RLRs NLRs CLRs
Viruses Structural proteins (capsid,
envelope proteins) TLR2, TLR4 DNA TLR9 FcγR RNA TLR3 (dsRNA), TLR7, TLR8 (ssRNA) RIG-1, MDA5, LGP2 NALP3 FcγR
Bacteria Cell wall components, LPS,
PGN, lipoteichoic acid, lipoproteins TLR2/1, TLR2/6, TLR4 NOD1, NOD2, NALP1, NALP3 Collectins (MBL) Flagellin TLR5 IPAF, NAIP5 Perotoxins NALP3 DNA TLR9 ASC RNA NALP3 Protozoan parasites GPIs TLR2, TLR4 Malaria hemozoin TLR9 Proteins (T. cruzi Tc52, profilin) TLR2, TLR11 DNA TLR9 Helminths Lipids TLR2 RNA TLR3
Fungi Cell wall components
(GlcNAc, mannan, β-glucan)
TLR2, TLR4, TLR6 Mannose receptor, DCSIGN, Dectin-1, Dectin-2, CARD9 DNA TLR9
TLR: toll like receptors, RLR: RIG like receptors, NLR: NOD like receptors, CLR: C-type Lectin like receptors
TLRs are the most abundantly and extensively studied PRR family. Toll was originally identified in Drosophila (fruit fly) as an important molecule for
embryonic development [22]. Later on, it was revealed that a group of molecules which are associated with immune activation have surprising homology with Toll [23]. Not long after, immunogenic role of Toll was discovered and termed as Toll-Like Receptors (TLRs) in humans and mice have arisen as important immune system factors [24] . TLRs are members of IL1R superfamily and they contain ectodomain leucine-rich repeats (LRR) that mediate the recognition of PAMPs, a transmembrane region, and intracellular Toll-IL-1 receptor (TIR) domains that mediate downstream signaling pathways. They can reside on cell surface, as well as intracellular compartments (Figure 1.2).
Figure 1.2: Cell surface and endosome associated TLRs with their representative ligands. Note that some TLRs requires dimerization for their activation via their ligands. Adapted from Takeda and Akira [25]
1.2.1.1 Cell Surface Toll-Like Receptors
TLR1, TLR2, TLR4, TLR5, TLR6 and TLR11 (only in mice) are positioned on the cell surface. They are mainly responsible for recognizing microbial cell membrane molecules. TLR2 is usually forms heterodimers with TLR6 or TLR1 [26]. Therefore, those heterodimers and TLR2 itself has ability to recognize PAMPs that belong to diverse range of species [26]. In general, Triacylated lipopeptides signal
through TLR1-TLR2 heterodimers, while diacylated lipopeptides signal through TLR2-TLR6 heterodimers, although it is also suggested that not only lipid moiety but also peptide part is responsible for determining ligand-receptor interaction in hosts [27]. Ligands of TLR2 include LTA and PGN from Gram-negative bacteria, Zymosan from S. cerevisae and lipoarabinomannan from Mycobacteria or the hemagglutinin protein from measles virus [19].
TLR4 is one of the earliest identified TLRs and co-receptor for LPS [28]. It was demonstrated that TLR4 mediates the LPS responsiveness in TLR4 deficient mice, which were hyporesponsive to endotoxin challenge [25, 29]. ). Later studies discovered that, TLR4 actually is a co-receptor and LPS mediated signaling requires activation and collaboration of other molecules as well, such as CD14 and LPS binding protein (LBP) [30].
TLR5 recognizes bacterial flagellin. Flagellin is an important protein for bacterial motility [31]. Indeed, TLR5 is expressed on the basolateral side of the epithelia, but not on the apical side, which explains why only invading microbes, not commensal bacteria induce an immune response [32].
TLR11 is not present in humans, but present in mice and have a role in recognizing bacteria that infects bladder and kidney as it is highly expressed in bladder in kidney [33]. Additionally, protozoan profilin-like protein (i.e. toxoplasma gondii) is one of the major ligands for TLR11 [4, 34].
1.2.1.2 Intracellular Toll-Like Receptors
TLR3, TLR7 and TLR8 (functional only in human), TLR9 and TLR10 [25] are found in intracellular compartments (REFS). TLR3 recognizes dsRNA and ssRNA which are common and important intermediate products of viral replication [35]. Since TLR3 is positioned on intracellular compartments, it is also evident that TLR3 has important role against viral infection [36].The synthetic dsRNA analog polyinosinic-polycytidylic acid (polyIC) is an important candidate antiviral
reagent, due to its ability to activate TLR3 signaling [37].
TLR7 and TLR8 recognize ssRNA. Genomes of many RNA viruses are ssRNA and they were shown to be activated by RNA virus infection [36]. TLR7 is highly expressed in pDCs and upon activation of TLR7 signaling pathway, expression of antiviral type IFNs, most notably IFNa is induced in pDCs [38]. A prominent immune modifier and anti-viral reagent, resiquimod R848 (guanine nucleotide analog), is in fact a synthetic ligand of TLR7 [39]
TLR9 recognizes unmethylated CpG motifs. In addition to CpG suppression, mammalian genome contains methylated CpG residues. Of note, bacterial genome represent 25-30 fold more unmethylated CpG dinucleotides compared to mammalian genome. [40]. While physiological role of TLR9 is certainly significant, most of the literature is related to the immunotherapeutic applications of TLR9. Certain types of synthetic CpG ODNs can induce type I IFN secretion, while other CpG types are potent pro-inflammatory cytokine inducers [41]. It should be noted that many factors affect the final outcome, such as pH, compartmentalization, and sequence of CpG ODN along with their structure. [42, 43, 44]
1.2.1.3 TLR Signaling Pathway
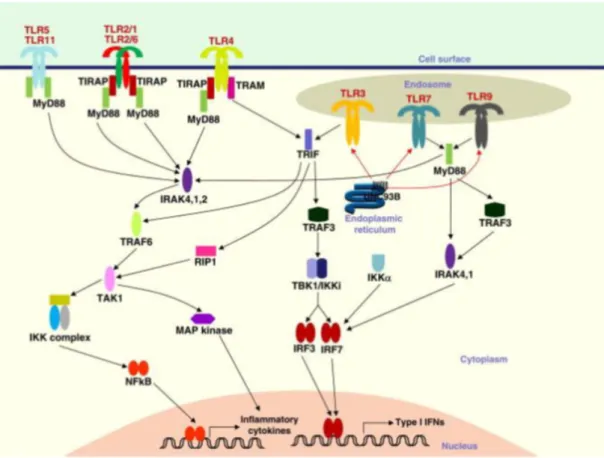
TLRs share many common elements in their signaling pathway. However, due to minor but essential differences, each TLR has specific response. TLRs can alter gene expression profile of host cells dramatically, via activating transcription factors such as NF-κB and IRFs. One of the earliest TLR downstream effector proteins was myeloid differentiation primary response gene 88 (MyD88). Later studies conceived that TLR3 signaling is MyD88-independent-TRIF dependent pathway and TLR4 signaling is possible through both pathways.
1.2.1.3.1 MyD88 Dependent Pathway: M MyD88 associates with the TIR domain of TLRs. Its importance for TLR signaling has been shown in MyD88
deficient mice, which are unresponsive to various TLR ligands [45, 46]. MyD88 is an adaptor protein that recruits IL-1 receptor associated kinases (IRAK) IRAK-1, IRAK-2, IRAK-M and IRAK-4 [47]. IRAK-2 and IRAK-M are inactive (36). IRAK-4 phosphorylates IRAK-1 [48] and activated IRAK1 interacts with TRAF6. Both AP-1 transcription factors and NF-κB transcription factor are activated by TRAF6 through distinct pathways. AP-1 TFs activation is induced by MAP kinases in which TRAF6 initiates the signal cascade. Concurrently, TRAF6 is involved in IKK mediated degradationof IKB, and NF-κB nuclear localization as a consequence, via activation of TAK1-TAB complex.
1.2.1.3.2 MyD88 Independent-TRIF Dependent Pathway: Possibility of a MyD88 independent TLR pathway was arisen when NF-κB nuclear localization was not halted but delayed in MyD88 deficient mice in response to LPS; although no cytokine expression was observed [45]. It seemed that TLR4 was able to induce signaling pathway regardless of MyD88, a defective one though. Further studies revealed that TLR3 also has a MyD88 independent pathway, but unlike TLR4, TLR3 completely relies on MyD88 independent pathway [49]. Instead of MyD88, TRIF and related protein TIRAP act as adaptor protein and mainly induces type I IFN expression via activation of IRF3. NF-KB signal was also affected by TRIF-dependent pathway.
1.3
Synthetic CpG ODNs
Immunostimulatory properties of CpG containing bacterial DNA was discovered in 1995 [51]. Later on, immunomodulatory effects of CpG ODNs are widely studied. CpG ODNs can be used as effective vaccine adjuvant, with relatively low adverse effect profile [52]. Consequently, two distinct classes of ODNs, Class A or D and Class B or K type ODNs were identified with differential activation of immune system. Regardless of their differences, distinct classes of CpG ODNs share some
Figure 1.3: Initiation of MyD88 and TRIF dependent signaling cascade upon TLR-ligand interaction. Adapted from [50]
common properties; minimum required length for immune stimulation is 8 bp, in optimum sequences, unmethylated CpG nucleotides are flanked by PuPu and PyPy bases in mice and PuPy and PuPy in humans, despite significant homology between murine and human TLRs (over 75 % homology exists). Finally, partial or complete modified backbone to reduce nuclease attack is necessary for specific classes to induce an immune activation.
1.3.1
A or D Type ODN
This class of ODNs (D ODN hereafter) has been characterized with partially modified backbone and polyG runs at the ends (i.e. PolyG-PS/PO/PS-PolyG). Palindromic sequences that are located before and after CpG nucleotides cause secondary structure formation. Assembly of two or more D type ODN via Hogstein Base pairing of Poly G caps also leads to formation of heterogeneous higher order structures. Of note, these concatamers are necessary for the D-ODN activity. It was also shown that palindromic sequences and polyG runs are crucial for D type ODN activation [53]. Macromolecular aggregation of D ODNs is recognized by scavenger receptor CXCL16 and causes localization of D type ODNs into early endosomes. Thereafter, D type ODNs directly promote strong and prolonged IFN and IFN expression from pDCs [54]. D-ODN also indirectly induce IFN and IP-10 from PBMC and contribute to NK cell-mediated cytolytic activity [55]. Activation of costimulatory molecules CD86 and CD80 somewhat moderate, an D type ODNs are weak inducers of pDC maturation [54].
1.3.2
B or K type ODNs
B or K type ODNs (K ODN hereafter) have fully phosphorothioated backbone. They do not have internal palindromic sequences or polyG tails. Usually 2-3 CpG motifs are required for optimum activity [56]. Unlike D type ODNs known as a strong type 1 IFN inducer, K type ODNs can induce very little if any IFN expression. However, they are very potent inducers of proinflammatory cytokines IL6 and IL12 from mouse spleen cells [57]. They also promote rapid maturation of pDCs. In physiological conditions, K type ODNs remain linear and do not aggregate.
1.3.3
Other Types of CpG ODNs
Two main CpG ODN types have different immune stimulatory properties. Many novel CpG ODNs were defined that try to recapitulate both D type and K type specific immune activation. For example C type ODN can induce both TNFa and IFNa from albeit lower than K ODN and D ODN respectively [58]. It has structural similarities with both type of ODNs; fully phosphorothioated backbone like K type ODNs and internal palindromic sequences like D type ODNs [59]. C type ODN captures properties of both K and D type ODN, but not at desirable rate. Many other novel CpG ODN types are defined, such as Y shaped ODN [60], however, their exact immunomodulatory natures yet to be cleared.
1.3.4
Competitive Action of Mechanisms of D and K Type
ODNs
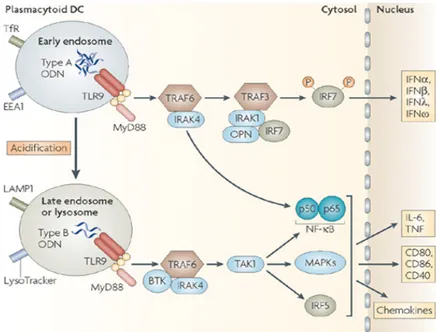
As mentioned above, K type and D type ODNs display a dichotomy in terms of immune stimulatory activities. Due to its ability to form higher order structures, recognition of D type ODNs through TLR9 requires CXCL16 involvement, a scavenger receptor. D type ODNs localize to early endosomes after CXCL6 mediated recognition, which leads to co localization of MyD88 and interferon regulatory factor-7 (IRF7) [61]. Subsequent events promote IFN secretion from pDCs, and IFN secretion from mouse spleen cells, which are inducers of cell mediated immune response. K ODNs preserve their linear structure in physiological conditions. Therefore, their recognition through TLR9 is CXCL16 independent. K ODNs are quickly localizes to late endosome and induces TNFa secretion from pDCs and leads to pDC maturation [62], eventually humoral immune activation [7]. Even though both CpG ODN types hold promising vaccine adjuvant properties, it is desirable to capture both types of immune regulatory properties in one single formula. Unfortunately, simultaneous administration of D and K type ODNs are not possible. Although they do not inhibit their binding,
uptake and localization kinetics, K type ODN inhibits D type ODN dependent activation [62, 63]. While K type ODN acts on both B-cells and pDCs, D type ODN only act on pDCs. D type ODN localizes to early endosome and induces IFNa expression. K type ODN localizes to late endosome induces TNFa secretion and promotes pDC maturation, thereby prevents IFNa secretion from pDCs [62, 63].
Figure 1.4: Differential immune activation of human pDC following D and K triggered signaling cascade. Adapted from [64]
K type ODN entered many clinical trials; however, D ODN entered few. D ODN has ability to spontaneously form heterogeneous high ordered structures. This uncontrollable nature of D ODN prevents its GMP production and FDA permission. Only administration via particles that can stabilize D type ODN can lead to clinical trials [65]. Therefore, new approaches have been trying to overcome this problem. One possible method is designing K-like ODNs that can have D type effects, as mentioned in previous section. Another method would be administration of K type ODNs embedded cationic lipid particles, which can helps localization of K type ODNs to early endosomes instead of late endosomes and IFN production [55].
1.4
Helicobacter Vaccine
Helicobacter is a helix shaped gram negative genus of bacteria. Some species have been found in gastrointestinal track of mammals and birds. It is estimated that 45-50 % human population was infected with Helicobacter pylori (H. pylori ), major infectious species in humans [66]. Although 85 % percent of the cases are reported to be asymptomatic, in the remaining cases colonization in the gastric lumen causes persistent inflammatory response, which eventually leads to gastritis (64). Non-pathogenic strains have been found to lack Cag pathogenicity island in their genome [67]. Helicobacter can survive in low acidic environment of gastric lumen by producing large amounts of urease and neutralizing acid [68]. Urease breaks down the urea to carbon dioxide and ammonia, which is a basic molecule and helps helicobacter survival in such extreme condition [69]. H. pylori is also able to use chemotaxis to move away from low pH lumen into mucosal surface of epithelia, which has considerably more neutral pH [70] owing to multiple flagella [71].H. pylori flagellin is able to evade TLR5 [72].
Treatment of H. pylori associated gastritis was aimed by combined antibiotic and proton pump inhibitor treatment in mid 19900s [73], since then this treatment modality is still used in the clinic [74]. In case H. pylori and complications are not eradicated, stronger antibiotics are used [74]. However, increasing antibiotic resistance of H. pylori strains became a major problem in recent years and infection has proved difficult to cure [75]. Besides, patient compliance and recurrent infections are often causes problems [76]. Therefore, development of vaccine against H. pylori is currently taking a lot of scientific attention.
1.4.1
Helicobacter Infection
Developing vaccine against H. pylori brings unique challenges. Unlike blood borne pathogens or viral infections, H. pylori infection and subsequent inflammation should be studied in mucosal immunity [77]. Due to its distinct dynamics, vaccine
development related to mucosal immunity should be handled separately [78, 79]. This is a further obstacle for development of efficient vaccine formulations against H. pylori. Another difficulty is lack of a proper animal model. Until Lee et al. introduced Helicobacter felis, a Helicobacter species isolated from cat, there were no gold standard mouse model for studying in vivo H. pylori infection [80, 81], although it is now possible to use H. pylori in mouse model [?, 81]. Furthermore, finding a proper and non-toxic mucosal adjuvant, efficient route of administration is another great challenge [82]. Nowadays, those adversities have been fairly overcome. Clinically, it was shown that H. pylori infected individuals were able to produce IgG antibody against H. pylori antigen [83]. IgA class antibodies are prime antibody type in mucosal linings and have critical role in mucosal immunity [84]. Indeed, oral delivery of microparticles encapsulating H. pylori lysates can induce IgA and IgG production in mice [85]. Using live vectors that express H. pylori related genes is another approach. This method uses a non-pathogenic bacteria as a vector and is reported to induce significant IgA production and reduced H. pylori colonization after challenge [86]. The above mentioned two methods have serious drawbacks, as there is no reliable data regarding to protective effect of the vaccine for the former and non-specific immune response due to live vector for the latter. There are also studies with conventional adjuvants, such as cholera toxin [87], but they are not feasible options for humans. CpG ODNs are highly effective adjuvants with minimal adverse effects. It is not surprising that last couple of years CpG ODNs are included in efforts to develop vaccine against H. pylori [88, 89, 90]
1.5
Liposome Technology
Liposomes are artificial vesicles composed of one or more lipid bilayers, which enclose aqueous compartments between bilayers and core aqueous phase [91]. Interior sides of lipid bilayers and inner aqueous compartments have hydrophobic and hydrophilic nature, respectively. This reciprocal feature of liposomes and
versatility in manufacturing are prime reasons for developing liposome-based technologies. Following seminal observation by Alec Bangham in mid 1960s; that lipids can form spherical structures in aqueous environments [92], Gregoriadis and Ryman for the first time successfully loaded these vesicles with proteins and injected in vivo and observed their fates [93].
Liposomes can exists in varying sizes, lipid composition, net charge and structure. Changing lipid composition can dramatically alter physicochemical properties of liposomes [94]. Lipid bilayers can be single or more, in case of single bilayer, liposome is called unilamellar, and multilamellar in case of latter. Liposomes ranging 0.5 uM and 4-5 uM is called large vesicles, bigger and smaller vesicles are called giant vesicles and small vesicles, respectively. Small unilamellar vesicles (SUVs) and large multilamellar vesicles (MLVs) are commonly used liposomes for pharmaceutical purposes, [95] whereas giant unilamellar vesicles are perfect model lipid membranes [96, 97]. SUV on the other hand are suitable either as transfection reagents or as imaging agents [98].
Liposomes are biocompatible vesicles and can entrap both hydrophobic and hydrophilic molecules in lipid bilayers and in aqueous compartments, respectively. This gives a broad range of materials that can be entrapped into liposomes. Unlike free administered drugs, liposomal drugs localize inside the cells and even inside cellular compartments more efficiently [99]. Moreover, liposomes protect their biological cargoes from nuclease and protease degradation [100, 101, 102]. Engineering liposomes is easy and intended to overcome possible problems during drug delivery. One such modification of liposomes is attaching polyethyleneglycol (PEG) to the liposomes, via either covalent bonding to lipids or embedding PEG containing molecules into lipid bilayers using hydrophobic moieties. PEGylated liposomes are called stealth liposomes since they are less susceptible to elimination from serum and elimination by reticuloendothelial system (90, 91). It is also possible to manufacture targeted liposomes by attaching in order to increase liposomal drug accumulation to the desired tissue or cell type [98, 103] (FIG-LASIC). Targeted liposomes are manufactured by attaching
molecules that are able to recognize specific sites in target tissue or cell, Igs most of the times. It is also possible to profit both stealth and targeted liposome delivery by covalently attaching antibody fragments that lack Fc portion to the PEG chains [101].
Figure 1.5: Frequently used liposomes for therapeutic purposes; conventional, cationic, stealth and targeted liposomes. Adapted from Lasic (1997) [104]
1.5.1
Liposomal Vaccines
Liposomal vaccine formulations are capable of combining two signals in one package that is a necessary step to achieve therapeutic vaccination (i.e. antigen plus adjuvant). In fact, liposomes can have their adjuvant effects in certain formulations [105, 106]. Hence, liposomes are among promising candidates for new generation vaccine formulations [107]. A phase IIB clinical trial for liposomal L-BLP25 peptide, which is a fragment of a highly expressed glycoprotein in common cancers, against non-small lung cancer showed that liposomal vaccine formulation significantly increased median survival rate [108]. It is also worth mentioning, co-encapsulation of the antigen and adjuvant into single liposomal compartment
can boost the performance of vaccine formulation [109]
TLR ligands were also used as liposomal adjuvants [110, 111], nucleic acid based TLR ligands in particular, due to ease of their incorporation into cationic liposomes. Cationic liposomes that co-encapsulated poly(I:C) and synthetic cord factor is shown to induce CTL dependent tumor regression [112]. In another study, co-encapsulation of different TLR ligands (poly(I:C) and CpG ODN) into anionic liposomes was proven to induce TH1 biased immunity and robust response against antigen ovalbumin, despite possible steric hindrance [?]. Hence, liposomal vaccine formulations containing nucleic acid based TLR ligands as adjuvants clearly demonstrated encouraging results, which support further studies.
Chapter 2
Aim of The Study
CpG ODNs are potent immunotherapeutic agents and already appeared in clinical trials for variety of purposes. Liposomal delivery systems are also extensively utilized. In the first part of this study, we aimed to investigate in vitro performance of different types of liposomes that encapsulated CpG ODNs in a mouse macrophage cell line and spleen cells. Best performing formulations were tested in a H. felis vaccine model. Up to date, there is no other study that tries to combine liposomal vaccination methods and CpG ODNs.
K and D type ODNs have distinct immune stimulatory properties. A good immunenotherapeutic reagent would have both ability. However, differential immune activation mechanisms of K and D type ODNs due to their subcellular fates are major hamper for their simultaneous administration. Despite efforts to overcome this problem, there are no successful solution. In the second part of this study, our purpose was to alter subcellular localization of D and K types ODN by encapsulating them into liposomes in order to to recapitulate their individual effect on human PBMCs when they were administered simultaneously.
Chapter 3
Materials and Methods
3.1
Materials
3.1.1
ELISA Reagents
Mouse cytokine ELISA reagents, including monoclonal catching antibody, biotinylated reporter antibody, recombinant cytokines and streptavidin-alkaline phosphatase (SA-AKP) were purchased from BioLegend (USA). SA-AKP substrate p- nitrophenyl phosphate disodium salt (PNPP) was purchased from Thermo (USA). Mouse Immunoglobulin ELISA reagents; goat anti-mouse IgG, IgG1, IgG2a monoclonal antibodies conjugated with alkaline phosphatase (AKP) were obtained from Southern Biotech (USA). Human cytokine ELISA reagents for IL6 and TNFα were from Biolegend (USA). For IFγ and IFN-a2α, reagents were purchased form BD (USA) and MabTech (USA) respectively.
3.1.2
TLR Ligands
CpG ODNs (TLR9 ligand) were either synthesized by Alpha DNA (Montreal, Canada). or synthesized in Therapeutic ODN Research Lab (THORLab) (Bilkent, Ankara, Turkey) with a MerMade6 Oligonucleotide Synthesizer. Peptidoglycan (PGN) (isolated from B.subtilis) was from Fluka (Switzerland), lipopolysaccharide (LPS) which was isolated from E. coli was from Sigma (USA). Detailed informaiton on CpG ODNs were given in Table 3.1.
Table 3.1: List of Oligonucleotides that are used in this thesis. Capital letters denote a nucleotide with phosphorothioate backbone and those in lower cases show phosphodiester backbone. K3, K23 and 1555 are K type ODNs whereas D35, 1466 and D3CG are D type ODNs
K3 (20mer) 50-ATCGACTCTCGAGCGTTCTC-30 K3 Flip (20mer) 50-ATGCACTCTGCAGGCTTCTC-30 D35 (20mer) 50-GGtgcatcgatgcaggggGG-30
D35 Flip (20mer) 50-GGtgcatgcatgcaggggGG-30 K23 (12mer) 50-TCGAGCGTTCTC-30
1555 3cg (20mer) 50-GACGTTGACGTTGACGTTGG-30 1466 Acore MB (16mer) 50-TCaacgttgattcaAA-30
D3CG MB (20mer) 50-GGtcgatcgatcgaggggGG-30
3.1.3
Lipids
Cholesterol was purchased from Sigma Aldrich (USA). L-α-Phosphatidylcholine (PC), 3α-[N-(N’,N’-Dimethylaminoethane)-carbamoyl] Cholesterol Hydrochloride (DC-Chol), 1,2-Dioleoyl-sn-Glycero-3-Phosphoethanolamine-N- [Methoxy(Polyethylene glycol)-2000] (Ammonium Salt)(PEG-PE), 1,2-Dioleoyl-sn- Glycero-3-Phosphoethanolamine (DOPE) were all from Avanti Polar Lipids (USA).
3.2
Methods
3.2.1
Cell Line Maintanence
RAW 264.7 cell line, murine macrophage-like cells were cultured in 10% FBS supplemented complete RPMI-1640 media. Medium was changed every 2-3 days. Upon reaching 80% confluency, cells were passaged with 1:3 ratio or used for in vitro stimulation.
3.2.2
Stimulation of RAW 264.7 cells for Gene Expression
Analysis
2.5×10⁶ cells were transferred to 15 ml falcons and each tube was completed to 900 µl wth 5% FBS supplemented RPMI-1640 media. Stimulants were added in 50 µl 5% FBS supplemented RPMI-1640 media. Tubes were kept in tilted position with loosened caps until termination of the experiment. Incubation periods for gene expression studies were 2 and 4 hours.
3.2.3
Spleen Single Cell Suspension Preparation
Mice were sacrificed by cervical dislocation and spleens were removed into 35 mm petri dish that contains 2 ml ice cold 2% FBS supplemented complete RPMI-1640 with sterile surgical equipment. Then spleens were smashed with back of a sterile syringe plunger with circular movements in order to obtain single cell suspension. Media was transferred to 15 ml falcon with sterile pasteur pipette leaving connective tissue and fat clumps in the petri dish. Then whole cell suspension is completed to 10 ml and washed twice at 375 g for 5 minutes. After the final wash step, cells were counted and adjusted to appropriate concentration for further use.
3.2.4
Cell Counting by Hemocytometer
After the final wash step, cells were resuspended in 1 ml 5% FBS containing complete RPMI-1640. Then 20 µl cell suspension were diluted 1:50 with 980 µl media. Another 15 µl diluted cell suspension is mixed 15 µl Trypan blue (1:1) and counted with Neubaer cell counting chamber. 16 cells from each corner were counted and average cell number per 1 mm2 was founded under light microscope.
Each 4×4 cell at corners hold 0.1 mm3 liquid as depth between coverslip and chamber is 0.1 mm and they have 1 mm2 area. Therefore, total cell number in 1 ml can be calculated by formula;
Average cell number × 2 × 104 × 50(dilution factor) = total cell number.
3.2.5
Cell Counting by Flow Cytometer
After single cell suspension were prepared in 1 ml, 10µl of cell suspension was added to 990 µl of isotonic solution in 5 ml polystyrene round bottom tubes (BD, Ref no: 352052). Then particles in 20 µl of resulting suspension were counted in Accuri C6 Flow Cytometer. Only live and nucleated cells were gated and counted, apoptotic, dead or non-nucleated blood cells were ignored. Final number was multiplied with 5.000.
3.2.6
In vitro Splenocyte Stimulation
For stimulation in 96 well cell culture plates with lid (CellStar), 100 µl or 125 µl of 4×10⁶ cells/ml suspension were conveyed to each well(400.000 cells/well
and 500.000 cells/well respectively). Each specific reagent was added in 50 µl 5% FBS supplemented RPMI-1640 media. Finally, each well was completed to 200 µl or 250 µl with 5% FBS supplemented RPMI-1640 media in order to have 2×10⁶ cells/ml. Stimulations were performed in at least duplicate wells and each
experiment was repeated twice at different times. Supernatants were collected after 24-36 hours depending on the secretion of specific cytokine to be examined. For gene expression studies, 2.5×10⁶ cells were transferred to 15 ml falcons and
each tube was completed to 900 µl. Stimulants were added in 50 µl 5% FBS supplemented RPMI-1640 media. Tubes were kept in tilted position with loosened caps until termination of the experiment. Incubation periods for gene expression studies were 2 and 4 hours.
3.2.7
Human Peripheral Blood Mononuclear Cell (PBMC)
Isolation
Blood samples from healthy donors were collected into vacutainer tubes that contains EDTA as anti-coagulant (BD Vacutainer, purple cap). 15 ml ficoll (Lymphocyte Separation Medium, Lonza) was placed into 50 ml falcon tube and 22.5 ml. blood from anti-coagulant tubes was gently layered onto the ficoll reagent. Samples were centrifuged at 500 g for 30 min at room temperature. It is important to set break off to keep separated layers intact. The buffy coat that PBMCs reside was collected using sterile pasteur pipette. Cells were washed twice with 50 ml 2% FBS supplemented RPMI-1640 media in a new 50 ml falcon tube (500 g at RT) to ensure no ficoll reagent was left. At the end of the last wash, pellet was resuspended in 1 ml 5% FBS supplemented RPMI-1640, samples from same donors were polled together and cells were counted.
3.2.8
In vitro PBMC stimulation
In vitro PBMC stimulation experiments were done as follows, cells were collected, isolated and counted as described above (Section 2.2.7). Then, 2.5×10⁵-3×10⁵cells
in 100 µl were layered into wells of 96 well plates (Preferred cell number for each well was 3×10⁵, however, depending on total cell number and experimental groups,
2.5×10⁵/well was also used). Different ODN formulations were added in 50 µl and
each well was then completed to 250 µl, yielding 1×10⁶-1.2×10⁶ cells/ml. 220-230
µl of supernatants were collected from each well after 36 hours of incubation.
3.2.9
Liposome Preparation
Phospholipids and cholesterol were prepared as 10 mg/ml or 20 mg/ml stock solutions in chlorofrom. Stock solutions were stored at −20◦C. Various phospholipids and cholesterol mixed in different ratios in round bottom flasks to obtain liposomes as shown in Table 3.2 . Chloroform was evaporated using a rotary evaporator (ILVAC, Germany) in which relatively uniform thin lipid film was obtained. A brief nitrogen stream was applied onto thin lipid film (30-40 sec) to remove residual chloroform. Round bottom flasks were sealed with glass caps in order to prevent oxygen saturation to increase following nitrogen streaming, presumably minimizing lipid peroxidation. 1 ml of PBS were added for each 20 µmol thin lipid film. If less than 20 µmol lipid was used, up to 10 µmol, PBS amount was adjusted accordingly, but if lipid film contained less than 10 µmol total lipid, no less than 500 µl PBS was used. 20-30 glass beads were added to each flask and lipid film was disrupted by moving flasks rotationally. This step generated large empty multilamellar vesicles. Resulting milky solution was collected using 1 ml disposable micropipette tip. 100 µl PBS were added again onto glass beads to ensure most of the liposomes that were entrapped on glass beads were collected. In order to generate small unilamellar vesicles (SUVs), which arguably most suitable form of liposomes for encapsulation, liposomes were sonicated 5 times for 30s with an amplitude of 40% at +4◦C and 5 times for 30s with an amplitude of 70% (VibraCell, SONICS, USA). Liposomes were kept on ice for 10 seconds in between sonications to prevent excessive heating. For 20 µmol lipid, 1 mg ODN was added to SUVs. If there were less than 20 µmol or SUVs were aliquoted, ODN amount was adjusted properly (1mg ODN/20 µmol lipid). ODN-SUV mixture was then snap frozen in liquid nitrogen and lyophilized (Benchtop K, Virtis, USA). Dehydrated
ODN-liposome mixtures appeared as powders after this step and encapsulation was achieved during controlled rehydration step, as previously reported (referans). Briefly, if the sample volume was more than 300 µl, 1:10 volume of DNase RNase free ddH2O of the final volume prior to lyophilization was added. (e.i. 50 µl DNase
RNase free ddH2O was added for 500 µl liposome-ODN mixture). If it was less
than 300 µl, 30 µl DNase RNase free ddH2O was added onto powder and vortexed
for 15 s every 5 min for 5 times at RT. Same amount of PBS was added to mixture and vortexed for a few seconds. Then final volume was adjusted to yield 1µg/µl ODN. Liposome preperations were stored at +4◦C until use.
Table 3.2: Lipid composition and molar ratios for different liposomes, taken from another study by Gursel et al. [115]
Liposome Type Liposome Composition (molar ratio) Neutral PC:Chol (1:1)
Anionic PC:DOPE:PS (1:0.5:0.25) Cationic DC-Chol:PC:DOPE (4:6:0.06)
Stealth Chol:DOPE:PEG-PE (4:6:0.06) Cationic-Stealth (SSCL) DC-Chol:DOPE:PEG-PE (4:6:0.06) PC, phosphatidylcholine; Chol, cholesterol;
DOPE, dioleylphosphatidylethanolamine; PS, phosphatidylserine; DC-Chol, dimethylaminoethanecarbamol-cholesterol;
PEG-PE, polyethylene glycol-phosphatidylethanolamine
3.2.10
Enzyme Linked ImmunoSorbent Assay (ELISA)
3.2.10.1 Cytokine ELISA
When desired time point was reached, 96 well plates were spun at 400g for 5 minutes. Supernatants (170-220 µl) were collected into new 96 well plates and either immediately used or stored at -20 until another use. PolySorb Nunc Immuno Plates were coated with monoclonal antibodies against mouse or human cytokines (50 µl/well) and incubated for 4 hours at RT or for ON at +4◦C. As each antibody against different cytokines optimized at different concentrations,
working concentrations for coating antibodies were given in Table 3.3. Coating antibody solution was discarded and wells were blocked with 200 µl 5% w/v BSA-1X PBS 0.025% Tween-20 at RT for 2 hours. Plates were washed with PBS-Tween 20 (0.05% Tween) 5 times. PBS-Tween 20 was kept in wells in between and plates were rinsed with ddH2O 3 times. Plates were dried by tapping.
Washing was repeated after subsequent steps. 50 µl supernatants and recombinant cytokine standards were added into the wells. Starting concentrations for cytokine standards (duplicate) were given in Table 3.4. Standards were serially diluted 2 fold with 50 µl 1X PBS 7 or 11 times. Two wells were left with 50 µl 1X PBS for blank measurement. Samples and standards were incubated ON at +4◦C. Plates were washed and Biotin conjugated antibodies against human and mouse cytokines that were diluted (1:1000) in %5 v/v FBS-1X PBS %0.025 Tween-20 and 50 µl added into each well and incubated at RT for 3 hours. During this incubation, Streptavidin-Alkaline Phosphatase (SA-AKP) was diluted (1:3000) in the same buffer as biotinylated antibodies, since SA-AKP works best when prepared at least 1-2 hours beforehand. After washing of plates, 50 µl diluted SA-AKP were added to each well. After 1 hours of incubation at RT, Plates were washed and PNPP substrate was added (50 µl/well). For one plate, one PNPP tablet was dissolved in 4 ml ddH2O and 1 ml 5X buffer was added afterwards. Until 2X serially diluted
recombinant proteins generate an S-shape standard curve, ODs at 405 nm were read after each 30 min intervals with an automated plate reader (BioLabs).
Table 3.3: Working concentrations for coating antibodies
Anti mouse IL6 2 µg/ml Anti mouse IL12 4 µg/ml Anti mouse IL10 7.5 µg/ml Anti human IL6 2 µg/ml Anti human TNFα 3 µg/ml Anti human IFNγ 5 µg/ml Anti human IFNα 5 µg/ml
Table 3.4: Starting concentrations for recombinant cytokines
Recombinant mouse IL6 1000 ng/ml Recombinant mouse IL12 500 ng/ml Recombinant mouse IL10 50 ng/ml Recombinant human IL6 1000 ng/ml Recombinant human TNFα 1000 ng/ml Recombinant human IFNα 250 ng/ml
3.2.10.2 IgG ELISA
IgG ELISA was very similar to cytokine ELISA except a few changes. Washing procedure was identical and incubation times were very similar. PolySorb Nunc 96 well plates were coated with 50 µl 5 µg/ml soluble part of total textith. felis cell extract, which was a kind gift of Ayca Sayı Yazgan (ITU) and incubated ON at +4◦C. Wells were blocked with same blocking buffer for 2 hours at RT as cytokine ELISA and washed. Sera from mice was diluted as follows in different 96 well U bottom plates; First row was prepared by mixing 40 µl serum with 240 µl 1X PBS in order to obtain 1/7 titration. 210 µl 1X PBS were added to rows beneath. 70 µl from the rows above were added to rows below, in which samples were titrated 1:4 at each row. Samples were diluted one time 1:7 and seven times 1:4. 50 µl of serum titrates were added to each well and incubated ON at +4◦C. Plates were washed. Antibodies that were raised against heavy chain of mouse antibody subclasses or against total IgG directly linked to alkaline phosphatase (AKP). Antibodies against total IgG, IgG2a and IgG1 were diluted 1:2000 in 5% v/v FBS-1X PBS 0.025% Tween-20 whereas antibodies against IgA were diluted 1:1000. 50 µl diluted AKP-linked antibody were added to wells and incubated at RT for 2-3 hours. Plates were washed again and PNPP substrate was added. OD measurements at 405 nm were taken in every 30 minutes after PNPP addition.
3.2.11
Total RNA Isolation
As stimulations for gene expression studies were done in 15 ml falcon tubes, samples were directly centrifuged at 500 g for 5 minutes. All centrifugations were done at +4◦C and all steps were completed on ice during RNA isolation. Supernatants were discarded and pellet was resuspended with ice cold PBS, centrifuged again at 500 g for 5 minutes. Supernatant was again discarded and 1 ml Trizol reagent (Invitrogen) directly added onto pellet. Mixate was homogenized by repetitive pipetting and transfered to 1.5 ml eppendorf tube. In order to reach critical 5:1 phenol chloroform ratio in phenol-chloroform extraction method, 200 µl of chloroform (Sigma) added to 1 ml homogenate and tubes were vigorously shaken for 10-15 seconds. Samples were incubated 3 minutes at RT before centrifugation at 16.000 g for 17 minutes. Approximately 450-500 µl of clear upper phase (aqueous phase) was transferred to new 1.5 ml eppendorf tubes and 500 µl isopropanol was added and tubes were gently inverted to ensure proper mixation, followed by incubation for 10 minutes at RT. Samples were spun at 16000 g for 15 minutes. Supernatants was discarded and 1 ml 75% ethanol was added. At this points, in order to remove trace amounts of isopropanol, samples were vortexed just long enough to move pellet. Samples were spun at 6000g for 8 minutes and gently washed with >99.9% ethanol. Samples were centrifuged once more at 6000g for 8 minutes, supernatant was discarded, and samples were dried in a petri dish in tilted position. Dried pellets were dissolved in 20 µl DNAse RNAse free water. RNA quality and quantity was assessed by OD measurements at 260 and 280 nm, which were obtained by NanoDrop ND1000 spectrophotometer. Isolated RNA samples were expected to have a 260/280 ratio between 1.8-2.0, which is an indicator minimal DNA, protein and organic solvent contamination. For samples that did not have proper 260/280 ratio, ethanol washing steps were repeated, until acceptable values were reached.
3.2.12
cDNA Synthesis
cDNA was synthesized from total RNA with ProtoScript First Strand cDNA Synthesis Kit (NEB) according to manufacturers instructions. Briefly, 1 µg of total RNA was mixed with 100 ng oligo(dT)15 primer (1 µl) and each sample was completed to 8 µl with DNAse RNAse free water. After a pre-denaturation step (5 min at +65◦C),10 µl RT Buffer (including dNTP mix and 10 mM MgCL2) and 2 µl M-MuLV RNase H+ reverse transcriptase (includes RNase inhibitor) were added to tubes. samples were spun down quickly. Reaction conditions were as follows; 1 hour at +42◦C, 5 minutes at +85◦C. cDNAs were stored at −20◦C for further use.
3.2.13
PCR
Primers specific to mouse genes were designed NCBI0s primer designing tool (Primer BLAST) which uses Primer3 for primer designing and NCBIs database along with BLAST and global alignment algorithms to screen primer pairs availability. All primers were further analyzed via online UCSC in Silico PCR tool to test primer pairs with different databases and algorithms. Detailed information on mouse primers and their reaction conditions were given in Table 3.5 and Table 3.6 respectively.
PCR reaction mixtures were prepared with Quick-Load Taq 2X Master Mix (NEB) which loading dye was included in MAster Mix directly. Final volume was 25 µl for each primer pair which contained 12.5 µl Master Mix, 1.5 µl cDNA solution, 1 µl from forward primer and 1 µl from reverse primer and 9 µl ddH2O.
Table 3.5: Designed mouse primers and amplicon sizes
Primer Sequence Amplicon Size mIL1β Forward 50-GCTGCTTCCAAACCTTTGAC-30 431 bp
Reverse 50-GGCCACAGGTATTTTGTCGT-30
mIL6 Forward 50-TGGAAATGAGAAAAGAGTTGTGC -30 120 bp Reverse 50-CAGTTTGGTAGCATCCATCATT -30
mMIP1α Forward 50-ACCATGACACTCTGCAACCA-30 238 bp Reverse 50-AGGCATTCAGTTCCAGGTCA-30
mIP10 Forward 50-GCCGTCATTTTCTGCCTCAT-30 127 bp Reverse 50-GCTTCCCTATGGCCCTCATT-30
mTLR9 Forward 50-AGTGTCACTTCCTCAATTCTCT -30 118 bp Reverse 50-TTCGACGGAGAACCATGTTG -30
mGAPDH Forward 50-AGCTCATTTCCTGGTATGACA -30 128 bp Reverse 50-CTCTCTTGCTCAGTGTCCTT -30
Table 3.6: PCR conditions for mouse primers Gene Names
PCR Steps (Temp; Time) mIL6, mTLR9 & mGAPDH mIL1β,mMIP1α & mIP10 Initial Denaturation 94◦C; 50 94◦C; 50 Denaturation 94◦C; 3000 94◦C; 3000 Annealing 60◦C; 3000 55◦C; 3000 Extension 72◦C; 4000 72◦C; 4000 Cycle # 30 35 Final Extension 72◦C; 50 72◦C; 50
3.2.14
Agarose Gel Electrophoresis
Agarose gel was prepared with 2% (w/v) agarose in 150 ml 1X TAE buffer. Ethidium bromide was added as 1 µg/ml. Lanes were loaded with 10 µl PCR product. 3 µl 50-500 bp or 100-1000 bp DNA ladders (BioLabs, USA) were used as markers. Gels were ran at 110V for 50-55 minutes and visualized under UV transilluminator (Vilber Lourmat, France).
3.2.15
Immunization Protocol
Five adult female C57/BL6 mice per group were tail bled prior to immunization (d=-1) and one day later (d=0) they were injected with liposomes that co-encapsulated 15 µg soluble whole . . . H. felis extract and 15 µg ODN subcutaneously. Two weeks later, booster injection was done (d=14). Just one day before booster injection (d=13), animals were tail bled and sera were collected. Two weeks (w=4) and six weeks (w=8) after booster injection, animals were tail bled and sera were collected again. Timeline for immunization protocol was given in Figure 3.1
Figure 3.1: Timeline for immunization of mice with CpG and H. felis cell extract or liposomes co-encapsulating CpG and H. felis cell extract
3.2.16
Sera Collection from Immunized Mice
Mice were bled prior to immunization, one day before booster injection, 2 weeks after booster injection and six weeks after booster injection. Blood was obtained from tail veins of animals and collected to round bottom borosilicate glass test tubes. Blood samples were incubated at +37◦C for 2 hours. After incubation, clot and remaining liquid part can be separated. Liquid part from each sample was collected to 1.5 ml eppendorf tubes, centrifuged at 6000 g for 5 min at RT and cell and cell debris free supernatants were collected to 96 well plates and samples were stored −20◦C until use.