Full Terms & Conditions of access and use can be found at
https://www.tandfonline.com/action/journalInformation?journalCode=geac20
International Journal of Environmental Analytical
Chemistry
ISSN: (Print) (Online) Journal homepage: https://www.tandfonline.com/loi/geac20
Distribution of elemental compositions of zeolite
quarries and calculation of radiogenic heat
generation
Ş. Turhan , S. Tokat , A. Kurnaz & A. Altıkulaç
To cite this article: Ş. Turhan , S. Tokat , A. Kurnaz & A. Altıkulaç (2020): Distribution of elemental compositions of zeolite quarries and calculation of radiogenic heat generation, International Journal of Environmental Analytical Chemistry, DOI: 10.1080/03067319.2020.1839439
To link to this article: https://doi.org/10.1080/03067319.2020.1839439
Published online: 28 Oct 2020.
Submit your article to this journal
Article views: 29
View related articles
View Crossmark data
~ ~~ 13'
1.111
II
13' 13' CrossMdrkDistribution of elemental compositions of zeolite quarries
and calculation of radiogenic heat generation
Ş. Turhana, S. Tokata, A. Kurnaza and A. Altıkulaçb
aDepartment of Physics, University of Kastamonu, Kastamonu, Turkey; bUla Ali Koçman Vocational School,
Muğla Sıtkı Koçman University , Ula, Muğla, Turkey
ABSTRACT
The effectiveness ofthe use of zeolites in different industrial pro-cesses depends on their physical-chemical properties that are dis-tinctly connected to their geological deposits. In this study, major oxides, eco-toxic metals (Cr, Co, Ni, Cu, Zn, As, Zr, Cd and Pb), and rare earth (Y, La, Ce, Pr and Nd), radioactive (Th and U) and other trace elements contents of eighty-one zeolite samples collected from four different zeolite quarries in Gördes in Turkey were ana-lysed by using energy dispersed X-ray fluorescence spectrometer. Also, pH values and SiO2/Al2O3 ratios were determined for zeolite
samples. In addition, radiogenic heat generation (RHG) caused by radiations emitted from uranium (U), thorium (Th) and radioactive potassium (40K) in zeolite samples wereestimated.Gördes zeolite contains major oxides, on average, 75.1% SiO2, 14.1% Al2O3, 3.2%
K2O, 2.4% CaO, 1.7% Fe2O3, 1.4% MgO, 1.3% Na2O. The average
concentration of As, Cd, Pb, Th and U analysed in zeolite samples were found as 24.8, 2.1, 47.830.1 and 6.0 mgkg−1, respectively. According to average SiO2/Al2O3 ratios, the ZO1 quarry contains
middle silica zeolites while ZO2, ZO3 and ZO4 quarries contain high silica group zeolites. RHG values estimated for zeolite samples varied from 2.3 µWm−3to 4.1 µWm−3.
ARTICLE HISTORY
Received 8 September 2020 Accepted 15 October 2020
KEYWORDS
Zeolite; major oxides; eco- toxic metal; uranium; thorium; radiogenic heat generation; Gördes
1. Introduction
Natural zeolites, which have become an important industrial mineral because of these properties, are widely used in environmental protection, agriculture, animal husbandry, energy, mineral-metallurgy and other industrial areas [1,2,3]. One of the most studied zeolites in basic and applied research is clinoptilolite, also known as clino zeolite.
The structure of the zeolite mineral, which is formed of hydrated natural silicates of alkali and alkaline earth elements as a result of the change of volcanic ash in the water environment millions of years ago, is very interesting and complex [4]. The primary structural units of the zeolites are SiO4 and AlO4 tetrahedra. These units are connected to the secondary structure units via oxygen ions to form a three-dimensional crystalline lattice structure [5]. The displacement of Si with Al defines the negative charge of the zeolite frame, which is compensated by alkali and alkaline earth metal cations. Therefore, natural zeolites appear as cation exchangers because they have a negative charge on the CONTACT Ş. Turhan [email protected]
INTERNATIONAL JOURNAL OF ENVIRONMENTAL ANALYTICAL CHEMISTRY https://doi.org/10.1080/03067319.2020.1839439
© 2020 Informa UK Limited, trading as Taylor & Francis Group
~ Taylor&FrancisGroup
surface. Displacement in the zeolite lattice is not limited to Si-Al substitutionand Fe, B, Cr, Ge andTi atoms can also replace Si [5].The most general formula of natural zeolites with more than 50 known species is given as follows [6]:
Li; Na; K
ð ÞxðMg; Ca; Sr; BaÞy Al x þ 2yð ÞSin ðxþ2yÞO2n
� �
�m0H2O (1)
where x denotes the number of monovalent metal ions, y denotes the number of divalent metal ions, n denotes half the number of oxygen atoms, and m0 denotes the number of water molecules.Zeolites are used in many different industrial fields as absorbers, cata-lysts, molecular sieves and ion-exchange materials due to their size and shape.
There are significant natural zeolite reserves in the world, which are the main compo-nents of volcanic origin Cenozoic sedimentary rocks [7]. Approximately 3–3.5 million tons of zeolite in horizontally deposited tuff is extracted or produced as an important industrial mineral by open pit operation method worldwide [7].Turkey has a wide variety of mineral deposits such as chromium, copper, zinc, lead, gold, boron,feldspar, marble, perlite, pumice, sepiolite,barite clay, sand, limestone, mica, zeolite etc. due to its extremely complex geology and its location on Tethyan Metallogenic Belt [4,8].Turkey has signifi-cantly larger and richer zeolite reserves [3]. In Turkey, a well-known, the most common and important zeolite deposits are clinoptilolite and heulandite. Turkey’s visible and probable zeolite (clinoptilolite and heulandite) reserve is estimated to be 345 million tonnes [9]. Turkey’s most important reserves of clinoptilolite and heulanditeare located in Gördes (Manisa) and Bigadiç (Balıkesir) in Turkey’s western Anatolia region [3]. In 2008, Turkey produced 100,000 tons of zeolite [7]. There are open quarries in the Gördes region that produce a wide range of natural zeolite products, which export to more than forty- five countries. Gördes zeolites are used in agriculture and water treatment, especially in animal feed additives in Turkey [10].The chemical composition of zeolites plays an important role in the synthesis, characterisation, and more effective use of zeolites. For this reason, it is important that the major, minor, and trace element distributions of zeolite quarries are accurately and precisely determined and updated over time. Although there are many studies on the absorbent, catalyst, ion exchange, and molecular sieve properties ofGördes zeolites used in different industrial sectors [11,12,13,14,15,16,17,18,19,20,21], a few studies wereperformed to determine the elemental distribution of zeolite quarries [7,22,23,24,25,26].Özen [7] investigatedthe pozzolanic and mineralogical properties of clinoptilolite, mordenite,and analcime zeolite samples. Diaz and Peraza [22] analysed the concentrations of 38 elements in zeolite samples collected from four Cuban zeolite deposits using instrumental neutron activation analysis (INAA) and X-ray fluorescence (XRF) spectrometric method.They suggested that the use of Cuban natural zeolites con-taining high toxic elements such as As, Hg, U, etc. should be restricted in agriculture and pharmaceutical and sugar industries.Bilgin [24] analysed oxides (SiO2, Al2O3, Fe2O3, CaO, MgO, Na2O,K2O) in the four zeolite samples collected from four different zeolite fields from Gördes (Manisa) region using XRD and microscope.Albayrak [25] examined miner-alogical, chemical and thermal analysis-gravimetric properties of zeolite samples collected from Manisa Gördes region by using XRD, SEM and DTA-TGA techniques. Kurudireket al. [26]performed the elemental analysis of a zeolite (clinoptilolite) sample obtained from Manisa Gördes zeolite by using a wavelength dispersed X-ray fluorescence (WDXRF) spectrometer.
According to our literature research, there is no detailed study on the determination of the elemental distribution of zeolite quarries in the Gördes region and estimation of radiogenic heat generation from the zeolite sample. The aim of this study is to determine the pH values and chemical distributions of zeolite samples collected from four commer-cially operated zeolite quarries in the Gördes and to estimate the radiogenic heat generated by ionising radiation (alpha-, beta- and gamma-ray) emitted from the elements of uranium (U), thorium (Th) and radioactive potassium (40K) in the zeolite samples.
2. Experimental
2.1. Sample collectionand preparation
Gördes zeolitic tuff located is in the north-east of Manisa province in the Western Anatolia of Turkey [7]. The continental Neogene sedimentary succession in the Gördes is 2000 m [7]. Zeolite mineral formation is observedin nearly 2/3 of the tuffs in Miocene piles.80% of these tuffs are comprised of heulandite and clinoptilolite [3].A representative number of zeolite samples were collected from each of the four zeolite quarries (ZO1, ZO2, ZO3, and
ZO4) operated in Gördes as shown in Figure 1.Samples were collected by random sampling method. The samples collected from eighty-one sampling locations were brought to the sample preparation laboratory and dried. The samples were dried at 110°C for five hours. The samples were then pulverised using a grinderto match the calibrated powder geometry in the EDXRF spectrometer. 5 grams of each sample were taken and homogenised with an agate mortar.
2.2. Measurement of pH and elemental concentrations
The following procedure was used for the pH measurement of each zeolite sample: 10 g of air-dried zeolite sample was placed into a 50-mL beaker. 25 mL of distilled water was added to the beaker and left for 24 hours. The pH was then measured using a pH metre (LaMotte 5 series).
Analyses of the major, minor and traceelements in the zeolite samples were carried out by using a benchtop ED-XRF spectrometer (Spectro Xepos). The EDXRF spectrometerwas equipped with a thick binary Pd/Coend-window tube(50 W, 60 kV) and a Peltier cooled Si drift detector (large detector area (30 mm2 and active area 20 mm2) [27]. The detector’s spectral resolution (FWHM) is small to 130 eV for Mn Kα.The spectrometerhas a HAPG polariser to improve the sensitivity to elements in the Na–Cl range and a bandpass filter to improve the performance for element detection in K–Mn range. The EDXRF spectrometer optimises the excitation using polarisation and secondary targets. It has an autosampler for up to 12 items and software modules. The target changer with up to eight polarisation and secondary targets offers many different excitation conditions, ensuring the optimal determination of all elements from K to U [27]. The EDXRF spectrometer employs sophisticated calibration techniques such as ‘standardless’ calibration, usually based on the Fundamental Parameters (FP) method. Soil certified reference material (NIST SRM 2709) was used for the quality assurance for the EDXRF system. The analysis procedures were completed by placing the sample cups prepared for each zeolite sample into the automatic sampler and counting them once for two hours. The overall uncertainty of the analytical procedure is between 4% and 15%.
2.3. Radiogenic heat generation
Heat generation and flow are the main characteristics of the Earth’s crust. Thereare two main sources of the internal heat of the earth: the first source is the cooling of the Earth and the second source is the long-lived [28]. The thermal structure and evolution of the continents depend largely on the amount and distribution of radioactive heat sources in the Earth’s crust [29]. The heat generated caused by radioactive decay in rocks is of main importance in understanding the Earth’s thermal history and interpreting the continental heat flux data. Therefore, radiogenic heat generation from natural radiation in the Earth’s crust is the main parameter that determines the thermal structure of the continental crust. Radiogenic decay of the radionuclides which are member of the natural radioactive series of uranium (238U with a half-life of 4.5 109 y), actinium (235U with a half-life of 0.71 109 y), and thorium (232Th with a half-life of 14.1 109 y) and potassium (40K with a half-life of 1.3 × 10⁹ y) provides the largest internal source of heat (more than 98% of present-day heat generation) [29]. 40K is a naturally occurring radioactive isotope of the common
element potassium (39K), which represents about 2.4% by weight of the Earth’s crust. It has an atomic percent abundance of 0.0117%.The kinetic energy of ionising radiations (α-, β-, γ and X-rays) was absorbed in rocks and soils and converted into heat. In general, the radiogenic heat generation rate (RHG in µWm−3) of any rock is estimated by the following formula [30]:
RHG ¼ 10 5�ρ � 9:52 � Cð Uþ2:56 � CThþ3:45 � CKÞ (2)
whereρis the bulk density of the zeolite (in kgm−3),C
U, CThand CKare the concentration of
uranium (in mgkg−1), thorium (in mgkg−1) and potassium (%) measured in the zeolite samples, respectively.
3. Results and discussion
3.1. Oxide contents of zeolite quarries
The pH values of Gördes clinoptilolite varied from 6.8 (slightly acid) to 8.0 (slightly alka-line), with an average of 7.4 (slightly alkaline). The average pH value of ZO1, ZO2, ZO3 and ZO4 quarry was measured as 7.4 (6.8–8.0), 7.6 (7.5–7.7), 7.5 (6.5–7.7) and 7.3 (7.0–7.7), respectively. Descriptive statistical information on the oxide content of Gördes zeoliteis given in Table 1.The comparison of the average oxide concentration of Gördes zeolite with those in the literature is given in Table 2.Descriptive statistical information on the oxides analysed in Gördes zeolite quarries is given in Table 3.As can be seen from Table 1, the oxides contained in the analysed zeolite samples are listed in order: SiO2 > Al2O3 > K2 O > CaO > Fe2O3 > MgO > Na2O > TiO2 > SrO > P2O5 > MnO.The concentrations of SO3 analysed only in the zeolite samples from the ZO1 quarry varied from 0.29 to 0.37% with an average of 0.34%.
The concentrations of SiO2analyzed in Gördes zeolite samples varied from 52.6 to 78.8% with an average of 75.1%. The average SiO2 level is approximately 40% higher than the Earth’s crust average of 53.5% [31]. The average concentration of SiO2 ZO3, ZO1, ZO2 and ZO4 was found as 77.7%, 76.9%, 74.8% and 73.0%, respectively.The average SiO2 level is consistent with the values measured for Gördes and Ukraine zeolite in the literature, but it is greater than the average SiO2 concentration of Bigadiç zeolite. The concentrations of Al2O3 analyzed in Gördes zeolite samples varied from 9.3 to 16.3% with an average of 14.1%. The
Table 1. Descriptive statistical data for major and minor oxides in the Gördes zeolite.
Oxide
The concentration of oxides (%)
Average SEa Median SDa Kurtosis Skewness Min Max N
Na2O 1.328 0.027 1.341 0.241 −0.553 −0.291 0.723 1.817 81 MgO 1.392 0.050 1.213 0.452 −0.593 0.753 0.581 2.361 81 Al2O3 14.119 0.163 14.570 1.465 0.446 −0.973 9.337 16.340 81 SiO2 75.064 0.564 77.410 5.073 3.951 −1.901 52.630 78.830 81 P2O5 0.036 0.002 0.029 0.015 −0.091 1.084 0.016 0.072 81 K2O 3.166 0.067 3.444 0.606 −0.631 −0.778 1.895 4.061 81 CaO 2.446 0.067 2.394 0.600 3.356 1.845 1.616 4.343 81 TiO2 0.090 0.002 0.092 0.015 −0.006 −0.326 0.054 0.121 81 MnO 0.032 0.001 0.029 0.009 −0.669 0.545 0.017 0.053 81 Fe2O3 1.687 0.034 1.656 0.302 −0.895 −0.186 1.095 2.195 81 SrO 0.039 0.002 0.032 0.022 2.919 1.998 0.017 0.106 81
average Al2O3 level is lower than the Earth’s crust average of 15.9% [31]. The average concentration of Al2O3in ZO1, ZO3, ZO2 and ZO4 was found as 15.6%, 14.1%, 13.9% and 13.8%, respectively. The average Al2O3 level is higher than those analysed in various zeolite samples in the literature.The concentrations of K2O analyzed in Gördes zeolite samples varied from 1.9 to 4.1% with an average of 3.2%. The average K2O level is approximately three times higher than the Earth’s crust average of 1.1% [31]. The average concentration of
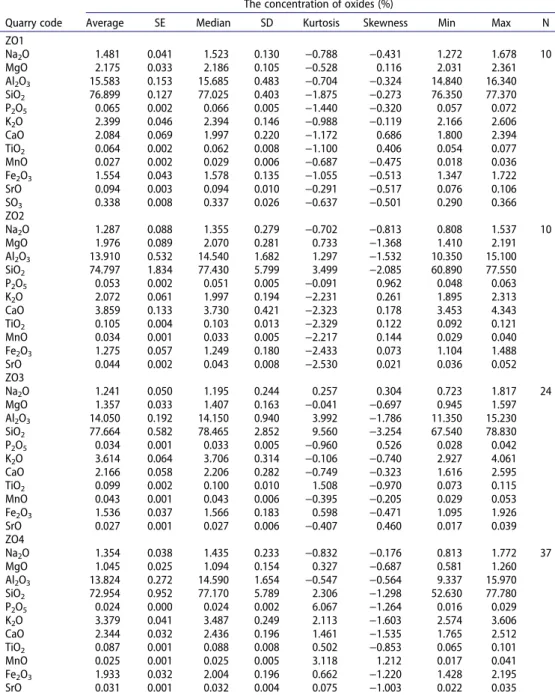
Table 2. Comparison of average oxide concentrations of Gördes zeolite with literature values.
Quarry code
The concentration of oxides (%)
Average SE Median SD Kurtosis Skewness Min Max N
ZO1 Na2O 1.481 0.041 1.523 0.130 −0.788 −0.431 1.272 1.678 10 MgO 2.175 0.033 2.186 0.105 −0.528 0.116 2.031 2.361 Al2O3 15.583 0.153 15.685 0.483 −0.704 −0.324 14.840 16.340 SiO2 76.899 0.127 77.025 0.403 −1.875 −0.273 76.350 77.370 P2O5 0.065 0.002 0.066 0.005 −1.440 −0.320 0.057 0.072 K2O 2.399 0.046 2.394 0.146 −0.988 −0.119 2.166 2.606 CaO 2.084 0.069 1.997 0.220 −1.172 0.686 1.800 2.394 TiO2 0.064 0.002 0.062 0.008 −1.100 0.406 0.054 0.077 MnO 0.027 0.002 0.029 0.006 −0.687 −0.475 0.018 0.036 Fe2O3 1.554 0.043 1.578 0.135 −1.055 −0.513 1.347 1.722 SrO 0.094 0.003 0.094 0.010 −0.291 −0.517 0.076 0.106 SO3 0.338 0.008 0.337 0.026 −0.637 −0.501 0.290 0.366 ZO2 Na2O 1.287 0.088 1.355 0.279 −0.702 −0.813 0.808 1.537 10 MgO 1.976 0.089 2.070 0.281 0.733 −1.368 1.410 2.191 Al2O3 13.910 0.532 14.540 1.682 1.297 −1.532 10.350 15.100 SiO2 74.797 1.834 77.430 5.799 3.499 −2.085 60.890 77.550 P2O5 0.053 0.002 0.051 0.005 −0.091 0.962 0.048 0.063 K2O 2.072 0.061 1.997 0.194 −2.231 0.261 1.895 2.313 CaO 3.859 0.133 3.730 0.421 −2.323 0.178 3.453 4.343 TiO2 0.105 0.004 0.103 0.013 −2.329 0.122 0.092 0.121 MnO 0.034 0.001 0.033 0.005 −2.217 0.144 0.029 0.040 Fe2O3 1.275 0.057 1.249 0.180 −2.433 0.073 1.104 1.488 SrO 0.044 0.002 0.043 0.008 −2.530 0.021 0.036 0.052 ZO3 Na2O 1.241 0.050 1.195 0.244 0.257 0.304 0.723 1.817 24 MgO 1.357 0.033 1.407 0.163 −0.041 −0.697 0.945 1.597 Al2O3 14.050 0.192 14.150 0.940 3.992 −1.786 11.350 15.230 SiO2 77.664 0.582 78.465 2.852 9.560 −3.254 67.540 78.830 P2O5 0.034 0.001 0.033 0.005 −0.960 0.526 0.028 0.042 K2O 3.614 0.064 3.706 0.314 −0.106 −0.740 2.927 4.061 CaO 2.166 0.058 2.206 0.282 −0.749 −0.323 1.616 2.595 TiO2 0.099 0.002 0.100 0.010 1.508 −0.970 0.073 0.115 MnO 0.043 0.001 0.043 0.006 −0.395 −0.205 0.029 0.053 Fe2O3 1.536 0.037 1.566 0.183 0.598 −0.471 1.095 1.926 SrO 0.027 0.001 0.027 0.006 −0.407 0.460 0.017 0.039 ZO4 Na2O 1.354 0.038 1.435 0.233 −0.832 −0.176 0.813 1.772 37 MgO 1.045 0.025 1.094 0.154 0.327 −0.687 0.581 1.260 Al2O3 13.824 0.272 14.590 1.654 −0.547 −0.564 9.337 15.970 SiO2 72.954 0.952 77.170 5.789 2.306 −1.298 52.630 77.780 P2O5 0.024 0.000 0.024 0.002 6.067 −1.264 0.016 0.029 K2O 3.379 0.041 3.487 0.249 2.113 −1.603 2.574 3.606 CaO 2.344 0.032 2.436 0.196 1.461 −1.535 1.765 2.512 TiO2 0.087 0.001 0.088 0.008 0.502 −0.853 0.065 0.101 MnO 0.025 0.001 0.025 0.005 3.118 1.212 0.017 0.041 Fe2O3 1.933 0.032 2.004 0.196 0.662 −1.220 1.428 2.195 SrO 0.031 0.001 0.032 0.004 0.075 −1.003 0.022 0.035
K2O in ZO3, ZO4, ZO1 and ZO2 was found as 3.6%, 3.4%, 2.4% and 2.1%, respectively. The average K2O level is consistent with the average K2O concentrations measured for Gördes, Bigadiç and Ukrainian zeolites in the literature.The concentrations of CaO analysed in Gördes zeolite samples varied from 1.6 to 4.3% with an average of 2.4%. The average CaO level is approximately four times lower than the Earth’s crust average of 9.4% [31]. The average concentration of CaO in ZO2, ZO4, ZO3 and ZO1 was found as 3.9%, 2.3%, 2.2% and 2.1%, respectively. The average CaO level is consistent with the average CaO concentrations measured for Gördes, Bigadiç and Ukrainian zeolites in the literature.The concentrations of Fe2O3analyzed in Gördes zeolite samples varied from 1.1 to 2.2% with an average of 1.7%. The average Fe2O3 level is approximately 50% higher than the Earth’s crust average of 1.1% [31]. The average concentration of Fe2O3 in ZO4, ZO1, ZO3 and ZO2 was found as 1.9%, 1.6%, 1.5% and 1.3%, respectively.The average Fe2O3 level is consistent with the values measured for Gördes and Ukraine zeolite in the literature, but it is greater than the average Fe2O3 concentration of Bigadiç zeolite. The concentrations of MgO analysed in Gördes
Table 3. Descriptive statistical data for major and minor oxides in the Gördes zeolitequarries.
Oxide concentration (%) Zeolite
type Region Na2O MgO
Al2 O3 SiO2 K2O CaO Fe2 O3 TiO2 MnO P2 O5 SO3 Reference
CLI Turkey, Bigadiç
(Balıkesir)
0.17 1.19 11 67.22 1.51 3.32 0.8 0.07 - - - [34]
CLI Turkey, Bigadiç
(Balıkesir)
0.25 0.83 11.8 71.5 4.6 2.65 0.88 0.1 - - - [23]
CLI Turkey, Gördes
(Manisa)
0.6 0.7 11.8 73.21 2.73 2.96 0.93 0.1 - - - [23]
CLI Ukraine 2.6 0.4 13.23 73.9 3.72 2.68 2.07 - - - - [35]
CLI Turkey, Gördes
(Manisa)
0.28 0.83 12.4 70.9 4.46 2.54 1.21 0.089 - 0.02 - [36]
CLI+HEU Turkey, Gördes (Manisa)
0.63 0.82 10.49 73.11 1.15 1.61 1.41 - - - - [24]
CLI+HEU 0.46 0.88 9.92 72.97 2.62 1.59 1.76 - - -
-CLI+HEU 0.22 0.69 8.78 74.26 1.9 2.62 0.92 - - -
-CHA 0.66 0.11 9.3 77.42 3.66 0.48 0.96 - - -
-CLI Turkey, Gördes
(Manisa)
0.92 0.42 12.06 71.98 4.28 1.99 0.45 - - 0.03 0.02 [37]
CLI Turkey, Gördes
(Manisa)
0.4 0.8 11.5 74.5 2.7 3.2 1.5 - - - - [25]
CLI Turkey, Bigadiç
(Balıkesir)
0.43 1.25 11.68 71.83 3.7 3.39 1.15 0.07 0.03 - - [38]
CLI Turkey, Gördes
(Manisa)
0.66 0.76 11.54 67.57 4.27 2.17 1.34 - - - - [39]
CLI Turkey, Gördes
(Manisa)
0.18 0.71 11.32 75.84 3.76 2.12 0.93 0.08 0.01 - - [40]
CLI Turkey, Gördes
(Manisa)
0.52 1.13 13.11 69.31 2.83 2.07 - - - - 0.1 [41]
CLI Turkey, Bigadiç
(Balıkesir)
0.18 1.01 9.99 64.99 1.95 3.51 - - - [42]
CLI Turkey, Gördes
(Manisa)
0.69 1.58 13.61 72.09 3.49 2.64 1.91 0.102 0.07 0.06 0.3 [26]
CLI Turkey, Gördes
(Manisa) ZO1 1.48 2.17 15.58 76.9 2.4 2.08 1.55 0.06 0.03 0.07 0.34 This study Turkey, Gördes (Manisa) ZO2 1.29 1.98 13.91 74.8 2.07 3.86 1.28 0.11 0.03 0.05 -Turkey, Gördes (Manisa) ZO3 1.24 1.36 14.05 77.66 3.61 2.17 1.54 0.1 0.04 0.03 -Turkey, Gördes (Manisa) ZO4 1.35 1.04 13.82 72.95 3.38 2.34 1.93 0.09 0.03 0.02
-zeolite samples varied from 0.6 to 2.4% with an average of 1.4%. The average MgO level is approximately four times lower than the Earth’s crust average of 5.4% [31]. The average concentration of MgO in ZO1, ZO2, ZO3 and ZO4 was found as 2.2%, 2.0%, 1.4% and 1.0%, respectively. The average MgO level is above the average MgO measured for Gördes, Bigadiç and Ukraine zeolite in the literature.The concentrations of Na2O analysed in Gördes zeolite samples varied from 0.7 to 1.8% with an average of 1.3%. The average Na2 O level is approximately two times lower than the Earth’s crust average of 2.7% [31]. The average concentration of Na2O in ZO1, ZO4, ZO2 and ZO3 was found as 1.5%, 1.4%, 1.3% and 1.2%, respectively. The average Na2O level is above the average Na2O measured for Gördes, Bigadiç and Ukraine zeolite in the literature.The concentrations of TiO2 analysed in Gördes zeolite samples varied from 0.05 to 0.12% with an average of 0.09%. The average TiO2 level is approximately eleven times lower than the Earth’s crust average of 0.97% [31]. The average concentration of TiO2inZO2, ZO3, ZO4 and ZO1 was found as 0.11%, 0.10%, 0.09% and 0.06%, respectively. The average TiO2 level is consistent with the average TiO2 concentrations analyzed for Gördes, Bigadiç and Ukrainian zeolites in the literature. The concentrations of SrO analyzed in Gördes zeolite samples varied from 0.02 to 0.11% with an average of 0.04%. The average concentration of SrOin ZO1, ZO2, ZO4 and ZO3 was found as 0.09%, 0.04%, 0.03% and 0.03%, respectively. Theconcentrations of MnO analyzed in Gördes zeolite samples varied from 0.02 to 0.05% with an average of 0.03%. The average MnO level is approximately fivetimes lower than the Earth’s crust average of 0.16% [31]. The average concentration of MnO inZO3, ZO2, ZO1 and ZO4 was found as 0.043%, 0.034%, 0.027% and 0.025%. The average MnO level is consistent with the average MnOconcentrations analysed for Gördes zeolites in the literature.The concentrations of P2O5analyzed in Gördes zeolite samples varied from 0.02 to 0.07% with an average of 0.04%.The average P2O5 level is approximately five times lower than the Earth’s crust average of 0.19% [31]. The average concentration of P2O5in ZO1, ZO2, ZO3 and ZO4 was found as 0.07%, 0.05%, 0.03% and 0.02%, respectively. The average P2O5 level is consistent with the average P2O5 concentra-tions analyzed in Gördes zeolites in the literature.
3.2. SiO2/Al2O3 ratios of zeolite quarries
The type of zeolites formed is a function of temperature, pressure, the concentration of reactive solutions, pH, activation and ageing process, and SiO2 and A12O3 content. Depending on the SiO2/Al2O3 ratio, the zeolites can be divided or graded into three classes: low silica zeolites(Si/Al≤ 2), medium silica zeolites(2 < Si/Al≤ 5) and high
Table 4. Classification of Gördes zeolite quarries according to SiO2/Al2O3
ratio.
Quarry code
SiO2/Al2O3 ratio
Range (min-max) Average Class or degree
ZO1 4.7–5.2 4.9 Medium silica
ZO2 5.1–5.9 5.4 High silica
ZO3 5.2–6.0 5.5 High silica
silica zeolites(Si/Al> 5) [32].In general, for zeolites, an increase in this parameter-causes a significant increasein parameters such as acid resistance, thermal stability, etc [33]. The SiO2/Al2O3ratios of the Gördes zeolite quarries are given in Table 4. The average SiO2/Al2O3 ratio of the ZO1, ZO2, ZO3 and ZO4 coded quarries were calculated as 4.9, 5.4, 5.5 and 5.3, respectively. According to these average values, it is seen that the ZO1 quarry is of medium silica grade and ZO2, ZO3 and ZO4 quarry is of high silica grade zeolite class.
3.3. Trace element contents of zeolite quarries
The concentrations of trace elements analysed in the Gördes zeolite quarries are given in Table 1.As can be seen in Table 4.1, the significant eco-toxic metals,which are primary toxic to human and environmental health, analysed in the Gördes zeolite samples are listed as Zr> Zn > Pb > As > Ni > Co > Cr> Cu> Cd according to their average concentration.The concentrations of Zranalyzed in the Gördes zeolite samples varied from 43.1 to 122.5 mgkg−1 with an average of 87.8 mgkg−1. The average Zr level is approximatelytwo times smaller than the Earth’s crust average of 170 mgkg−1 [31]. The averageZr concentration in ZO4, ZO1, ZO3 and ZO2 wasfound as 103.1, 81.3, 75.1 and 68.6 mgkg−1, respectively.The
Table 5. The concentration of trace elements analysed in the Gördes zeolitequarries.
Group Element
The concentration of trace element in Gördes zeolite quarries (mgkg−1)
ZO1 ZO2 ZO3 ZO4
Ave Min Max Ave Min Max Ave Min Max Ave Min Max
Toxic metal Cr 4.2 1.9 5.9 12.7 8.3 15.1 10.4 6.1 13.8 4.6 1.5 6.6 Co 8.7 7.2 10.6 11.8 7.4 15.3 9.5 6.0 17.2 7.5 6.4 11.5 Ni 9.2 8.0 10.4 12.9 10.7 14.5 11.2 8.5 13.1 8.4 6.2 12.9 Cu 3.7 2.6 4.7 4.8 2.6 6.7 4.9 3.2 6.6 3.9 2.1 6.9 Zn 35.5 29.5 40.4 31.7 25.6 36.6 43.1 31.1 56.5 75.2 37.2 140.3 As 126.0 103.4 148.5 13.1 11.1 15.7 21.2 14.1 31.0 2.9 0.8 5.2 Zr 81.3 62.2 90.0 68.6 53.3 79.8 75.1 43.1 100.0 103.1 77.8 122.5 Cd 1.9 1.2 2.9 3.3 2.0 4.6 2.3 1.4 4.5 1.6 1.2 1.7 Pb 49.1 41.0 54.6 28.8 22.8 33.6 47.2 33.6 58.3 52.9 33.7 78.6 Transition metal V 4.3 1.3 7.7 12.2 7.8 16.0 7.2 0.5 14.6 1.5 0.5 4.7 Nb 12.4 9.7 13.5 11.3 8.5 14.2 11.5 8.3 13.9 12.9 9.0 14.3 Ag 3.3 1.0 6.7 7.8 7.0 8.8 4.7 1.0 9.7 2.1 1.0 5.8 Hf 5.4 3.4 7.3 5.9 3.8 7.8 4.9 2.6 7.9 5.4 3.0 7.3 Ta 28.0 20.9 32.5 26.4 17.3 31.8 23.4 13.7 31.9 27.9 18.5 33.3 W 3.1 2.3 3.9 2.2 1.4 3.1 2.8 1.4 4.6 1.5 0.5 3.1 Radiotoxic actinide Th 30.4 26.1 33.5 27.9 22.7 31.9 29.7 21.7 37.1 30.9 23.6 35.9 U 9.5 8.0 10.7 6.4 5.5 7.5 6.3 4.9 8.3 4.9 3.3 6.3 Rare earth element Y 21.6 19.0 23.5 21.4 18.2 24.0 17.9 14.5 21.7 10.9 9.2 14.8 La 58.8 1.9 146.9 13.9 1.9 74.2 19.0 1.9 83.4 25.6 1.9 109.5 Ce 33.5 1.7 146.0 15.9 1.7 95.4 21.9 1.7 132.1 19.6 1.7 108.0 Pr 15.4 1.3 136.0 7.4 1.9 19.9 8.2 2.0 23.9 7.4 2.0 23.2 Nd 66.4 57.7 89.9 71.9 59.2 83.9 68.0 46.2 78.6 59.8 46.0 76.8 Alkali metal Rb 199.6 164.3 216.1 101.4 81.8 116.5 155.7 108.0 182.2 181.7 133.7 196.8 Cs 259.8 200.5 294.3 27.2 4.0 64.9 47.1 4.0 70.6 70.7 4.0 109.0 Alkaline earth metal Ba 1160.8 877.7 1452.0 345.4 258.5 421.8 148.5 45.6 228.4 206.8 161.3 253.0 Sb 6.4 3.0 11.0 7.3 2.1 11.4 4.1 2.1 8.0 2.6 0.2 9.3 Ga 16.3 12.9 18.7 14.4 10.9 17.3 15.9 11.9 19.6 15.6 11.2 17.8 Te 8.0 2.0 14.6 12.4 8.7 16.6 5.6 2.0 10.5 2.3 0.2 13.4 Halogen I 3.2 2.3 8.0 7.0 3.1 10.4 4.7 1.9 10.2 3.4 2.0 8.8 Post-transition metal Sn 4.3 1.2 7.3 7.9 5.6 11.1 4.4 0.4 9.7 2.1 0.2 9.1
concentrations of Znanalyzed in the Gördes zeolite samples varied from 25.6 to140.3 mgkg−1 with an average of 55.5 mgkg−1. The average Zn level is approximately1.5 times smaller than the Earth’s crust average of 83 mgkg−1 [31]. The average Zn concentration inZO4, ZO3, ZO1 and ZO2 wasfound as 75.2, 43.1, 35.5 and 31.7 mgkg−1, respectively.The concentrations of Pbanalyzed in the Gördes zeolite samples varied from 22.8 to 78.6 mgkg−1 with an average of 47.8 mgkg−1. The average Pb level is approximately three times higher than the Earth’s crust average of 16 mgkg−1 [31]. The averagePb concentration inZO4, ZO1, ZO3 and ZO2 wasfoundas 52.9, 49.1, 47.2 and 28.8mgkg−1, respectively.The concentrations of Asanalyzed in the Gördes zeolite samples varied from 0.8 to 148.5 mgkg−1 with an average of 24.8 mgkg−1. The average As level is approximately fifteen times higher than the Earth’s crust average of 1.7 mgkg−1 [31]. The averageAsconcentration inZO1, ZO3, ZO2 and ZO4 wasfound as 126.0, 21.2, 13.1 and 2.9mgkg−1, respectively.The concentrations of Nianalyzed in the Gördes zeolite samples varied from 6.2 to 14.5 mgkg−1 with an average of 9.9 mgkg−1. The average Ni level is approximately six times lower than the Earth’s crust average of 58 mgkg−1 [31]. The averageNi concentration inZO2, ZO3, ZO1 and ZO4 was-found as 12.9, 11.2, 9.2 and 8.4mgkg−1, respectively.The concentrations of Coanalyzed in the Gördes zeolite samples varied from 6.0 to 17.2mgkg−1 with an average of 8.8 mgkg−1. The average Co level is approximately twotimes lower than the Earth’s crust average of 18 mgkg−1 [31]. The averageCo concentration inZO2, ZO3, ZO1 and ZO4 wasfound as 11.8, 9.5, 8.7 and 7.5 mgkg−1, respectively.The concentrations of Cranalyzed in the Gördes zeolite samples varied from 1.5 to 15.1mgkg−1 with an average of 7.3 mgkg−1. The average Cr level is approximately eleventimes lower than the Earth’s crust average of 83 mgkg−1 [31]. The averageCr concentration inZO2, ZO3, ZO4 and ZO1 wasfound as 12.7, 10.4, 4.6 and 4.2 mgkg−1,respectively.The concentrations of Cuanalyzed in the Gördes zeolite samples varied from 2.1 to 6.9mgkg−1 with an average of 4.3 mgkg−1. The average Cu level is approximately eleventimes lower than the Earth’s crust average of 47 mgkg−1 [31]. The averageCu concentration inZO3, ZO2, ZO4 and ZO1 wasfound as 4.9, 4.8, 3.9 and 3.7 mgkg−1 ,respec-tively.The concentrations of Cdanalyzed in the Gördes zeolite samples varied from 1.2 to 4.6mgkg−1 with an average of 2.1 mgkg−1. The average Cd level is approximately sixteen-times higher than the Earth’scrust average of 0.13 mgkg−1 [31]. The averageCd concentra-tion inZO2, ZO3, ZO1 and ZO4 wasfound as 3.3, 2.3, 1.9 and 1.6 mgkg−1,respectively.
The concentrations of Thanalyzed in the Gördes zeolite samples varied from 21.7 to 37.1 mgkg−1 with an average of 30.1 mgkg−1. The average Th level is approximately twotimes higher than the Earth’s crust average of 13 mgkg−1 [31]. The averageTh concentration inZO4, ZO1, ZO3 and ZO2 wasfoundas30.9, 30.4, 29.7 and 27.9 mgkg−1, respectively.The concentrations of Uanalyzed in the Gördes zeolite samples varied from 3.3 to 10.7mgkg−1 with an average of 6.0 mgkg−1. The average U level is approximately twotimeshigher than the Earth’s crust average of 2.5 mgkg−1 [31]. The averageU concen-tration inZO1, ZO2, ZO3 and ZO4 wasfound as 9.5, 6.4, 6.3 and 4.9 mgkg−1,respectively.
3.4. Radiogenic heat generation from zeolite samples
Radiogenic heat generation (RHG) caused by the Gördes zeolite samples varied from 2.3to 4.1 µWm−3 with an average of 3 µWm−3. The averageRHG values for ZO1, ZO3, ZO2 and ZO4quarry were estimated as 3.7 (3.2–4.1)µWm−3, 3.19 (2.4–3.9)µWm−3, 2 (2.5–3.3) µWm−3 and 2.8 (2.3–3.3) µWm−3,respectively.
4. Conclusions
This study is the first detailed study in which twelve oxides (Na2O, MgO, Al2O3, SiO2, P2O5, K2O, CaO, TiO2, MnO, Fe2O3, SrO and SO3) and 30trace elements (Cr, Co, Ni, Cu, Zn, As, Zr, Cd, Pb, Th, U, V, Nb, Ag, Hf, Ta, W, Y, La, Ce, Pr, Nd, Ba, Sb, Ga, Te, Rb, Cs, I and Sn)contained in eighty-one zeolite samples collected from commercially operated zeolite quarries in Gördes were analysed by the EDXRF spectrometric method.As a result, it was found that Gördes zeolite contained high levels of toxic arsenic, cadmium and lead, and radiotoxic thorium and uranium, which are harmful for human and environmental health.Erionite, a zeolite type is known to cause mesothelioma disease which is a dangerous and rare form of lung cancer such as asbestos, especially in the Nevşehir (Turkey) region. Also, as mentioned above, Gördes zeolites include toxic metals and radiotoxic elements. In this context, the following points are recommended:
(1) to check whether these measures have been taken in these quarries, as it is of vital importance for workers working in the health and safety of workers for both the extrac-tion of the zeolite mineral and for workers working in the crushing and screening phase and (2) zeolites from zeolite quarries containing lower toxic heavy metal and radiotoxic elements should be used for feed additive, water treatment, soil amendmentin agriculture and building raw materials in construction industry in Turkey.
Acknowledgments
This study is carried out within the framework of a master thesis conducted at Kastamonu University and supported by The Scientific Research Projects Coordinator of Kastamonu University (Research Project codded of KÜ-HIZDES/2019-51).
Disclosure statement
No potential conflict of interest was reported by the authors.
References
[1] S.M. Al-Jubouri, B.I. Waisi and S.M. Holmes, J. Eng, Sci. Technol. 13, 4066 (2018) [2] S.M. Al-Jubouri, H. Adil, H.A. Lafta and B.I. Waisi, Desalin. Water Treat. 165, 290 (2019). [3] Ö. Bilgin and J. Mine, Mater.Char. Eng. 5, 252 (2017).
[4] Ö. Yiğit and O. Geol, Rev 46, 118 (2012).
[5] K. Margeta, N.Z. Logar, M. Šiljeg and A. Farkaš,in INTECH, (2013), Chap. 5, pp. 81. http://dx.doi. org/10.5772/50738
[6] B. Jha and D.N. Singh, J. Mater.Educ. 33, 65 (2011).
[7] S. Özen, Doctoral Thesis, Middle East Technical Unıversity the Graduate School of Natural and Applied Scıences, 2013.
[8] S. Anaç and N. Tamzok, Proceedings Book of 21st World Mining Congress, Krakow, Poland, 2008.
[9] State Planning Organization, DPT: 2739 – ÖİK, 690, 2007.
[10] State Planning Organization, Working Group Report, DPT: 2619– ÖİK, 630, 2001.
[11] G.J. Millar, S.J. Couperthwaite and K. Alyuz, Int. J. Chem. Environ. Eng. 4, 1918 (2016). doi:10.1016/j.jece.2016.03.014.
[12] S.A.A. Nakhli, M. Delkash, B.E. Bakhshayesh and H. Kazemian, Water Air Soil Pollut. 228 (464), 1 (2017).
[13] X.H. Fang, F. Fang, C.H. Lu and L. Zheng, Nucl.Eng. Technol. 49, 556 (2017). doi:10.1016/j. net.2016.11.008.
[14] J. Wen, H. Dong and G. Zeng, J. Clean. Prod. 197, 1435 (2018). doi:10.1016/j. jclepro.2018.06.270.
[15] C. Li, M. Moliner and A. Corma, Chem. Int. Ed. 57, 15330 (2018). doi:10.1002/anie.201711422. [16] J. Prech, Catal.Rev. Sci. Eng. 60, 71 (2018). doi:10.1080/01614940.2017.1389111.
[17] M. Yoldi, E.G. Fuentes-Ordoñez, S.A. Korili and A. Gil, Micropor.Mesopor. Mat. 287, 183 (2019). doi:10.1016/j.micromeso.2019.06.009.
[18] A. Kalaitzis, S. Stoulos, V. Melfos, N. Kantiranis and A. Filippidis, J. Radioanal. Nucl.Chem. 319, 975 (2019). doi:10.1007/s10967-019-06427-7.
[19] F. Gezer, Ş. Turhan, A. Kurnaz and Y. Ufuktepe, Appl. Radiat. Isot. 152, 57 (2019). doi:10.1016/j. apradiso.2019.06.036.
[20] N. Jiang, R. Shang, S.G.J. Heijman and L.C. Rietveld, Sep.Purif.Technol. 235, 1 (2020). doi:10.1016/j.seppur.2019.116152.
[21] F. Collins, A. Rozhkovskaya, J.G. Outram and G.J. Miller, Micropor.Mesopor. Mat. 291, 1 (2020). doi:10.1016/j.micromeso.2019.109667.
[22] O.R. Diaz and E.F.H. Peraza, J. Radioanal. Nucl.Chem. 221, 255 (1997). doi:10.1007/ BF02035282.
[23] G. Ulusoy and M. Albayrak, Bull. Min. Res. Explor. 139, 61 (2009).
[24] Ö. Bilgin, PhD Thesis, DokuzEylül University Institute of Science and Technology, 2009 (in Turkish).
[25] M. Albayrak, Kibited. 1, 273 (2010) (in Turkish).
[26] M. Kurudirek, Y. Özdemir, İ. Türkmen and A. Levet, Radiat.Phys. Chem. 79, 1120 (2010). [27] Ş. Turhan, E. Gören, A.M.K. Garad, A. Altıkulaç, A. Kurnaz, C. Duran, A. Hançerlioğulları,
A. Altunal, V. Güçkan and A. Özdemir, Radiochimica.Acta 106, 611 (2018). doi:10.1515/ract- 2017-2863.
[28] E.O. Joshua and O.O. Alab, J. Earth Sci. Geotech. Engin. 2, 25 (2012). [29] A. Bubu and C.P. Ononugbo, J. Sci. Res. Reports 17, 1 (2017).
[30] C. Clauser, in Encyclopedia of Solid Earth Gophysics, 2nd. Harsh Gupta edited by (Springer, Dordrecht, preprint, 2011), p. 1.
[31] A.A. Yaroshevsky, Geochem.International 44, 48 (2006). doi:10.1134/S001670290601006X. [32] S.M. Al-Jubouri, Micropor.Mesopor.Mater. 303, 1 (2020). doi:10.1016/j.micromeso.2020.110296. [33] M.W. Munthali, M.A. Elsheikh, E. Johan and N. Matsue, Molecules 19, 20468 (2014).
doi:10.3390/molecules191220468.
[34] B. Yıldız, H.N. Erten and M. Kış, J. Radioanal. Nucl.Chem. 288, 475 (2011). doi:10.1007/s10967- 011-0990-5.
[35] A.S. Shadrikov and A.D. Petukhov, National Technical University of Ukraine Kyiv Polytechnic Institute. 2014.
[36] H. Demir and E. Polat, Hasad. 221, 54 (2003) (in Turkish).
[37] T. Ünaldı and B. Yıldırım, AnadoluÜniversitesiBilimveTeknolojiDergisi. 10, 485 (2009) (in Turkish).
[38] N. Moralı, Master of Thesis, Middle East Technical University, The Graduate School of Natural and Applied Sciences, (2006).
[39] İ. Mızrak and K. Klinoptilolitinin, (Gördes) Ağır Metal Formlarınınİncelenmesi. Yüksek LisansTezi, Eskişehir OsmangaziÜniversitesi Fen BilimleriEnstitüsü. Eskişehir, 2010. (in Turkish). [40] A. Keskin, Manisa-Gördes yöresi klinoptilolitinin benzinlimotorlardakatalizörolarakkullanı
mıüzerinebiraraştırma,DoktoraTezi, Sakarya Üniversitesi Fen BilimleriEnstitüsü. Sakarya, 2005. [41] E. Erdem, N. Karapınar and R. Donat, J. Colloid Interf.Sci. 280, 309 (2004). doi:10.1016/j.
jcis.2004.08.028.