A Turn-on Fluorescent Sensor For Cadmium Ion Detection In Aqueous
Solutions
Ziya Aydin*
*Vocational School of Technical Sciences, Karamanoglu Mehmetbey University, 70200 Karaman, Turkey.
Abstract: Fluorescent sensors have attracted an important interest due to their advantages such as high selectivity, rapid response, easy use, etc. In this study, a rhodamine based fluorescent sensor, RhDP, was synthesized, and used for selective detection of Cd2+ ions. The sensor responds to Cd2+ via the
coordination induced fluorescence activation (CIFA) mechanism. RhDP gives a very fast and reversible fluorescence response to Cd2+ in the presence of the metal ions tested. The complex stoichiometry
between RhDP and Cd2+ was found to be 1:1 and the binding constant was calculated as 2.70 × 10⁷ M-1 in
acetonitrile (ACN)/HEPES buffer (10 mM, pH: 7.05, v/v 1:1). The fluorescent detection limit of RhDP for Cd2+ was found to be 0.218 µM, which gave a marked sensitivity towards Cd2+.
Keywords: Fluorescence, Sensor, Cadmium, Rhodamine B, Turn-on. Submitted: October 28, 2019. Accepted: December 27, 2019.
Cite this: Aydın Z. A Turn-on Fluorescent Sensor For Cadmium Ion Detection In Aqueous Solutions. JOTCSA. 2020;7(1):277–86.
DOI: https://doi.org/10.18596/jotcsa. 638912.
*Corresponding author. [email protected]; [email protected]. INTRODUCTION
Cadmium, which is one of the highly toxic heavy metals, is widely distributed in soil, water and crops, generated from volcanic eruption, the combustion of fossil fuels, Ni-Cd rechargeable batteries, fertilizers, paint pigments, etc., causing serious problems for human health (1-3). Cadmium ion (Cd2+) shows high affinity to sulfur,
and it can interfere with metal ions such as Ca2+
and Zn2+ to replace in the binding sites of some
enzymes (4, 5). It causes dysfunction of these enzymes, causing serious damage to the organs. Cadmium and cadmium compounds are category I carcinogens (6), and are known to be associated with cancer mortality, hepatic and renal damage, and cardiovascular disease (7-9). Thus, it is an essential point to develop detection methods for cadmium.
Several methods have been reported to detect Cd2+; however, these methods are generally
expensive and have complicated sample pre-treatment procedures and sophisticated synthetic procedure (10-13). As an alternative method, fluorescence spectroscopy requires easier procedures. In recent years, considerable effort has been dedicated towards the design and preparation of various colorimetric and fluorescent sensors for the detection of Cd2+ ions; however,
they respond to Cd2+ by fluorescence quenching
(14-16). Some organic molecules can also be used as turn-on fluorescent sensor for Cd2+ (17-19);
however, many of them have some technical drawbacks. For example, some Cd2+-selective
sensors also give response to Zn2+ ions because
they are in the same group of the periodic table and have similar properties (20, 21). Some Cd2+
sensors have a poor detection limit (22) and complicated synthetic routes (23, 24). Thus, better turn-on fluorescent sensors should be developed for Cd2+ ions. Rhodamine-based sensors are
believed to be the ideal platforms for turn-on fluorescent tools because of its excellent
photophysical properties (25). Since the report of Czarnik’s Cu2+-sensor (26), various
rhodamine-based turn-on fluorescent sensors have been reported for Hg2+ (27), Fe3+ (28), Cr3+ (29), Cu2+
(30), and Pd2+ (31). So far, a few
rhodamine-based turn-on fluorescent sensors have been reported for Cd2+ (32-36). However, some of these
sensors also have some technical drawbacks such as interference with other metal ions (36) and sensing to hydrogen ions (33). In this paper, a simple and reliable turn-on rhodamine based fluorescent sensor RhDP for Cd2+ has been
introduced. The sensor exhibited good selectivity and sensitivity for Cd2+. The sensor gives response
to Cd2+ very fast (<1 minute) and is stable even
under pH 5. EXPERIMENTAL
Materials and general methods
Rhodamine B base, 2,6-diacetylpyridine and dimethyl aspartate were purchased from TCI America. The solvents and the other chemicals used in the experiments were obtained commercially. The solution of Fe2+ and Fe3+ were
prepared by dissolving in 0.1 M HCl. Unless otherwise stated, the stock solutions of the metal ions tested were prepared from chloride salts or nitrate salts of them in deionized water. A stock solution of RhDP (500 µM) was prepared in ACN and diluted to 20 µM with ACN/HEPES buffer (10 mM, pH: 7.05, v/v 1:1).
An NMR spectrometer (Bruker DRX-300) was used to record 1H and 13C NMR spectra. A Perkin Elmer
API 150EX mass spectrometer was used to perform ESI-MS analyses. A Perkin Elmer Lambda 25 spectrophotometer at 293 K was used to record UV-Vis spectra. Fluorescent intensities were collected with a Perkin-Elmer LS55 luminescence spectrometer at 293 K.
Synthesis of RhDP
Rhodamine B hydrazine was synthesized using the published method (37). Before RhDP was synthesized, the intermediate product (1) was prepared and the synthesis of 1 was explained below.
Synthesis of 1 : Rhodamine B hydrazine (1 mmol, 0.556 g) and 2,6-diacetylpyridine (1 mmol, 0.162 g) were dissolved and mixed in boiling ethanol. The mixture was then refluxed for 5 hours. The solution was then cooled and allowed to stand at room temperature. After the solvent was evaporated under reduced pressure, the crude product was obtained. The crude product was then purified by silica gel column chromatography using CH3OH/CH2Cl2 (1:20, v/v) as eluent to obtain 0.405
g of 1 (yield, 56%). 1H NMR (CDCl 3, 300 MHz δ(ppm): 8.72 (d, 1 H), 8.08 (d, 1 H), 7.78–7.67 (m, 2 H), 7.62–7.53 (m, 2H), 7.23 (d, 1 H), 6.54– 6.46 (m, 4H), 6.21 (d, 2 H), 3.63 (m, 8 H), 2.70 (s, 3H), 1.91 (s, 3H), 1.21 (t, 12H); 13C NMR (CDCl3, 75 MHz δ(ppm): 168.8, 154.3, 153.3, 152.6, 150.1, 148.3, 147.8, 145.7, 137.7, 133.8, 129.6, 128.1, 127.4, 124.5, 123.2, 119.9, 118.9, 108.1, 107.097.7, 66.5, 51.7, 44.3, 21.7, 12.7; ESI-MS: found: m/z = 602.1 [M+H]+, calcd for
C37H39 N5O3 = 601.2.
Synthesis of RhDP : 1 (0.670 mmol, 0.405 g) and dimethyl aspartate (0.670 mmol, 0,076 g) were dissolved in ethanol (15 mL). The mixture was then refluxed overnight. The solvent was evaporated under vacuum and the crude product was purified by alumina gel column using CH2Cl2 to
CH2Cl2/MeOH as eluent to afford RhDP as a yellow
solid (0.115 g, yield, 23%). 1H NMR (CDCl 3, 300 MHz δ(ppm): 8.82 (d, 1 H), 8.14 (d, 1 H), 7.78– 7.67 (m, 2 H), 7.62–7.53 (m, 2H), 7.23 (d, 1 H), 6.54–6.46 (m, 4H), 6.21 (d, 2 H), 3.82 (s, 6H) 3.63 (m, 8 H),3.01 (m, 1H), 2.70 (s, 3H), 2.58 (d, 2H) 1.91 (s, 3H), 1.21 (t, 12H); 13C NMR (CDCl 3, 75 MHz δ(ppm): 158.8, 154.3, 153.3, 152.6, 150.1, 148.3, 147.8, 145.7, 137.7, 133.8, 129.6, 128.1, 127.4, 124.5, 123.2, 119.9, 118.9, 108.1, 107.097.7, 66.5, 54.6, 51.7, 44.3, 41.6, 36.1, 21.7, 12.7; ESI-MS: found: m/z = 745.2 [M+H]+, calcd for C43H48 N6O8 = 744.3. Binding studies
The binding constant between RhDP and Cd2+ was
determined with the absorption values at 557 nm using the method explained below.
S +M ⇔ SM
Where S = sensor, M= Cd2+ and SM = RhDP+Cd2+
The complex apparent binding constant is given by
K=
[
SM ]
[
S][M ]
Here, the concentrations at equilibrium.
Fc=
(
Au−Am)
(
Au−Ac)
=
K =
[
SM ]
[
S ]
Fc is the fraction of S that formed a complex, [SM] is concentration at equilibrium, [S] is initial concentration. Au; Am; and Ac are the absorbance (at a chosen wavelength) of solutions of S only (before Cd2+ was added); S and SM mixture
(somewhere in the middle of titration); and SM only (at the end of titration) respectively. The concentration of free Cd2+ at equilibrium, [M]
e, is
found with the following identity.
[
M ]
e=[
M]
0−[
SM ]
e=[
M ]
0−
F
c[
S ]
0K=
F
c1−F
c×
1
[
M ]
eq Quantum yieldQuantum yields of RhDP and RhDP+Cd2+ were
ϕ=ϕ R
(
Grad
Grad
R)
(
η
2η
r2)
ΦRhDP = 0.0187, ΦRhDP+CdRhDP = 0.0187, ΦRhDP = 0.0187, ΦRhDP+CdRhDP+Cd2+ = 0.219
RESULTS and DISCUSSION
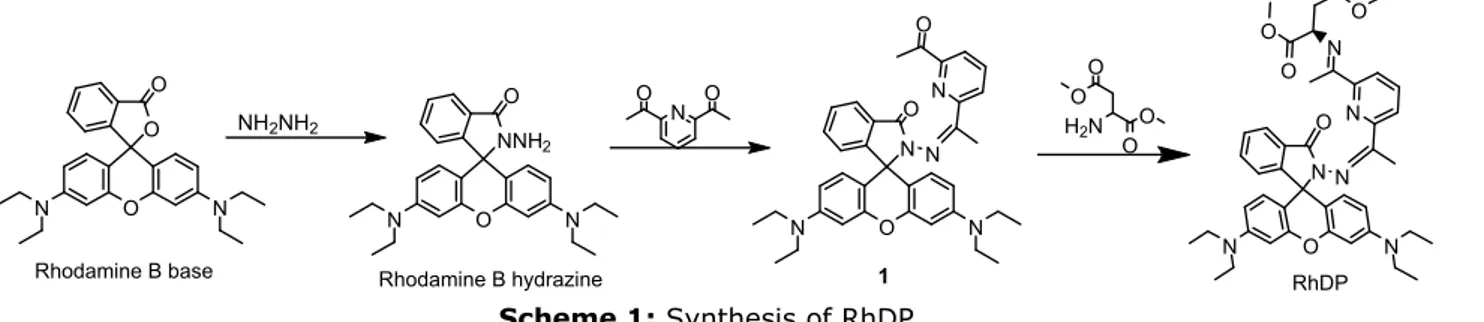
The strategy for the development of RhDP is as follows: 1) Rhodamine B was chosen as a fluorophore due to its excellent photophysical properties (39). 2) Rhodamine B was reacted with
hydrazine to lower the sensitivity of the rhodamine part to pH and be suitable for the next step. 3) Rhodamine B hydrazine was first reacted with 2,6-diacetyl pyridine and then reacted with dimethyl aspartate to obtain the binding part for Cd2+. The
binding part consists of three nitrogen and three oxygen atoms to afford one six-membered ring and four five-membered rings. The sensor, RhDP, was synthesized in a three step procedure (the synthesis of RhDP was explained in the experimental part) with overall yield of 23% (Scheme 1). The sensor was characterized by NMR (13C NMR and 1H NMR) and mass spectrometry.
N O O O O H2N O O N N O N N O N O N O N O N O N N O N O O RhDP 1 N O O N O N O O N NNH2 NH2NH2
Rhodamine B base Rhodamine B hydrazine
Scheme 1: Synthesis of RhDP. The absorption spectral changes of RhDP after
coordination with Cd2+ in ACN/HEPES buffer (10
mM, pH: 7.05, v/v 1:1) were investigated at first. The absorption spectra were recorded at approximately 5 minutes after the addition of each Cd2+ concentration. RhDP is a colorless compound
showing very weak absorption (ε = 7.6 × 10³ M-1
cm-1) in the 450-650 nm region; indicating that
RhDP was dominantly in the formation of the spirocylic form (40). Upon addition of Cd2+ to the
colorless solution of RhDP, it instantaneously turned to pink (see inset in Figure 1a) with an absorption band appearing at 557 nm (ε = 3.15 ×
105 M-1 cm-1) and growing in intensity with the
gradual addition of Cd2+ (Figure 1a), which implies
that the rhodamine spirocylic ring was under ring-opening process (41) as a result of Cd2+ binding. In
order to examine the selectivity of RhDP to Cd2+,
the absorption spectra of RhDP with various metal ions Cr3+, Cu2+, Na+, Hg2+, Mg2+, Ca2+, Fe3+,
Zn2+, Ag+, Pb2+, K+, Co2+, Fe2+, Mn2+ and Ni2+
were collected. As shown in Figure 1b, only Cd2+ gave a large response to RhDP while other
metal ions showed little change in maximum UV-Vis absorption peak (only Cu2+ and Co2+ give
response to the sensor).
Figure 1: (a) Absorption spectra of 20 μM RhDP with gradual addition of CdClM RhDP with gradual addition of CdCl2 (0, 2, 4, 6, 8, 10, 12, 14,
16, 18, 20, 25, 30, 35, 40 µM respectively) in ACN/HEPES buffer (10 mM, pH: 7.05, v/v 1:1); (b) Absorption spectra of RhDP (20 µM) with various metal ions (20 µM for Cd2+, Cu2+, Ni2+, Mn2+, Hg2+, Zn2+,
Ag+, Pb2+, Fe3+, Co2+, Fe2+, Cu+ and Cr3+; 100 µM for Ca2+, Mg2+, K+ and Na+)
Before performing fluorescent experiments for RhDP, the time evolution of RhDP, the response of the RhDP to 1 equivalent of Cd2+ and their stability
in ACN/HEPES buffer (10 mM, pH: 7.05, v/v 1:1)
were studied. As seen in Figure 2, the interaction of RhDP with Cd2+ was completed in less than 5
minutes, and it was stable for 15 hours. RhDP itself was stable in aqueous solution for 8h (emission at
591 nm). The results showed that the coordination of Cd2+ to RhDP also increased the stability of the
sensor.
Figure 2: Time evolution for RhDP (20 µM) and RhDP+Cd2+ (20 µM).
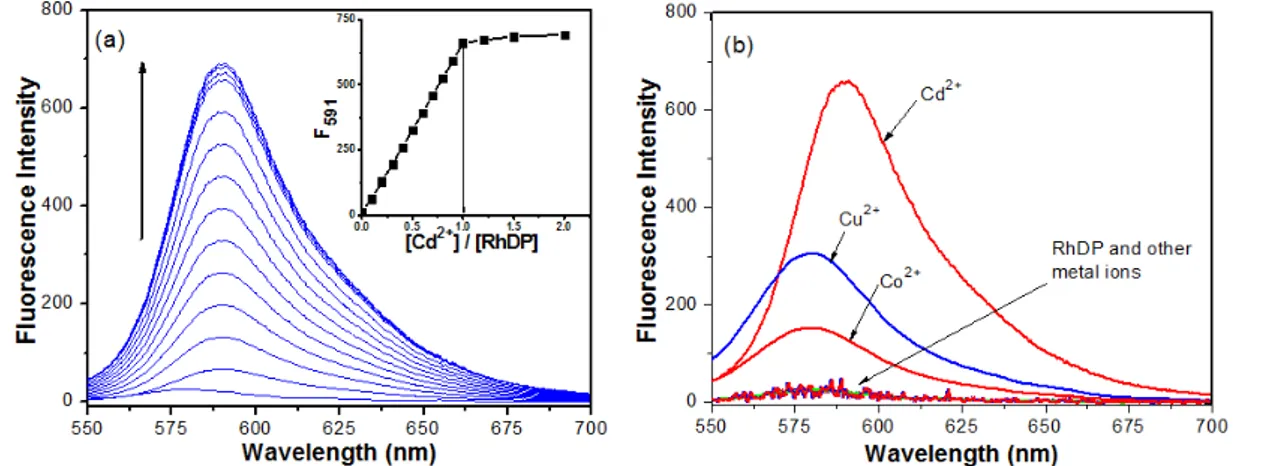
To examine the fluorescent response to Cd2+, a
solution of RhDP in ACN/HEPES buffer (10 mM, pH: 7.05, v/v 1:1) was titrated with various concentrations of Cd2+ and monitored with a
fluorometer by excitation at 530 nm. The sensor (Ф=0.0187) showed a very weak fluorescent emission at 580 nm. Upon the addition of Cd2+ to the RhDP solution, a large
increase in fluorescence was observed at 591 nm, which is attributed to the ring opening induced by the complexation of Cd2+ (Figure
3a). The changes in the fluorescent properties of RhDP as a result of addition of the various metal
ions were tested at 591 nm (excitation at 530 nm). As seen in Figure 3b and blue bars in Figure 4b, only Cd2+ gave a great response to RhDP while
other metal ions showed little change in maximum fluorescent intensity peak (similar as that observed by UV-Vis, only Cu2+ and Co2+
showed a minor enhancement in fluorescence under these conditions.). The emission intensity enhancement at 591 nm (Ф=0.219) is greater than 40-fold with 1.0 equivalent of Cd2+, which was
red-shifted about 11 nm compared with that of RhDP, suggesting that RhDP is a great turn-on fluorescent sensor for Cd2+.
Figure 3: (a) Fluorescence intensities of 20 μM RhDP with gradual addition of CdClM RhDP with gradual addition of CdCl2 (0, 2, 4, 6, 8, 10, 12,
14, 16, 18, 20, 25, 30, 40 µM respectively) in ACN/HEPES buffer (10 mM, pH: 7.05, v/v 1:1); (b) Fluorescence spectra of RhDP (20 µM) with various metal ions (20 µM for Cd2+, Cu2+, Ni2+, Mn2+, Hg2+,
Zn2+, Ag+, Pb2+, Fe3+, Co2+, Cu+,Fe2+ and Cr3+; 100 µM for Ca2+, Mg2+, Na+ and K+).
Rhodamine-based sensors also give response to hydrogen ions (37, 41). To clarify whether the sensor is in the closed-form in ACN/HEPES buffer (10 mM, pH: 7.05, v/v 1:1), the stability of the sensor at different pH values was investigated and monitored by absorption spectra. The pH of the solutions was adjusted by adding HCl (0.1 M) into the solutions. The absorption of RhDP at different pH values was plotted in Figure 4a. The sensor is stable even under pH 5.5.
The detection of the target cation in the presence of other metal ions in real sample is an important assay. Competitive experiments were performed to confirm the high selectivity of the detection system. First, the meal ions such as Cr3+, Cu2+,
Na+, Hg2+, Mg2+, Ca2+, Fe3+, Zn2+, Ag+, Pb2+, K+,
Co2+, Fe2+, Mn2+ and Ni2+ were pre-incubated with
RhDP. As expected, no remarkable change was observed (blue bars in Figure 4b). However, the
addition of 1 equivalent of Cd2+ to each of them
caused fluorescence enhancement (red bars in Figure 4b). These results showed that none of the
metal ions tested affected the sensing properties of RhDP to Cd2+.
Figure 4: (a) Variation of absorption values (557 nm) of RhDP (20 µM) and RhDP+Cd2+ (20 µM) at
various pH values. (b) Fluorescence intensities of RhDP with various metal ions (blue bars) and the subsequent addition of Cd2+ (red bars): 1,Cd2+; 2, Cu2+; 3, Zn2+; 4, Co2+; 5,Cr3+; 6, Ni2+; 7, Hg2+; 8, Mn2+;
9, Pb2+; 10, Ag+; 11, Cu+; 12, Fe3+; 13, K+; 14, Na+; 15, Mg2+; 16, Ca2+; 17, Fe2+.
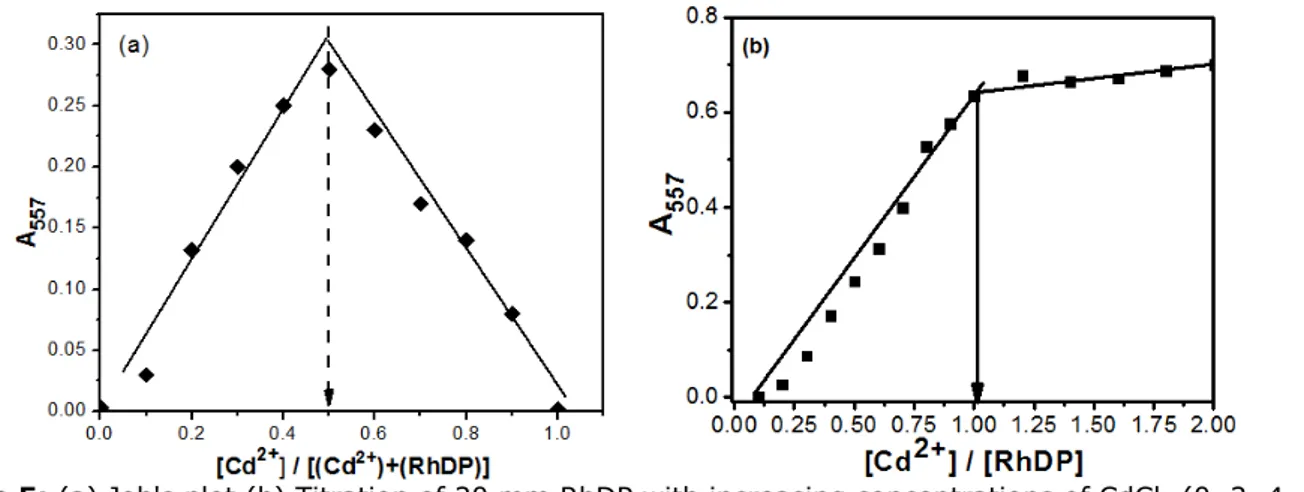
In order to confirm the binding stoichiometry between RhDP and Cd2+, Job's plot and absorption/
fluorescent titration spectra were carried out. As shown in Figure 5a (Job’s plot), RhDP/Cd2+ molar
fractions represented a maximum absorption peak (at 557 nm) when it was close to 0.5, which indicated that the binding between RhDP and Cd2+
was in 1:1 stoichiometry. Typical UV-Vis titration and fluorescent intensity spectra for RhDP with Cd2+ were shown in Figure 3a (see inset in the
Figure) and Figure 5b. As seen in the Figures, the RhDP/Cd2+ molar ratio (for both absorption and
fluorescent results) reached a plateau when the concentration of Cd2+ and an equivalent amount of
RhDP was close to 1:1, suggesting the formation of a 1:1 RhDP-Cd2+ complex. The binding constant
between Cd2+ and RhDP was determined by a
previously reported method (42) with absorption values at 557 nm and was determined to be 2.70 × 10⁷ M-1.
Figure 5: (a) Job's plot (b) Titration of 20 mm RhDP with increasing concentrations of CdCl2 (0, 2, 4, 6,
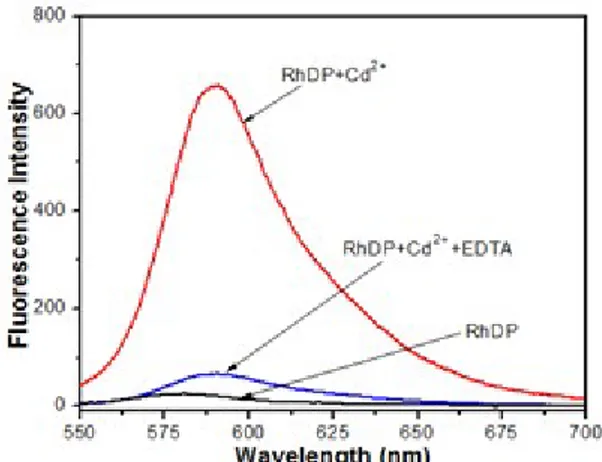
8, 10, 12, 14, 16, 18, 20, 25, 30, 35, 40 µM respectively) in ACN/HEPES buffer (10 mM, pH: 7.05. Furthermore, the reversibility of the binding
between RhDP and Cd2+ was examined. The
complex solution of the sensor and Cd2+ was
treated with a solution of EDTA (5.0 equivalent).
As seen in Figure 6, the fluorescence signals of RhDP-Cd2+ disappeared, which indicated that the
Figure 6: Fluorescence emissions showing reversibility of RhDP (20 μM RhDP with gradual addition of CdClM) to Cd2+ ions by EDTA.
From the above results RhDP coordinates with Cd2+
in a 1:1 binding mode. The proposed 1:1 reversible binding mode of RhDP-Cd
2+ is presented
in Scheme 2.
Scheme 2: Proposed reversible binding mechanism between RhDP and Cd2+. The structure on the left is
ring-closed form and is very weakly fluorescent. The structure on the right is ring-opened form and is strongly fluorescent .
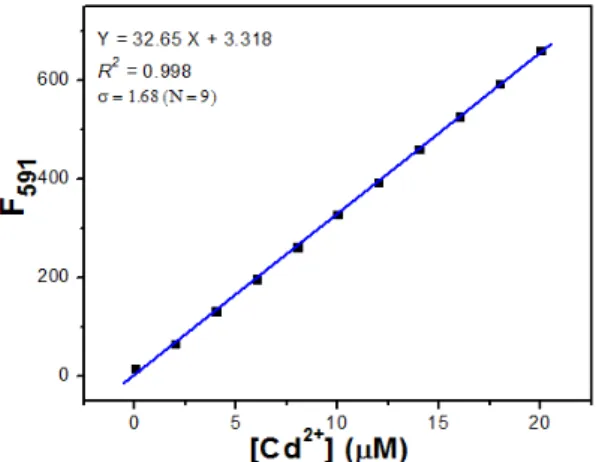
Moreover, the linear concentration range and the fluorescent detection limit of RhDP were obtained. The range of fluorescent intensity (at 591 nm) was linearly dependent on the concentration of Cd2+ in
the range from 0 to 20 µM (R2 = 0.998). The fluorescent detection limit was calculated to be 0.218 µM based on 3σ/k (Figure 7).
Figure 7: Linear relationship between fluorescent intensity and Cd2+ concentration (0–20 μM RhDP with gradual addition of CdClM) Limit of
detection (LOD) of RhDP towards Cd+ by fluorescent method.
In summary, a new turn-on rhodamine based fluorescent sensor RhDP was designed and synthesized for selective detection of Cd2+ ions in
aqueous solutions. The sensor showed an excellently selective fluorescence enhancement for Cd2+ over other metal ions tested with a colour
change and reversible response. The complex stoichiometry between RhDP and Cd2+ was found
to be 1:1 and the binding constant was calculated as 2.70 × 10⁷ M-1 (log K = 7.43) in ACN/HEPES
buffer (10 mM, pH: 7.05, v/v 1:1). The fluorescent detection limit of RhDP for Cd2+ was found to be
0.218 µM, which gave a marked sensitivity towards Cd2+.
REFERENCES
1. Wang C, Fang Y, Peng S, Ma D, Zhao J. Synthesis of novel chelating agents and their effect on cadmium decorporation. Chemical Research in Toxicology. 1999;12(4):331-4.
2. Williams C, David D. The effect of superphosphate on the cadmium content of soils and plants. Soil Research. 1973;11(1):43-56. 3. Salviano Mendes AM, Duda GP, Araujo do Nascimento CW, Silva MO. Bioavailability of cadmium and lead in a soil amended with phosphorus fertilizers. Scientia Agricola. 2006;63(4):328-32.
4. Prozialeck WC, Edwards JR, Woods JM. The vascular endothelium as a target of cadmium toxicity. Life Sciences. 2006;79(16):1493-506. 5. Varriale A, Staiano M, Rossi M, D'Auria S. High-affinity binding of cadmium ions by mouse metallothionein prompting the design of a reversed-displacement protein-based fluorescence biosensor for cadmium detection. Analytical Chemistry. 2007;79(15):5760-2.
6. Can IAfRo. IARC monographs on the evaluation of the carcinogenic risks to humans: beryllium, cadmium, mercury, and exposures in the glass manufacturing industry: World Health Organization; 1993.
7. McFarland C, Bendell-Young L, Guglielmo C, Williams T. Kidney, liver and bone cadmium content in the Western Sandpiper in relation to migration. Journal of Environmental Monitoring. 2002;4(5):791-5.
8. Goyer RA, Liu J, Waalkes MP. Cadmium and cancer of prostate and testis. Biometals. 2004;17(5):555-8.
9. Satarug S, Baker JR, Urbenjapol S, Haswell-Elkins M, Reilly PE, Williams DJ, et al. A global perspective on cadmium pollution and toxicity in non-occupationally exposed population. Toxicology Letters. 2003;137(1-2):65-83.
10. Ye Q-y, Li Y, Jiang Y, Yan X-p. Determination of trace cadmium in rice by flow injection on-line filterless precipitation− dissolution preconcentration coupled with flame atomic absorption spectrometry. Journal of Agricultural Food Chemistry. 2003;51(8):2111-4.
11. Pyle SM, Nocerino JM, Deming SN, Palasota JA, Palasota JM, Miller EL, et al. Comparison of AAS, ICP-AES, PSA, and XRF in determining lead and cadmium in soil. Environmental Science Technology. 1995;30(1):204-13.
12. Dolan SP, Nortrup DA, Bolger PM, Capar SG. Analysis of dietary supplements for arsenic, cadmium, mercury, and lead using inductively coupled plasma mass spectrometry. Journal of Agricultural Food Chemistry. 2003;51(5):1307-12. 13. Bakker E, Pretsch E. Potentiometric sensors for trace-level analysis. Trends in Analytical Chemistry. 2005;24(3):199-207.
14. Prabhakaran D, Yuehong M, Nanjo H, Matsunaga H. Naked-eye cadmium sensor: using chromoionophore arrays of Langmuir−Blodgett molecular assemblies. Analytical Chemistry. 2007;79(11):4056-65.
15. Zhu Y-F, Wang Y-S, Zhou B, Yu J-H, Peng L-L, Huang Y-Q, et al. A multifunctional fluorescent aptamer probe for highly sensitive and selective detection of cadmium(II). Analytical Bioanalytical Chemistry. 2017;409(21):4951-8.
16. Choi M, Kim M, Lee KD, Han K-N, Yoon I-A, Chung H-J, et al. A new reverse PET chemosensor and its chelatoselective aromatic cadmiation. Organic Letters. 2001;3(22):3455-7.
17. Zhang Y, Zhang Z, Yin D, Li J, Xie R, Yang W. Turn-on fluorescent InP nanoprobe for detection of cadmium ions with high selectivity and sensitivity. ACS Applied Materials Interfaces. 2013;5(19):9709-13.
18. Shim S, Tae J. Rhodamine Cyclen-based fluorescent chemosensor for the detection of Cd2+.
Bulletin of the Korean Chemical Society. 2011;32:2928-32.
19. Kim HN, Ren WX, Kim JS, Yoon J. Fluorescent and colorimetric sensors for detection of lead, cadmium, and mercury ions. Chemical Society Reviews. 2012;41(8):3210-44.
20. Nolan EM, Ryu JW, Jaworski J, Feazell RP, Sheng M, Lippard SJ. Zinspy sensors with enhanced dynamic range for imaging neuronal cell zinc uptake and mobilization. Journal of the American Chemical Society. 2006;128(48):15517-28.
21. Komatsu K, Kikuchi K, Kojima H, Urano Y, Nagano T. Selective zinc sensor molecules with various affinities for Zn2+, revealing dynamics and
regional distribution of synaptically released Zn2+ in
hippocampal slices. Journal of the American Chemical Society. 2005;127(29):10197-204. 22. Gunnlaugsson T, Lee TC, Parkesh R. Highly selective fluorescent chemosensors for cadmium in water. Tetrahedron. 2004;60(49):11239-49. 23. Xue L, Li G, Liu Q, Wang H, Liu C, Ding X, et al. Ratiometric fluorescent sensor based on inhibition of resonance for detection of cadmium in aqueous solution and living cells. Inorganic Chemistry. 2011;50(8):3680-90.
24. Xue L, Liu C, Jiang H. Highly sensitive and selective fluorescent sensor for distinguishing
cadmium from zinc ions in aqueous media. Organic Letters. 2009;11(7):1655-8.
25. Chen X, Pradhan T, Wang F, Kim JS, Yoon J. Fluorescent chemosensors based on spiroring-opening of xanthenes and related derivatives. Chemical Reviews. 2011;112(3):1910-56.
26. Dujols V, Ford F, Czarnik AW. A long-wavelength fluorescent chemodosimeter selective for Cu(II) ion in water. Journal of the American Chemical Society. 1997;119(31):7386-7.
27. Shiraishi Y, Sumiya S, Kohno Y, Hirai T. A rhodamine− cyclen conjugate as a highly sensitive and selective fluorescent chemosensor for Hg(II). The Journal of Organic Chemistry. 2008;73(21):8571-4.
28. Bhalla V, Sharma N, Kumar N, Kumar M. Rhodamine based fluorescence turn-on chemosensor for nanomolar detection of Fe3+ ions.
Sensors Actuators B: Chemical. 2013;178:228-32. 29. Weerasinghe AJ, Schmiesing C, Sinn E. Highly sensitive and selective reversible sensor for the detection of Cr3+. Tetrahedron Letters.
2009;50(46):6407-10.
30. Jiao Y, Zhou L, He H, Yin J, Gao Q, Wei J, et al. A novel rhodamine B-based “off-on’’fluorescent sensor for selective recognition of copper(II) ions. Talanta. 2018;184:143-8.
31. Adak AK, Purkait R, Manna SK, Ghosh BC, Pathak S, Sinha C. Fluorescence sensing and intracellular imaging of Pd2+ ions by a novel
coumarinyl-rhodamine Schiff base. New Journal of Chemistry. 2019;43(9):3899-906.
32. Goswami S, Aich K, Das S, Das AK, Manna A, Halder S. A highly selective and sensitive probe for colorimetric and fluorogenic detection of Cd2+ in
aqueous media. Analyst. 2013;138(6):1903-7. 33. Aich K, Goswami S, Das S, Mukhopadhyay CD, Quah CK, Fun H-K. Cd2+ triggered the FRET “ON”: a new molecular switch for the ratiometric detection of Cd2+ with live-cell imaging and bound
X-ray structure. Inorganic Chemistry. 2015;54(15):7309-15.
34. Maniyazagan M, Mariadasse R, Jeyakanthan J, Lokanath N, Naveen S, Premkumar K, et al. Rhodamine based “turn–on” molecular switch FRET–sensor for cadmium and sulfide ions and live cell imaging study. Sensors Actuators B: Chemical. 2017;238:565-77.
35. Sakthivel P, Sekar K, Sivaraman G, Singaravadivel S. Rhodamine diaminomaleonitrile
conjugate as a novel colorimetric fluorescent sensor for recognition of Cd2+ ion. Journal of
Fluorescence. 2017;27(3):1109-15.
36. Soibinet M, Souchon V, Leray I, Valeur BJ. Rhod-5N as a fluorescent molecular sensor of cadmium(II) ion. Journal of Fluorescence. 2008;18(6):1077.
37. Aydin Z, Wei Y, Guo M. An “off–on” optical sensor for mercury ion detection in aqueous solution and living cells. Inorganic Chemistry Communications. 2014;50:84-7.
38. Taylor D, Demas J. Light intensity measurements I: Large area bolometers with microwatt sensitivities and absolute calibration of the Rhodamine B quantum counter. Analytical Chemistry. 1979;51(6):712-7.
39. Kim HN, Lee MH, Kim HJ, Kim JS, Yoon J. A new trend in rhodamine-based chemosensors: application of spirolactam ring-opening to sensing ions. Chemical Society Reviews. 2008;37(8):1465-72.
40. Wei Y, Aydin Z, Zhang Y, Liu Z, Guo M. A turn on fluorescent sensor for imaging labile fe‐on fluorescent sensor for imaging labile fe 3+ in
live neuronal cells at subcellular resolution. ChemBioChem. 2012;13(11):1569-73.
41. Aydin Z, Wei Y, Guo M. A highly selective rhodamine based turn-on optical sensor for Fe3+.
Inorganic Chemistry Communications. 2012;20:93-6.
42. Guo M, Perez C, Wei Y, Rapoza E, Su G, Bou-Abdallah F, et al. Iron-binding properties of plant phenolics and cranberry's bio-effects. Dalton Transactions. 2007(43):4951-61.