* Corresponding Author
Received: 03 August 2018 Accepted: 28 May 2019
Activity Modeling of Some Potent Inhibitors Against Mycobacterium tuberculosis Using Genetic Function Approximation Approach
Shola Elijah ADENIJI*, Sani UBA, Adamu UZAIRU
Ahmadu Bello University, Department of Chemistry, Zaria, Kaduna State, Nigeria [email protected] , ORCID Address: http://orcid.org/ 0000-0002-7750-8174
[email protected] , ORCID Address: https://orcid.org/0000-0002-6973-6361
Abstract
Objectives: The research aimed to develop a theoretical (QSAR) model for predicting the activity of 1,2,4-Triazole derivatives as anti-tubercular antagonist.
Methods: Genetic function approximation (GFA) was employed on a dataset of 1,2,4-Triazole derivatives to investigate their activities behavior on Mycobacterium tuberculosis. This approach led to selection of the optimum descriptors and to generate the correlation QSAR model that relate their activities values against Mycobacterium tuberculosis with the molecular structures of the inhibitors.
Results: The built model was validated and was found to have squared correlation coefficient (R2) of 0.9134, adjusted squared correlation coefficient (Radj) of 0.8753 and
Leave one out (LOO) cross validation coefficient (𝐐𝐜𝐯𝟐 ) value of 0.8231. The external validation set used for confirming the predictive power of the model has R2pred of 0.7482.
Conclusion: Reliability, stability and robustness of the model obtained by the validation test indicate that the model can be used to design and synthesis other 1,2,4-Triazole derivatives with improved anti-tubercular activities.
Keywords: Applicability domain, Genetic function approximation, QSAR, Tuberculosis, Triazole.
Genetik Fonksiyon Tahmin Yaklaşımı Kullanılarak Mycobacterium tuberculosis’e Karşı Bazı Etkili İnhibitörlerin Aktivite Modellemelerinin Yapılması Özet
Amaç: Araştırma, anti-tüberküler antagonisti olarak 1,2,4-Triazol türevlerinin aktivitesini tahmin etmeye yönelik teorik (QSAR) bir model geliştirmeyi amaçlamıştır.
Yöntem: Genetik fonksiyon yaklaşımı (GFA), 1,2,4-Triazol türevlerinin Mycobacterium tuberculosis üzerine etki tarzlarını araştırmak amacıyla kullanılmıştır. Bu yaklaşım, optimum tanımlayıcıların seçimine ve Mycobacterium tuberculosis üzerine etki değerlerini inhibitörlerin moleküler yapılarıyla ilişkilendiren korelasyon QSAR modelinin oluşturulmasına imkân vermiştir.
Sonuç: Oluşturulan model doğrulanmış ve korelasyon katsayısının karesi (R2)
0.9134, düzeltilmiş korelasyon katsayısının karesi (Radj) 0.8753 ve tek-çıkışlı (LOO) çapraz
doğrulama katsayı (Q ) değeri 0.8231 olarak bulunmuştur. Modelin öngörücü gücünü doğrulamak için kullanılan harici doğrulama seti, 0.7482 R 'ye sahiptir.
Tartışma: Doğrulama testi ile elde edilen modelin güvenilirliği, kararlılığı ve sağlamlığı, modelin, gelişmiş anti-füberküler aktivitesine sahip diğer 1,2,4-Triazol türevlerini tasarlamak ve sentezlemek için kullanılabileceğini göstermektedir.
Anahtar Kelimeler: Uygulanabilirlik etki alanı, Genetik fonksiyon yaklaşımı, QSAR, Tüberkülosis, Triazol.
1. Introduction
Tuberculosis (TB) is the leading infectious disease caused by specie of bacteria known as Mycobacterium tuberculosis. About 2.5 billion people were infected with tuberculosis worldwide and mortality of approximately 1.5 million people were reported annually [1-2]. In spite of the first-line drugs; pyrazinamide (PZA), ethambutol (EMB),
isoniazid [5], thrombocytopenia occurring as a result of rifampicin (RIF) [6]. In highlight of these effects, the synthesis of novel compounds with better anti-tubercular activity has been the target of many pharmacist and medicinal chemistry.
A novel series of 1,2,4-Triazole derivatives have been recently reported and identified as potent inhibitors against of M. tuberculosis [7]. Design of novel compounds were usually synthesized using a trial and error approach which is expensive and time consuming. Application of computational chemistry such as Quantitative structure activity relationship (QSAR) help in drug discovery to establish a relationship between various molecular properties of molecules and their observably known activities. The knowledge of (QSAR) technique provides solution to trial and error approach in synthesizing novel drugs and also minimizes effort and time required to discover new compounds or to improve current drugs in terms of their efficiency. The aim of this research was to develop a theoretical (QSAR) model for predicting the activity of 1,2,4-Triazole derivatives against tuberculosis. The aim of this research was to develop QSAR model using Genetic Function Algorithm (GFA) for variable selection of descriptors and multiple linear regression (MLR) method for predicting the activity of 1,2,4-Triazole derivatives as potent anti-Mycobacterium tuberculosis.
2. Materials and Method 2.1 Data Set
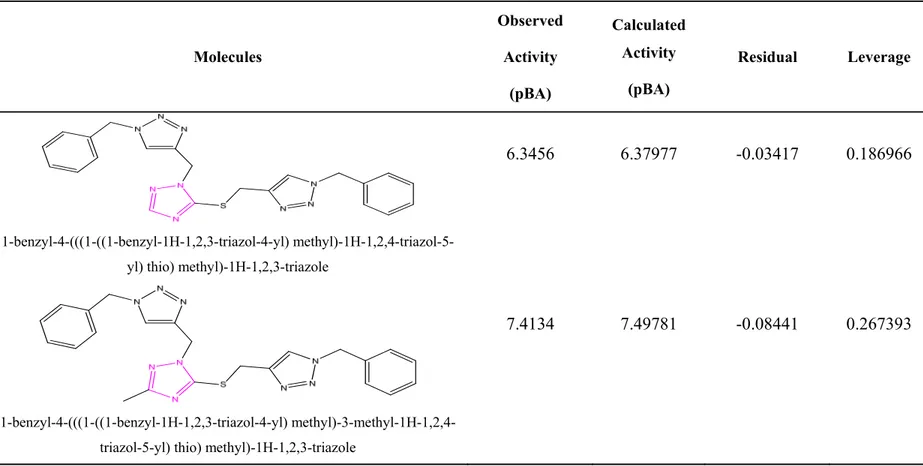
The derivatives of 1,2,4-Triazole derivatives as potent anti-Mycobacterium tuberculosis that were used in this research were selected from the literature [7]. The chemical structures alongside with their biological activities of these compounds were presented Table 1.
Table 1. Molecular structure of 1, 2, 4-Triazole derivatives and their activities as potent anti-Mycobacterium tuberculosis S/N Molecules Observed Activity (pBA) Calculated Activity (pBA) Residual Leverage 1a 1-benzyl-4-(((1-((1-benzyl-1H-1,2,3-triazol-4-yl) methyl)-1H-1,2,4-triazol-5-yl) thio) methmethyl)-1H-1,2,4-triazol-5-yl)-1H-1,2,3-triazole
6.3456 6.37977 -0.03417 0.186966
2
1-benzyl-4-(((1-((1-benzyl-1H-1,2,3-triazol-4-yl) methyl)-3-methyl-1H-1,2,4-triazol-5-yl) thio) methyl)-1H-1,2,3-triazole
3 5-(allylthio)-3-(tert-butyl)-1H-1,2,4-triazole 6.4171 6.410504 0.006596 0.832612 4 3-(allylthio)-5-(4-methoxyphenyl)-1H-1,2,4-triazole 7.6397 7.592776 0.046924 0.15548 5 3-(allylthio)-5-(4-chlorophenyl)-1H-1,2,4-triazole 8.0899 8.37959 -0.28969 0.328411 6 a 1-allyl-3-(allylthio)-5-(4-methoxyphenyl)-1H-1,2,4-triazole 7.366 7.64835 -0.28235 0.085176
S/N Molecules Observed Activity (pBA) Calculated Activity (pBA) Residual Leverage 7 1-allyl-3-(allylthio)-5-(4-chlorophenyl)-1H-1,2,4-triazole 7.0123 7.01666 -0.00436 0.343511 8 a 1-allyl-5-(allylthio)-1H-1,2,4-triazole 6.5267 6.289043 0.237657 0.089973 9 a 1-allyl-5-(allylthio)-3-(4-methoxyphenyl)-1H-1,2,4-triazole 7.3233 7.60012 -0.27682 0.067538 10 5-methyl-3-(prop-2-yn-1-ylsulfonyl)-1H-1,2,4-triazole 7.3279 7.127765 0.200135 0.101346
11 5-(tert-butyl)-3-(prop-2-yn-1-ylsulfonyl)-1H-1,2,4-triazole 6.8568 7.04696 -0.19016 0.218861 12 5-(4-methoxyphenyl)-3-(prop-2-yn-1-ylsulfonyl)-1H-1,2,4-triazole 7.3079 7.3622 -0.0543 0.079898 13 5-(4-chlorophenyl)-3-(prop-2-yn-1-ylsulfonyl)-1H-1,2,4-triazole 7.314 7.277527 0.036473 0.154686 14 1-allyl-3-(tert-butyl)-5-(prop-2-yn-1-ylthio)-1H-1,2,4-triazole 8.5854 8.6647 -0.0793 0.357197
S/N Molecules Observed Activity (pBA) Calculated Activity (pBA) Residual Leverage 15 1-allyl-5-(tert-butyl)-3-(prop-2-yn-1-ylthio)-1H-1,2,4-triazole 8.0615 7.569 0.4925 0.214607 16 5-(allylthio)-3-(tert-butyl)-1-(prop-2-yn-1-yl)-1H-1,2,4-triazole 8.0615 7.79949 0.26201 0.263698 17 3-(allylthio)-5-(tert-butyl)-1-(prop-2-yn-1-yl)-1H-1,2,4-triazole 6.8494 6.60166 0.24774 0.255295 18 a 1-allyl-3-(prop-2-yn-1-ylthio)-1H-1,2,4-triazole 7.9432 7.906989 0.036211 0.409976
19 1-allyl-5-(prop-2-yn-1-ylthio)-1H-1,2,4-triazole 7.4535 7.57474 -0.12124 0.25708 20 1-allyl-3-methyl-5-(prop-2-yn-1-ylthio)-1H-1,2,4-triazole 7.9759 7.966669 0.009231 0.337231 21 1-allyl-3-methyl-5-(prop-2-yn-1-ylthio)-1H-1,2,4-triazole 7.9759 8.17805 -0.20215 0.249575 22 a 3,5-dibromo-1-(prop-2-yn-1-yl)-1H-1,2,4-triazole 7.9294 7.437563 0.491837 0.577201
2.2 Structure Optimization
In order for the molecules to attain a stable conformer at a minimal energy, all the molecules were geometrically optimized with the aid of Spartan 14 V1.1.4 by employing Molecular Mechanics Force Field (MMFF) count to remove strain energy and later subjected to Density Functional Theory (DFT) by utilizing the (B3LYP) basic set [9].
2.3 Molecular Descriptor Calculation
Descriptor is a mathematical logic that describes the properties of a molecule based on the correction between the structure of the compound and its biological activity. Descriptors calculation for all the inhibitory compounds was achieved using PaDEL-Descriptor software V2.20. A total of 1876 molecular descriptors were Observed [10].
2.4 Normalization of Data and Pretreatment
The values for the Observed descriptors’ were normalized using Equation 1 below so that each variable will have the same prospect at the inception so as to sway the model [10].
Y =
(1)
where Y1 is the descriptor value for each molecule, Ymin and Ymax are the minimum and
maximum value for each descriptors column of Y. After successful normalization of the data, the data were further subjected to pretreatment using in order to remove noise and redundant data.
2.5 Data Division into Training and Test Set
The approach of Kennard and Stone was employed in this study to divide the data set into a training set and a test compounds in proportion of 70 to 30%. The training set was used to establish the QSAR model while the test was used to confirm the established model [11].
variable X (descriptors). In MLR analysis, the mean of the dependent variable Y relies on X (Descriptors). MLR equation below is used to incorporate more than one independent variable (Descriptors) with a single response variable.
Y = k1x1 k2x2 k3x3 C (2)
where Y represent the dependent variable, represent the independent variables, ‘k’s are regression coefficients for each ‘x’s and ‘C’ is a regression intercept.
2.7 Generation of QSAR Model and Validation
The combinations of the optimum descriptors for the training set were obtained from the descriptor pool using the Genetic Function Approximation technique. Their anti-lung cancer activities were placed as the last column in their respective spread sheets in Microsoft Excel 2010 which were later imported into the Material Studio software version 8.0 to generate the QSAR and to evaluate the internal validation parameters.
2.8 Determination of Outlier and Influential Molecule (Applicability Domain) The applicability domain approach was employed to determination of outlier and influential molecule. Any compound outside the applicability domain space of 3 is said to be an outlier. To define and describe the applicability domain of the built QSAR models, the leverage hi approach was employed and defined as [12].
hi = Xi 𝑋 𝑋 𝑋 (3)
where Xi is training set matrix of i. X is the n k descriptor matrix of the training set compound and 𝑋 is the transpose of the training set (X). 𝑋 is the transpose matrix Xi used
to build the mode. The warning leverage h* is the limit values to check for influential
molecule. The warning leverage h* is defined as;
h* = 3 (4)
where j is the number of descriptors in the build model and m is the number of compounds that made up the training set [11].
2.9 Assessment of Y-Randomization
The evaluation of Y-Randomization is to show that the developed QSAR model created is reliable, strong, robust and not gotten by chance. This test was performed on the training set data as described by [13]. Multi-linear regression (MLR) models were generated by randomly shuffling the dependent variable (activity data) while keeping the independent variables (descriptors) unaltered. It is expected that the developed QSAR model should have significantly low R2 and Q2 values for numbers of trials in order to
ascertain that the developed QSAR models is robust. Y-randomization Coefficient (c𝑅 is another important parameter which should be more than 0.5 for passing this test.
c𝑅 𝑅 𝑅 𝑅 (5)
Where c𝑅 is Y-randomization Coefficient, R is correlation coefficient for 𝑌-Randomization and Rr is average ‘R’ of random models.
2.10 Quality Assurance of the Model
The fitting ability, stability, reliability, predictive and robustness of the developed models were evaluated by internal and external validation parameters. The validation parameters were compared with the accepted threshold value for any QSAR model [12] shown in Table 2.
models but Model 1 was selected as the best model due to the statistical significance. The observed and calculated activities for inhibitory compounds as well as the residual values were reported in Table 1. The low residual value between observed and calculated activities implies that the model has a very high extrapolative measure.
Model 1
pBA = -0.37456543543 (AATS5e) + 2.087643542 (minHCsatu) + 0.293436327 (RDF90s) + 3.02312046
Model 2
pBA = -0.3285458991* (AATS7s) + 0.024550934 (TDB9e) - 0.117941052 (RDF110i) - 9.645640119
Model 3
pBA = -0.335632223* (AATS7s) + 0.021034761 (TDB9e) - 0.129647108* (RDF30i) + 8.992978173
Validation parameters for selected Model 1 reported in Table 2 passed the required threshold value which actually confirmed the robustness of the model.
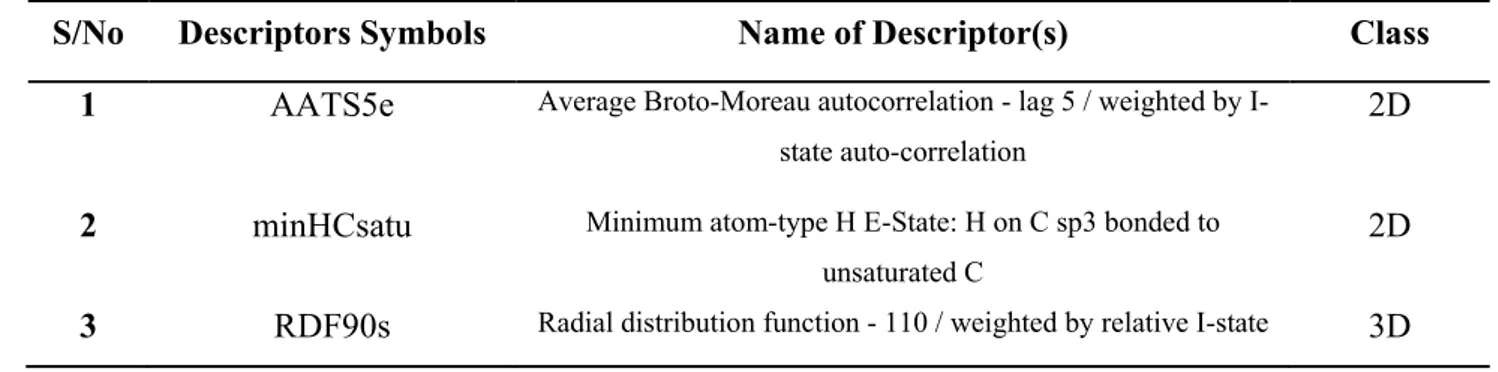
The names and symbols of each descriptors used in the QSAR model were all presented in Table 3. Combination of 2D and 3D descriptors reported in the model proposes that these types of descriptors are able to give an improved characterization of the anti-tubercular agents.
Statistics and Pearson’s correlation were performed for all the four descriptors in the QSAR Model 1 and the results were reported were reported in Table 4. The low correlation coefficients that exist between each pair of the descriptor in Model 1 signify that there is no intercorrelation between each descriptor. Calculated Variance Inflation Factor (VIF) reported for each descriptor was found to be less than four (4) and this is an assurance that the descriptors were statistical orthogonal and the model developed was statistically substantial.
The Mean Effect (ME) values reported in Table 4 gives vital information on the effect of each descriptor and the degree of contribution in the developed model. The magnitude and the signs of the mean effects values indicate their direction and individual strength of the descriptor on the activity of the inhibitory molecule. The estimated P-values for all the descriptors in the Model 1 at 95% level reported in Table 4 were less than 0.05. Therefore the null hypothesis that says there is no association between the descriptors and the activities of the molecules is rejected. Hence the alternative hypothesis that says there is a relationship between the descriptors used in generating the model and the activities of the compounds at p 0.05 is accepted.
Y- Randomization test was also conducted and reported in Table 5. Coefficient for Y-randomization (c𝑅 value of 0.733262 greater than 0.5 supports the claim that the model generated is powerful and not inferred by chance.
1 Friedman LOF 𝑆𝐸𝐸 1 𝐶 𝑀𝑑 𝑝 0.03562 0.03653 0.03931 2 R-squared 1 ∑ 𝑌 ∑ 𝑌 R 0.6 0.9142 0.8832 0.8565 3 Adjusted R-squared 𝑅 𝑛 𝑃 𝑛𝑝 11 R 0.6 0.8851 0.8488 0.8124
4 Cross validated R-squared
(𝑄 1 ∑ 𝑌
∑ 𝑌
Q 0.6 0.8324 0.8031 0.7820
5 Significant Regression Yes Yes Yes
6 Critical SOR F-value (95%) ∑ 𝑌
p ∑ 𝑌 N p 1 F 2.09 3.6832 3.6932 3.7233 7 Replicate points 0 0 0
9 Min expt. error for non-significant LOF (95%)
0.06432 0.05632 0.07632
Model Randomization 10 Average of the correlation
coefficient for randomized data ( 𝑹𝒓)
R 0.5 0.3719 0.3287 0.4321
11 Average of determination
coefficient for randomized data ( 𝑹𝒓𝟐
𝑅 0.5 0.1645 0.1356 0.2353
12 Average of leave one out
cross-validated determination coefficient for randomized data
( 𝑸𝒓𝟐 ) 𝑄 0.5 -1.2524 -1.4321 -1.3734 13 Coefficient for Y-randomization (c𝑅 R 1 |R R | cR 0.6 0.7332 0.6432 0.6284 External Validation 14 𝐑𝟐𝐭𝐞𝐬𝐭 1 ∑ Y∑ Y Y Y R 0.6 0.7494 0.7112 0.6532
2 minHCsatu Minimum atom-type H E-State: H on C sp3 bonded to unsaturated C
2D 3 RDF90s Radial distribution function - 110 / weighted by relative I-state 3D
Table 4. Pearson’s correlation and statistics for descriptor used in the QSAR model Inter-correlation Statistics
AATS7s TDB9e RDF90i P-Value
(Confidence Interval)
VIF Mean Effect (ME)
AATS7s 1 0.00014 2.4313 -0.4322
TDB9e -0.18343 1 0.00073 2.2322 0.5356
RDF90i 0.43432 -0.23298 0.00051 1.0132 0.2084
Table 5. Y- Randomization Parameters test for Model 1
Model R R^2 Q^2 Original 0.85791 0.736009 0.361481 Random 1 0.263469 0.069416 -0.42957 Random 2 0.634931 0.403137 -3.21615 Random 3 0.44027 0.193838 -1.71176 Random 4 0.45403 0.206144 -0.7079 Random 5 0.642442 0.412732 -4.71577 Random 6 0.116309 0.013528 -0.3569 Random 7 0.24943 0.062215 -0.2046 Random 8 0.296007 0.08762 -0.42455 Random 9 0.270977 0.073429 -0.37515 Random 10 0.351074 0.123253 -0.38131
Random Models Parameters
Average r : 0.371894
Average r^2 : 0.164531
Average Q^2 : -1.25236
cRp^2 : 0.733262
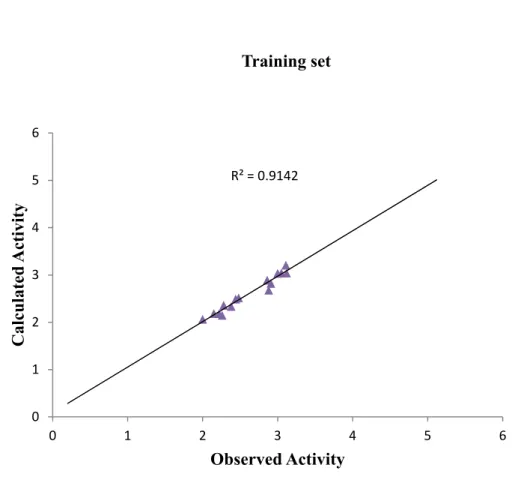
Figure 1. Plot of calculated activity against observed activity of training set
R² = 0.9142 0 1 2 3 4 5 6 0 1 2 3 4 5 6 C alc u la ted A ct iv it y Observed Activity Training set
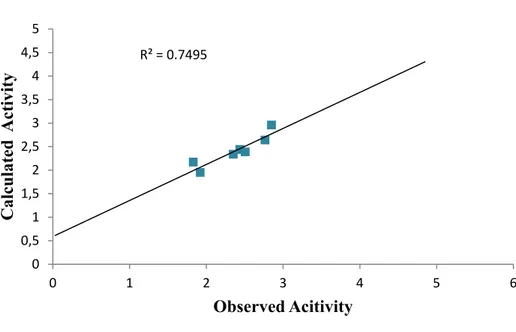
Figure 2. Plot of calculated activity against observed activity of test set
Figure 3. Plot of residual values versus observed activity
0 0,5 1 1,5 2 2,5 3 3,5 0 1 2 3 4 5 6 Cal cul ate d Ac tiv ity Observed Acitivity ‐0,25 ‐0,2 ‐0,15 ‐0,1 ‐0,05 0 0,05 0,1 0,15 0,2 0,25 0 0,5 1 1,5 2 2,5 3 3,5 Resi dual Observed Activity TRAINING SET TEST SET
The graph of calculated activities plotted against observed activities of the training and test set are presented in Figure 2 and 3. The correlation coefficient (R2) value of 0.9436
for the training set and (R2) value of 0.8364 for the test set recorded in this work was found
to in line with accepted QSAR threshold values reported in Table 2. This affirms the stability, reliability and predictive power of the built model. The plot of residual activity against observed activities shown in Figure 4 designates that there exist no computational inaccuracy in the derived QSAR model as the range of residuals values fall within an accepted limit of 2 on residual activity axis.
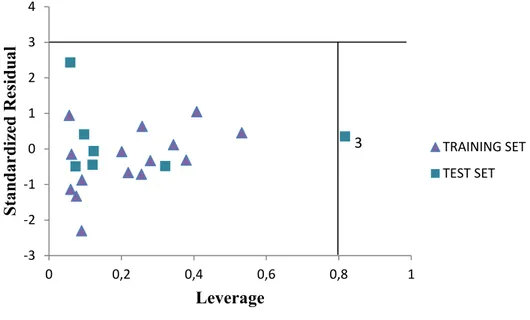
The standardized residuals activities plotted against the leverage value known as The Williams plot is shown in Figure 5. The plotted graph clearly shows that all the compounds falls within limit boundary 3 of standardized cross-validated residual. Hence, it can be infer that no outlier is observed in the data set. However, compound (number 3) is found to have a leverage value greater than the calculated warning leverage (h* = 0.80). Therefore the compound is an influential molecule.
Figure 4. Plot of standardized residual activity versus leverage
‐3 ‐2 ‐1 0 1 2 3 4 0 0,2 0,4 0,6 0,8 1 Stan dardi zed R esidual Leverage TRAINING SET TEST SET 3
derivatives. These descriptors produced a robust model to predict the anti-mycobacterium activities of these compounds. The validation test (internal and external validation test) conducted on the selected built QSAR model passed the threshold value for a generally acceptable QSAR model. The model generated provides a valuable approach for ligand based design in synthesis of more effective chemical compounds and also give important insights into structural variants leading to the development of novel tubercular inhibitors.
References
[1] Lönnroth, K., Castro, K. G., Chakaya, J. M., Chauhan, L. S., Floyd, K., Glaziou, P. and Raviglione, M. C., Tuberculosis Control and Elimination 2010–50: Cure, Care, and Social Development, The Lancet, 375, 1814-1829, 2010.
[2] Jhamb, S. S., Goyal, A. and Singh, P. P., Determination of the Activity of Standard Anti-tuberculosis Drugs Against Intramacrophage Mycobacterium Tuberculosis, in vitro: MGIT 960 as a Viable Alternative for BACTEC 460, Braz., J. Infect. Dis., 18, 336-340, 2014.
[3] Aziz, M. A., Wright, A., Laszlo, A., De Muynck, A., Portaels, F., Van Deun, A., Wells, C., Nunn, P., Blanc, L. and Raviglione, M., WHO/International Union Against Tuberculosis and Lung Disease Global Project on Anti-tuberculosis Drug Resistance Surveillance. Epidemiology of Anti-tuberculosis Drug Resistance (the Global Project on Anti-tuberculosis Drug Resistance Surveillance), Lancet, 368, 2142-2154, 2006.
[4] Balabanova, Y., Ruddy, M., Hubb, J., Yates, M., Malomanova, N., Fedorin, I. and Drobniewski, F., Multidrug-Resistant Tuberculosis in Russia: Clinical Characteristics, Analysis of Second-Line Drug Resistance and Development of Standardized Therapy, Eur. J. Clin. Microbiol. Infect. Dis., 24, 136-139, 2005.
[5] Abideen, P. S., Chandrasekaran, K., Uma Maheswaran, V. A. and Kalaiselvan, V., Implementation of Self Reporting Pharmacovigilance in Anti Tubercular Therapy Using Knowledge Based Approach, J. Pharmacovigil., 1, 2, 2013.
[6] Yakar, A., Yakar, F. and Yildiz, N., Isoniazid-and Rifampicin-induced Thrombocytopenia, Multidiscip. Respir. Med., 8, 13, 2013.
[7] Sarkar, D., Deshpande, S. R., Maybhate, S. P., Likhite, A. P., Sarkar, S., Khan, A., Chaudhary, P. M. and Chavan, S. R., 1, 2, 4-triazole Derivatives and Their Anti-microbial Activity, Google Patent, 2016.
[8] Ibezim, E. C., Duchowicz, P. R., Ibezim, N. E., Mullen, L. M., Onyishi, I. V., Brown, S. A. and Castro, E. A., Computer-aided Linear Modeling Employing QSAR for Drug Discovery, Sci. Res. Essays., 4, 1559-1564, 2009.
[9] Adeniji, S. E., Audu, K. E., Abdullahi, M., Mahmoud, A. Y. and Danzarami, D., Genetic Function Approximation and Multi-Linear Regression Approach for Activity Modeling of Ciprofloxacin Derivatives as Potential Anti-Prostate Cancer Agents: A Theoretical Approach, Kenkyu Journal of Pharmacy Practice & Health Care, 4, 6-16, 2018.
[10] Adeniji, S. E., Sani, U. and Uzairu, A., Multivariant QSAR Model for Some Potent Compounds as Potential Anti-Tumor Inhibitors: A Computational Approach, Turk. Comput. Theor. Chem., 3(1) 38-46, 2019.
[11] Adeniji, S. E., Uba, S., Uzairu, A. and Arthur, D. E., A Derived QSAR Model for Predicting Some Compounds as Potent Antagonist Against Mycobacterium Tuberculosis: A Theoretical Approach, Adv. Prev. Med., Article ID 5173786, 2019.
[12] Veerasamy, R., Rajak, H., Jain, A., Sivadasan, S., Varghese, C. P. and Agrawal, R. K., Validation of QSAR Models-strategies and Importance, Int. J. Drug Des. Discov., 3, 511-519, 2011.
[13] Tropsha, A., Gramatica, P. and Gombar, V. K., The Importance of Being Earnest: Validation is the Absolute Essential for Successful Application and Interpretation of QSPR Models, Mol. Inform., 22, 69-77, 2003.