Turkish Journal of Agriculture - Food Science and Technology
Available online, ISSN: 2148-127X | www.agrifoodscience.com | Turkish Science and TechnologyRelation Between Ergosterol and Various Mycotoxins in Different Cheeses
Çetin Kadakal1,a, Nizam Mustafa Nizamlioğlu2,b, Tolga Kağan Tepe3,c,*,Sevda Arisoy4,d, Begüm Tepe5,e, Heysem Suat Batu1,f
1Department of Food Engineering, Faculty of Engineering, Pamukkale University, 20160 Kınıklı Campus/Denizli, Turkey 2Department of Food Engineering, Faculty of Engineering, Karamanoğlu Mehmetbey University, 70100 Karaman, Turkey
3Istanbul Gelişim University, Vocational School of Health Services, Department of Food Quality Control and Analysis, 34310 Istanbul, Turkey 4
Food Technology, Health Sciences Faculty, University of Health Science, 34668 Istanbul, Turkey
5Gastronomy and Culinary Arts Department, Fine, Art, Design and Architecture Faculty, Istinye University, 34010 Istanbul, Turkey * Corresponding author A R T I C L E I N F O A B S T R A C T Research Article Received : 11/11/2019 Accepted : 18/02/2020
Thirteen different mostly consumed cheese samples were obtained from different provinces in Turkey and were investigated in terms of contents of ergosterol, patulin and Ochratoxin A (OTA). Ergosterol, patulin and OTA analyses were carried out by using the apparatus of high-performance liquid chromatography (HPLC). Ergosterol contents of samples ranged from 30.27±0.69 to 144.76±9.41 mg/kg. The values of OTA in the samples were ranged from 6.96±0.05 to 41±0.2 µg/kg. Ergosterol was significantly correlated with OTA (r = 0.99, R2 = 0.98). According to this high correlation, ergosterol might be used as a more readily measurable indicator of potential OTA production. No patulin was detected in all samples. Absence of patulin on cheese samples may be explained with unsuitable media for patulin producing.
Keywords: Cheese Ergosterol Mycotoxins Quality Assurance Safety a ckadakal@pau.edu.tr
http://orcid.org/0000-0002-6608-3887 b munizam@kmu.edu.tr http://orcid.org/0000-0003-0067-3419
c tolga.kagan.tepe@gmail.com
http://orcid.org/0000-0003-0484-7295 d sevdarisoy@hotmail.com http://orcid.org/0000-0003-2711-596X
e begumotag@gmail.com
http://orcid.org/0000-0002-2656-4555 f h.s.batu@gmail.com http://orcid.org/0000-0002-7743-4638
This work is licensed under Creative Commons Attribution 4.0 International License Introduction
Cheese is ancient food produced by fermentation. There is strong evidence that cheese was produced in the sixth century and its production is associated with different regional technical, social and economic conditions (Quijada et al. 2017). Cheese, is fundamental dairy product rich in vitamins, proteins, minerals, carbohydrates and fats (Barone et al. 2018). Cheese is also a suitable substrate for moulds. Mould growth on cheese may occasionally be a significant problem during ripening process or storage. Cheese ripening is the last stage of the cheese production process. Cheese ripening has a decisive technological role because of involving the evolution of complex biochemical reactions, such as glycolysis, proteolysis, lipolysis and flavour formation (Corrieu et al., 2018). Most of the cheese varieties have a certain time in the ripening phase after
being produced. In order to avoid unfavourable situations, the cheese must be carefully processed during the ripening phase (Düsterhöft et al., 2017). Due to the improper ripening and storage conditions, moulds grow and produce seconder metabolites called mycotoxin. These metabolites cause negative changes in flavour, smell or texture of the cheese. These negative changes lead to food waste and economic losses. Additionally, mycotoxins may be hazardous for health. Exposure (absorption by skin, ingestion or inhalation) to mycotoxins may cause various diseases and have negative effects on kidney, liver or the immune system. These toxic effects may be teratogenic, carcinogenic or mutagenic for both animals and humans (Creppy, 2002). Penicillium spp., Aspergillus spp.,
896
Trichoderma spp. are important fungal species producing
mycotoxins and growing on cheese (Hymery et al. 2014). Common mycotoxins produced by moulds are aflatoxin, ochratoxin A (OTA), ergot alkaloids, citrinin, zearalenone, fumonisins, patulin and trichothecenes (Bennett and Klich, 2003).
Patulin [4-hydroxy-4H-furo(3, 2-c) pyran-2(6H)-one] is produced by many fungal species. The most important patulin producer moulds in foods are Penicillium patulum and Penicillium expansum. Several species of Aspergillus (Aspergillus clavatus, A. terreus, A. giganteus),
Byssochlamys (B. Nivea and B. fulva) and Penicillium (P. roqueforti, P. melinii, P. equinum, P. calavrforme etc.) can
also produce patulin. Patulin is commonly found in pome fruit products especially apple juice. Besides, presence of patulin is reported in various foods such as shellfish, cereals and cheese (Pattono et al., 2013). It has been stated that the presence of patulin in the indicated products is closely related to the composition of fruit and vegetables and that the -SH groups in these products affect patulin synthesis or impair their stability (Artık et al., 1995; Kadakal and Nas, 2000). No or very low Patulin might exist in dairy products such as cheeses and meat products such as sausage and salami is associated with the same reason (Lieu and Bullerman, 1977; Scott and Kanhere 1979; Kokkonen et al., 2005). Although there is no evidence for negative effects of patulin on humans, the Joint Food and Agriculture Organization–World Health Organization (WHO) Expert Committee (1993) on Food Additives has suggested a limit value (maximum tolerable daily intake for patulin of 0.4 mg/kg of body weight) based on the results of studies on animals.
OTA (2S)-2-[[(3R)-5-chloro-8-hydroxy-3-methyl-1-oxo-3,4-dihydroisochromene-7-carbonyl] amino]-3-phenylpropanoic acid is produced by many different species of Aspergillus (A. ochraceus, A. niger, A. alliaceus,
A. auricomus, A. carbonarius, A. glaucus, A. melleus) and Penicillium (P. nordicum,P. verrucosum). OTA is mostly
found in grains (barley, corn, wheat, rye), fruits (figs, raisin) and some seeds (coffee, cocoa seeds) (Dall’Asta et al., 2008). OTA was classified as a possible human carcinogen (category 2B) by the International Cancer Research Agency (IARC, 1993). Additionally, OTA has been reported to cause various types of tumors in the urinary tract and kidney diseases called “Balkan Endemic Nephropathy” in some Balkan countries such as Bulgaria, Greece and Romania (Battilani 2002).
Ergosterol (5,7,22-ergostatrien- 3β-ol; provitamin D2) is a compulsory component of the cell membranes of fungal species. Ergosterol is almost never found in plant, animal or bacterial cells (Kadakal and Tepe, 2019). Some researches show that ergosterol may be used a marker of fungal activity in foods such as grapes, tomatoes, or hazelnuts. Various researches show that there may be relation between mycotoxins and ergosterol in foods (Ekinci et al., 2014). Ergosterol may provide an additional parameter for grape rot detection by enhancing the reliability of the assessment or even replacing other parameters. Ergosterol may be utilized as a universal indicator of fungal grape contamination (Porep et al., 2014). Also, ergosterol assay has been reported to be higher detection limits, more feasible, rapid and low cost when compared to mycotoxin assay (Kadakal et al., 2018).
The aim of this study was to determine the contents of ochratoxin A, patulin and ergosterol in collected cheese samples which were produced by different techniques in Turkey and to determine the correlation between, if any, ergosterol and mycotoxin content. The other aim of this study was to determine whether measurement of ergosterol in cheese samples is an indicator for the presence of moulds or not.
Materials and Methods
Samples
In this study, 13 different mostly consumed cheeses were collected from different provinces in Turkey and were used as sample. The cheese samples were stored at 4°C in the refrigerator until analysis.
Standard Solution
All reagents used in the analyses were HPLC grade. Crystalline forms of patulin (PubChem ID: 24898227, Product no: P1639), ergosterol (PubChem ID: 24894628, Product no: E6510) and OTA (PubChem ID: 24897954, Product no: O1877) were purchased from Sigma–Aldrich Chemie GmbH Deisenhofen, Germany for preparation of standard solutions. Nine-point calibration curve (R2=0.999) with the triplicate injections, covering the
range of 1-500 ppm for ergosterol, five-point calibration curve (R2=0.999), with the triplicate injections, covering
the range of 1-100 ppb for patulin and for OTA were set to calibrate the high-performance liquid chromatography (HPLC) instrument.
Determination of Ergosterol
The method modified by Ghiretti et al. (1995), modified from Schwadorf and Muller (1989)'s method about HPLC was used for the determination of ergosterol in cheese samples. 75 ml of methanol, 50 ml of ethanol and 10 g of potassium hydroxide were added into two grams of sample and saponified. Following boiling for 1 h, the resultant mixture was filtered. The mixture was separated in a separatory funnel with water and n-hexane (water/hexane; 1:2) by shaking for 1 min. After first separation, the bottom layer re-transferred and shaken by adding 50 ml of hexane for 1 min and the last top layer was combined with the first top layer. After that, the bottom layer was removed and the combined top layer was filtered over anhydrous sodium sulphate (Na2SO4). The filtered
hexane phase was removed by using a rotary evaporator at 40°C until 1 ml of residue is obtained and was dried under nitrogen gas until dryness. The residue was dissolved in 2 ml of n-hexane and filtered by using 0.45 µm micro filter. 20 µl portion of the extract was injected into the HPLC column. The mobile phase was n-hexane and isoamyl alcohol (95/5; v/v) with a flow rate of 1 ml/min. The HPLC conditions for ergosterol analysis are given in Table 1.
Determination of Patulin
Sample preparation suggested by Kadakal et al. (2005) was used. 5 g of cheese sample was mixed with 70 ml of deionized water (pH 3.3). The mixture was homogenised for 1 min. Following the addition of 30 ml hexane into the homogenized sample, the mixture was heated at 90°C for 1h and filtered.5ml of ethyl acetate and 5 ml of the filtrate
897 was mixed and added into a separator funnel and then the
mixture was shaken during 1 min. Following the separation, the top layer was collected. Following repeating this process three times, all top layers was collected, remaining layer was removed. After, Na2CO3
(1.4%) and 5ml of ethyl acetate were mixed in the last separator funnel and shaken during 1 min for the last extraction. After the last extraction phase, the separated top layer was added into the other top layers. After, five drop acetic acid was added into the collected top layers. The organic phase was removed by means of rotary evaporator and the residue was dried through nitrogen gas until dryness. The residue was dissolved in acetonitrile (ACN) solution (10:90, ACN: water, v/v) and filtered through 0.45 µm micro filter. 20 µl of the filtrate were injected into the HPLC column. The mobile phase was ACN and distilled water (10:90, ACN: water, v/v) with the flow rate of 2 ml/min. The HPLC conditions for patulin are presented in Table 1.
Determination of OTA
Sample preparation method for determination of OTA was performed according to Dall’Asta et al. (2008). 150 g of each sample and 15 ml double distilled water were blended and homogenized in a laboratory blender. After the addition of 50 ml of CHCl3 and 1 ml of saturated NaCl
solution were added into 5g of homogenized sample, the mixture was mixed and its pH was adjusted to 3.0 with 85%
H3PO4. The mixture was filtered by using Whatman no 4
filter. 25 ml of filtrate was extracted two times with 10 ml NaHCO3. The obtained solution was purified with immune
affinity column (IAC). IAC was conditioned with 10 ml of phosphate buffer solution (PBS) and following that 10 ml of the solution was applied on the IAC column at a flow rate of 1 drop/s. After that, IAC was washed with 5 ml of PBS and cleaned up with 5 ml of distilled water. 2 ml of methanol was added into the purified extract for elution of OTA. The eluate was evaporated with a rotary evaporator and dried under nitrogen gas until dryness. Then the residue was dissolved with 0.5 ml of ACN and 5 µl of final extract was injected into HPLC column. The mobile phase was ACN: ammonia buffer (NH4Cl/NH3, 20 mM, pH 9.8)
(15:85, v/v) with the flow rate 0.2 ml/min. The HPLC conditions for OTA are shown in Table 1.
Further Determinations
Methods, suggested by IDF (1982) and IDF (1993) (Kjeldahl method) were used for the determination of fat and protein contents of cheese samples, respectively. The salt (%) and dry matter (%) contents of cheese samples were determined by using the methods suggested by Bradley et al. (1992) and Cemeroğlu (1992), respectively.
Statistical Analyses
SPSS software (ver. 22 SPSS Inc., Chicago, IL, USA) was used for the statistical analysis of all data.
Table 1. Apparatus and conditions of HPLC for Ergosterol, Patulin and Ochratoxin A
Apparatus / Condition Ergosterol Patulin Ochratoxin A
Liquid Chromatography and
Pump Shimadzu LC-20AD Shimadzu LC-20AD Shimadzu LC-20AD
Column BioRad HPX-87H 300mm × 7.8 mm BDS Hypersil C18
(100×4.6 mm, 3µm)
BDS Hypersil C18 (100×4.6 mm, 3µm)
Detector Shimadzu 20AD PDA,
282 nm Shimadzu 20AD 272 nm
Shimadzu 20AD λex = 380
nm and λem = 440 nm
Column Oven Shimadzu (CTO-20A), 25°C Shimadzu (CTO-20A), 25°C Shimadzu (CTO-20A), 25°C
Degasser Shimadzu DGU-20A3 Shimadzu DGU-20A3 Shimadzu DGU-20A3
Mobile Phase n-hexane: İsoamylalcohol
(95/5; v/v)
ACN: distilled water (10:90, ACN: v/v)
ACN: ammonia buffer (NH4Cl/NH3, 20 mM, pH
9.8) (15:85, v/v)
Flow Rate 1 ml/min 2 ml/min 0.2 ml/min
Injection Volume 20 µl 20 µl 20 µl
Coefficient of Determination 0.99 0.99 0.99
Signal to Noise Ratio 3 3 3
Detection Limit 0.1 - 0.5 mg/L 0.1 µg/L 0.1 µg/L
Results and Discussion
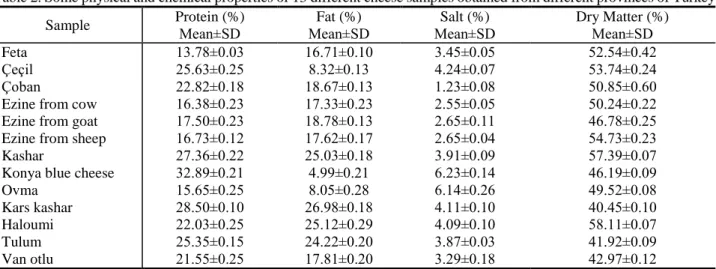
Some physical and chemical properties of 13 different cheese samples obtained from supermarkets in different provinces of Turkey are given in Table 2. Protein contents of cheese samples ranged from 13.78±0.03% to 32.89±0.21%. Among all samples, protein content of Konya blue cheese was found higher when compared with other samples. On the other hand, fat contents of samples ranged from 4.99±0.21% to 26.98±0.176%. The highest fat content was determined in Kars Kashar as 26.98±0.18%. According to Turkish Food Codex, Kars Kashar and Haloumi are semi-fat cheese, Çeçil, Ovma and Konya blue cheese are fat-free cheese. The rest of samples are low-fat
cheese. Salt contents of samples ranged from 1.23±0.08% to 6.23± 0.14%. It was determined that the salt contents of some cheese samples exceeded the limit specified in the Turkish Food Codex. Çeçil, Kashar, Konya blue cheese and Haloumi contain high concentration of salt according to limit specified in the Turkish Food Codex. When samples were investigated in terms of dry matter, only dry matter of Konya blue cheese was determined below the limit of Turkish Food Codex.
Ergosterol, OTA and patulin contents of 13 cheese samples were shown in Table 3. No patulin content was detected in all samples. This is because cheese is
898
inappropriate substrate for the formation of mycotoxins such as PR-toxin, patulin and penicillic acid. In addition, these mycotoxins are unstable in the cheese matrix (Kokkonen et al., 2005). Besides, it is considered that moulds producing toxic compounds constitute only a minor fraction of the flora of cheese and cheese production facilities (Bullerman, 1980).
The OTA values of the samples were given in Table 3. The values of OTA on the samples were ranged from 6.96±0.05 to 41.00±0.20 µg/kg. These values were lesser than those reported by Pattono et al. (2013). In another study done by Kokkonen et al. (2005), no detectable value of OTA was found in blue and white mould cheese. This is because it might be explained with good manufacturing process, good storage conditions, raw material or starter moulds having lesser ability producing mycotoxins than moulds in traditional products (Kokkonen et al., 2005). OTA is considered as direct contaminant in the foods through planty foods (Öksüztepe and Erkan, 2016). This means whether raw materials of obtained cheese samples were contaminated by OTA before process or OTA on each sample was produced by moulds during process, storage or ripening due to inappropriate conditions (Pattono et al., 2013). European Commission (EC) has not established any limit value of OTA for animal foods (Pattono et al., 2013). Nevertheless, OTA has been limited for wines as 2 µg/kg
by EC (2006). Additionally, Turkish Food Codex has limited OTA for wines, roasted coffee and dried vine products as 2, 5 and 10 µg/kg, respectively. OTA values of cheese samples have exceeded the limited values suggested by Turkish Food Codex when compared with the limit values of OTA for wines and roasted coffee.
Ergosterol contents of 13 different cheese samples, shown in Table 3, ranged from 30.27±0.69 to 144.76±9.41 mg/kg. Any limit value of ergosterol has not been established by authorities for cheeses and thus, comparison was made according to limit value for tomato products. The acceptable limit value of ergosterol for tomato products is 15 mg of total ergosterol/kg total solids (Ghiretti et al. 1995; Bocchi et al., 1995). However, the values of ergosterol detected in cheese samples significantly exceeded the suggested limit. This finding indicates that collected cheese samples were contaminated by moulds. Since ergosterol is a non-specific constituent of fungi, differentiation between various mould strains and species is impossible (Porep et al., 2014). Ergosterol might be utilized as an indicator of mouldy cheeses contamination and may provide an additional parameter for OTA. The moulds in the cheese samples are in the form of hidden moulds except Konya blue cheese. Even though mould colonies were not visible, ergosterol was detected in all cheese samples.
Table 2. Some physical and chemical properties of 13 different cheese samples obtained from different provinces of Turkey
Sample Protein (%) Mean±SD Fat (%) Mean±SD Salt (%) Mean±SD Dry Matter (%) Mean±SD Feta 13.78±0.03 16.71±0.10 3.45±0.05 52.54±0.42 Çeçil 25.63±0.25 8.32±0.13 4.24±0.07 53.74±0.24 Çoban 22.82±0.18 18.67±0.13 1.23±0.08 50.85±0.60
Ezine from cow 16.38±0.23 17.33±0.23 2.55±0.05 50.24±0.22
Ezine from goat 17.50±0.23 18.78±0.13 2.65±0.11 46.78±0.25
Ezine from sheep 16.73±0.12 17.62±0.17 2.65±0.04 54.73±0.23
Kashar 27.36±0.22 25.03±0.18 3.91±0.09 57.39±0.07
Konya blue cheese 32.89±0.21 4.99±0.21 6.23±0.14 46.19±0.09
Ovma 15.65±0.25 8.05±0.28 6.14±0.26 49.52±0.08
Kars kashar 28.50±0.10 26.98±0.18 4.11±0.10 40.45±0.10
Haloumi 22.03±0.25 25.12±0.29 4.09±0.10 58.11±0.07
Tulum 25.35±0.15 24.22±0.20 3.87±0.03 41.92±0.09
Van otlu 21.55±0.25 17.81±0.20 3.29±0.18 42.97±0.12
-Analyses were performed in 3 replicates.
Table 3. Ergosterol, OTA and Patulin contents of 13 cheese samples.
Sample Ergosterol (mg/kg) Mean±SD OTA (µg/kg) Mean±SD Patulin (µg/kg) Mean±SD Feta 43.35±1.74 12.33±0.15 ND Çeçil 38.31±1.70 9.32±0.10 ND Çoban 43.27±3.51 12.55±0.15 ND
Ezine from cow 36.44±1.08 7.55±0.15 ND
Ezine from goat 39.35±2.84 8.64±1.14 ND
Ezine from sheep 43.57±3.08 13.05±0.15 ND
Kashar 37.61±0.54 8.55±0.15 ND
Konya blue cheese 144.76±9.41 41.00±0.20 ND
Ovma 30.27±0.69 6.65±0.22 ND
Kars Kashar 45.77±0.47 14.07±0.21 ND
Haloumi 41.51±0.89 11.28±0.57 ND
Tulum 35.63±2.59 7.54±0.05 ND
Van otlu 30.53±0.40 6.96±0.05 ND
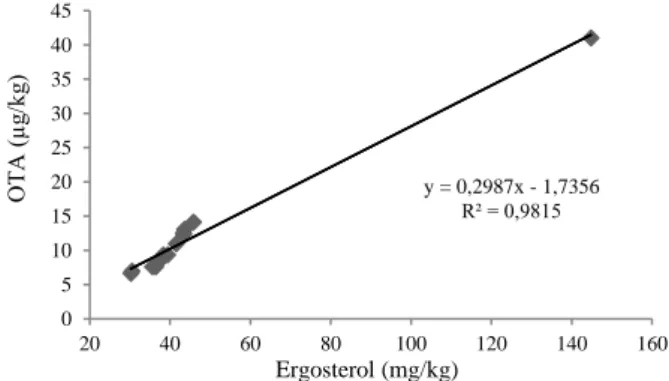
899 On the other hand, ergosterol was significantly
correlated with OTA (r = 0.99, R2 =0.98). The relation
between ergosterol and OTA are shown in Figure 1. Figure 1 indicates linear relation between ergosterol and OTA in cheese samples. Furthermore, ochratoxin and ergosterol production patterns were similar, ergosterol could be used as a more readily measurable indicator of potential ochratoxin production (Saxena et al., 2001). Similarly, several scientists have reported that some mycotoxins were correlated with ergosterol (Kadakal et al., 2005; Ekinci et al., 2014; Yassıhüyük et al., 2014). Ekinci et al. (2014) have stated that the correlation between aflatoxin B1 and
ergosterol content in mouldy hazelnuts was significant (R2=0.85). Likewise, Yassıhüyük et al. (2014) have
reported high correlation between patulin and ergosterol content of homemade red pepper paste (R2=0.96).
Additionally, Kadakal et al. (2005) have investigated high correlation between ergosterol and patulin (R2=0.98) in
apple juices having decay proportion of 30%, 60% and 100%.
Figure 1. The relation between ergosterol and OTA Conclusions
In this study, the relation between ergosterol and mycotoxins which are patulin and OTA in cheeses was investigated for the first time. The data show that there was no patulin content in the cheeses, however, OTA was found similar or high when compared with the limit values of Turkish Food Codex for OTA on wines, roasted coffee and dried vine products (2, 5 and 10 µg/kg) and limit value of EC on wines (2 µg/kg) for OTA. However, neither the Turkish Food Codex nor the EC have established any limit value on OTA for animal products. Additionally, significant correlation between ergosterol and OTA were determined. So, the correlation between ergosterol and OTA concentrations of cheese was examined to determine whether ergosterol and OTA may also be a microbiological quality indicator for cheese varieties or not. On the other hand, ergosterol detection in the samples showed that the cheese had hidden mould, even though there was not visible mould in the cheeses. Allowed amount of ergosterol has been defined in the world only for tomatoes and tomato products as 15 mg/kg. So, there are no limit values established by official authorities on ergosterol in order to make comparisons in cheese samples. Besides, ergosterol amounts of all cheese samples exceeded the allowed amount for tomatoes.
Presence of moulds in foods may have potentially health risk for consumers. Method for determination of ergosterol is quicker, easier and more useful than the methods for determination of mycotoxins such as patulin and OTA. Therefore, determination of ergosterol might be used as an indicator for presence of mould, whether the moulds are visible or not. However, more researches on usage potential of ergosterol determination must be carried out in order to achieve accurate decision.
Highlights
Levels of ergosterol and ochratoxin A detected in the cheeses showed differences. The highest ergosterol and ochratoxin A were obtained from Konya Blue cheese. No patulin was detected in all samples. The correlation between ergosterol and ochratoxin A was investigated and correlation coefficient (r) was found 0.99. Determination of ergosterol might be used as an indicator for presence of mould.
References
Artık N, Cemeroğlu B, Aydar G, Sağlam N. 1995. Aktif kömür kullanılarak elma suyu konsantresinde patulin miktarını azaltma olanakları. Turk J. Agric. For., 19: 259-265. Barone G, Dambrosio A, Storelli A, Busco A, Ioanna F, Quaglia
NC, Giacominelli-Stuffer R, Storelli MM. 2017. Traditional Italian cheeses: trace element levels and estimation of dietary intake. J. Food. Compos. Anal., 66: 205-211.
Battilani P, Pietri A. 2002. OTA in grapes and wine. Eur. J. Plant. Pathol., 108: 639-643.
Bennett JW, Klich M. 2003. Mycotoxins. Clin. Microbiol. Rev., 16: 497-516.
Bocchi M, Ghiretti GP, Sandei L, Spotti E, Leoni C. 1995. Ergosterol production by different types of yeast able to colonize tomatoes. Ind. Conserv., 70: 404-409.
Bradley RL, Arnold E, Barbano DM, Semerad RG, Smith DE, Vines BK. 1992. Chemical and Physical Methods. In: Marshall RT (editors). Standard Methods for The Examination Of Dairy Products. Port City Press, Baltimore, Washington, DC. pp. 433–531. ISBN-10: 0-87553-208X Bullerman LB. 1980. Incidence of mycotoxic molds in domestic
and imported cheeses. J. Food Protect., 2: 47-58.
Cemeroğlu B. 1992. Meyve ve sebze işleme endüstrisinde temel analiz metotları. Biltav Yayınları, Üniversite Kitapları Serisi No: 02-2, Ankara, 381s.
Corrieu G, Perret B, Kakouri A, Pappas D, Samelis J. 2018. Positive effects of sequential air ventilation on cooked hard Graviera cheese ripening in an industrial ripening room. J. Food Eng., 222: 162-168.
Creppy EE. 2002. Update of survey, regulation and toxic effects of mycotoxins in Europe. Toxicol. Lett., 127: 19-28. Dall’Asta C, Lindner JDD, Galaverna G, Dossena A, Neviani E,
Marchelli R. 2008. The occurrence of ochratoxin A in blue cheese. Food Chem., 106: 729-734.
Düsterhöft EM, Engels W, Huppertz T. 2017. Gouda and Related Cheeses. In: McSweeney P, Fox P, Cotter P, Everett D (editors). Cheese, Chemistry, Physics and Microbiology. Elsevier Academic Press. pp. 865-888. ISBN: 978-0-1241-7012-4 (Print)
Ekinci R, Otağ M, Kadakal Ç. 2014. Patulin ergosterol: New quality parameters together with aflatoxins in hazelnuts. Food Chem., 150: 17-21. y = 0,2987x - 1,7356 R² = 0,9815 0 5 10 15 20 25 30 35 40 45 20 40 60 80 100 120 140 160 O T A ( µ g/ kg ) Ergosterol (mg/kg)
900
European Comission (EC). 2006. Regulation (EC) No: 1881/2006, setting maximum levels for certain contaminants in foodstuffs. Official Journal of the European Union, L364. Ghiretti GP, Spotti E, Strina F, Sandei L, Mori G, Attolini G,
Leoni C. 1995. Ergosterol production by different types of moulds able to colonize tomatoes. Ind. Conserv., 70: 3-12. Hymery N, Vasseur V, Coton M, Mounier J, Jany JL, Barbier G,
Coton E. 2014. Filamentous fungi and mycotoxins in cheese: a review. Compr. Rev. Food. Sci. F., 13: 437-456.
IARC. 1993. IARC monographs on the evaluation of the carcinogenic risk of chemicals to humans: Working group on the evaluation of the carcinogenic risk of chemicals to humans. Vol. 35, Lyon, France.
International Dairy Federation (IDF). 1993. Milk, Determination of Nitrogen Content. FIL-IDF 20B. Brussels, Belgium. International Dairy Federation (IDF). 1982. Determination of the
Total Content Cheese and Processed Cheese. IDF Standard 4A. Brussels, Belgium.
Kadakal Ç, Nas S. 2011. Elma ve Elma Ürünlerinde Patulin Miktarını Etkileyen Faktörler. Pamukkale Univ. J. Eng. Sci., 61: 87-96.
Kadakal Ç, Tepe TK. 2019. Is ergosterol a new microbiological quality parameter in foods or not? Food. Rev. Int., 352: 155-165.
Kadakal C, Batu HS, Tepe TK, Sengun P, Otag FB. 2018. Which one may be the best quality parameter of risky foods in terms of mold: Aflatoxins, patulin, ochratoxin A and ergosterol. J. Sci. Pub.: Agric. Food. 6: 159-169.
Kadakal Ç, Nas S, Ekinci R. 2005. Ergosterol as a new quality parameter together with patulin in raw apple juice produced from decayed apples. Food Chem., 90: 95-100.
Kokkonen M, Jestoi M, Rizzo A. 2005. Determination of selected mycotoxins in mould cheeses with liquid chromatography coupled to tandem with mass spectrometry. Food Addit. Contam., 22: 449-456.
Öksüztepe G, Erkan S. 2016. Mikotoksinler ve halk sağlığı açısından önemi. Harran Üniv. Vet. Fak. Derg., 5: 190-195. Pattono D, Grosso A, Stocco PP, Pazzi M, Zeppa G. 2013. Survey of the presence of patulin and ochratoxin A in traditional semi-hard cheeses. Food Control, 33: 54-57.
Porep JU, Walter R, Kortekamp A, Carle R. 2014. Ergosterol as an objective indicator for grape rot and fungal biomass in grapes. Food Control, 37: 77-84.
Quijada NM, Mann E, Wagner M, Rodríguez-Lázaro D, Hernández M, Schmitz-Esser S. 2017. Autochthonous facility-specific microbiota dominates washed-rind Austrian hard cheese surfaces and its production environment. Int. J. Food. Microbiol., 267: 54-61.
Saxena J, Munimbazi C, Bullerman LB. 2001. Relationship of mould count, ergosterol and ochratoxin A production. Int. J. Food. Microbiol., 71(1): 29-34.
Schwadorf K, Muller HM. 1989. Determination of ergosterol in cereals, mixed feed components and mixed feed by liquid chromatography. J. Assoc. Off. Anal. Chem., 72: 457–462. World Health Organization (WHO). 1993. IARC monographs on
the evaluation of carcinogenic risks to humans: some naturally occurring substances: Food items and constituents. Heterocyclic aromatic amines and mycotoxins. Vol. 56. Geneva, Switzerland.
Yassıhüyük N, Kadakal Ç, Otağ M. 2014. Ergosterol and patulin contents of conventional and homemade red peppers and hot red peppers pastes. J. Food Process Technol., 5: 379-384.