EMPIRICAL ANALYSIS OF PRE-PAID AND POST-PAID
MOBILE SUBSCRIPTION IN TURKEY
TÜRKİYE’DE FATURASIZ VE FATURALI MOBİL HAT TERCİHİNİN AMPİRİK ANALİZİ
Murat ÇETİNKAYA
(1), Alparslan A. BAŞARAN
(2),
Necmiddin BAĞDADİOĞLU
(3)(1) Rekabet Kurumu, (2,3) Hacettepe Üniversitesi, İİBF, Maliye Bölümü (1) [email protected], (2)[email protected], (3)[email protected] ABSTRACT: This paper investigates the determinants of pre-paid and post-paid mobile phone subscriptions in Turkey. The binary logit analysis is employed to explore the relationship between the subscribers’ characteristics and their subscription type i.e. pre-paid or post-paid. The data used in the analysis relies on a survey carried out during 2009-Q3. The results indicate that there is a statistically significant relationship between the subscription type choice and the dependent variables. It is found that the choices of the other members living in the respondents’ household have significant effect on the decisions of the subscribers. The results also show that the subscribers who use their phones mainly for mobile calls and for surfing on internet are more likely to have a post-paid subscription while the pre-paid users usually use their phones for short messages and for playing games on their mobile phones.
Keywords: Mobile Communications; Pre-paid/Post-paid Choice; Binary Logit Regression; (Social) Network Effects
JEL Classifications: D12; L96
ÖZET: Bu çalışmada, Türkiye’de mobil telefon aboneliğinde faturalı ve faturasız hat tercihinin belirleyicileri incelenmektedir. Abone karakteristikleri ile abonelik türü (faturasız – faturalı hat) tercihi arasındaki ilişki ikili lojistik regresyon kullanılarak analiz edilmektedir. Analizlerde kullanılan veriler 2009 üçüncü çeyrekte yapılan anket sonucunda elde edilmiştir. Sonuçlar abonelik tercihi ile kullanılan bağımsız değişkenler arasında anlamlı bir ilişki olduğunu göstermektedir. Analizler neticesinde ankete katılan bireylerin tercihleri üzerinde bu bireylerle aynı hanedeki diğer bireylerin tercihlerinin önemli etkileri olduğu bulunmuştur. Ayrıca, bulunan sonuçlar, mobil telefonlarını genellikle konuşma ve internete girmek için kullanan abonelerin faturalı hat tercih etme olasılığının yüksek olduğunu gösterirken, faturasız hat tercih eden abonelerin ise mobil telefonlarını çoğunlukla kısa mesaj gönderme ve mobil telefon oyunları oynamak için kullanmaktadırlar. Anahtar Kelimeler: Mobil İletişim; Faturasız/Faturalı Hat Tercihi; İkili Lojistik Regresyon; (Sosyal) Şebeke Etkileri
1. Introduction
Mobile telecommunications, at least in the near future, seem to remain as the main driver of information and communication technologies (ICT) and in particular
telecommunications industry growth, as a result of the technological developments which open the pave for an expansive usage of mobile broadband that widens the content of the mobile services. According to the Organization for Economic Cooperation and Development (OECD) data, as the total telecommunications revenue increased from USD 147 billions in 1980 to USD 1.150 billions in 2009, it is witnessed that the main portion of this growth stemmed from the increases of the mobile revenue which “reached to USD 527 billion in 2009, from USD 182 billion a decade earlier” (OECD, 2011: 34 & 100). This potential of the mobile industry directed the mobile operators to invest in the more innovative areas of mobile telecommunications such as mobile banking, mobile advertising and other value added services.
On the other hand, competition in the mobile telecommunications is becoming stiffer as a result of market saturation and regulatory issues such as the regulation of interconnection prices and the introduction of mobile number portability. Leaving other telecommunications services aside, this trend in the mobile industry forced the carriers to develop various revenue-raising strategies. One alternative response from the carriers to this challenging environment is to make the pre-paid users switch to post-paid mobile subscription in order to have much more loyal customers with greater average revenue per user (ARPU). However such a marketing strategy needs a proper analysis of the subscriber characteristics and usage behaviour of the consumers to achieve the desired outcome.
Although there is a wide literature on the determinants of mobile operator choice1, research on pre-paid / post-paid subscription choice (hereinafter “subscription type choice”) is fewer. Usually studies on pre-paid and post-paid choices concentrate on the loyalty of (existing) subscribers. For instance Lee et al. (2006) evaluate the attitudinal and behavioural loyalty of pre-paid and post-paid subscribers using data from a modest sample. In another paper, Lee and Murphy (2006) study the consumption of mobile services among Australian youth. Considering the youth being an important segment of the mobile subscribers, Lee and Murphy (2006) qualitatively evaluate the results of the interviews. While there is no in-depth empirical analysis on the pre-paid and post-paid subscription decisions of the Australian students in the study, a point that Lee and Murphy (2006) mention on the choice and usage behaviour draws notice. Lee and Murphy (2006) note that, respondents’ closers have influence on both their mobile provider choice and mobile services usage. Again regarding loyalty, a report prepared by Amdocs (2009) searches for the ways to create much more loyal pre-paid subscribers, considering the limited marketing resources because of the low-spending customer types of pre-paid users in most of the mobile markets.
Regarding Turkish mobile market relying on the results of an interview on university students, Aydın (2004) finds a significant relationship between the subscription type choice and the respondent’s income level. Using the data from a
1 For reviews of network effects see Farrell and Klemperer (2007), Birke (2009), Shy (2011),
survey covering the university students’ choices, Özer et al. (2006) explore the determinants of pre-paid and post-paid subscription decisions of the students. The results of the logit analysis indicate that as the mobile expenditure increases the probability to subscribe a post-paid package increases and as the number of students in a household increases the probability to subscribe a pre-paid package increases. In another study by the same authors which also uses the data from a survey carried out on the graduate students, a significant relationship is found among the subscription type and the factors such as faculty, year of the education, age, gender, lodging type, education level of the head of the family and the capita living in the household (Oktay et al., 2006). Karaçuka et al. (2011) conclude that pre-paid users are more sensitive to mobile prices in contrast to the post-paid users. Akın (2011) attempts to determine the factors affecting the subscription type, using the data obtained from a survey administered to a group of undergraduate students. Developing a neural network Akın (2011) compares the classification methods using the gender, mother’s education, family monthly income, student’s monthly income and lodging type as independent variables and shows that a multi-layer perceptron type feed forward neural network model outperforms other approaches.
According to the theory of network effects, the utility of joining to a network increases as the number of total users of that network increases. Various studies on the subscription decisions of the mobile users empirically analyse network effects. More recent papers also demonstrate that besides the industry wide or operator level network effects, consumers consider the choices of their closers/peers (social network effects) while they choose their mobile service providers as well. It is also shown that social network effects have much more influence on the subscribers’ decisions compared to the overall network effects.2
In this respect the aim of this paper is to empirically explore the determinants of the subscription type choices. The paper differs from its antecedents in the sense that it uses data gained from a nation-wide survey which represents the urban population of Turkey. This is important since the choice determinants of the students may not exactly stand for the subscription pattern of the mobile users as a whole. Therefore it will not be wrong to assert that the results of this study may have a greater significance in determining the factors affecting the decisions of the mobile subscribers. Another contribution of this research is that it allows for the effect of the subscription type of the other household members on the pre-paid or post-paid choice decisions of the respondents. Although social network effects was previously analysed in the literature regarding the mobile operator choice, to the best knowledge of the authors, this paper is the first to consider this effect empirically in the context of subscription type choice. In this regard, to examine the determinants of subscription type choice, the paper uses binary logit model as the econometric method, allowing personal and household characteristics of the respondents and the respondents’ usage pattern as independent variables.
2 See Birke and Swann (2006), Corrocher and Zirulia (2009), Maicas et al. (2009) and
The paper is organized as follows: Section 2 summarizes the trends and the structure of the Turkish mobile market focusing on the pre-paid and post-paid usage. Section 3 introduces the model, the data, descriptive statistics and the empirical results. Finally Section 4 concludes with some brief discussions.
2. The Main Trends and The Structure of the Turkish Mobile
Telecommunications Market
Second generation mobile telecommunication services were introduced in Turkey in 1994. Three periods, with regard to the number of operators, were witnessed: duopoly, quadropoly and triopoly periods among the years 1994-2001, 2001-2004 and post 2004, respectively. According to the data of Information Technologies and Communications Authority (ITCA, 2011), as of the end of 2011, the total mobile installed base amounted to more than 65 million subscribers while the penetration rate reached to 88.6% of the total population. Graph 1 depicts the evolution of the number of mobile subscribers between 2003 and 2011 (trioploy period) and the total mobile subscribers. As it is clear from Graph 1, the incumbent Turkcell is the leading operator in Turkey holding more than 34 million subscribers while Avea, the latecomer, is a close follower of the second incumbent Vodafone.
Graph 1. Total mobile subscribers and operators’ installed base (million)
Source: Data is gained from Atiyas and Doğan (2007), ITCA (2009; 2011).
ITCA is the regulatory body responsible for the regulation of the telecommunications industry. Turkey is on the way to fully transform the EU legislation regarding the regulation of the telecommunications industry. The most recent and important regulation of the ITCA is mobile number portability (MNP) which was introduced in the last quarter of 2008. Since then, as for May 22 of 2011, more than 43 million subscribers ported their numbers.3
Pre-paid mobile tariffs were introduced in 1999. For now all three operators Avea, Turkcell and Vodafone have both various pre-paid and post-paid tariffs/packages. Graph 2 shows the development of the pre-paid and post-paid subscribers between
3 See Atiyas and Doğan (2007), Bagdadioglu and Cetinkaya (2010) and Karacuka (2011) for
an overview of the Turkish mobile market.
0 10 20 30 40 50 60 70 0 10 20 30 40 2003 2004 2005 2006 2007 2008 2009 2010 2011 To tal in stalled b ase Num ber of subscribers
2001 and 2011. As it is clear from Graph 2, the ratio of the post-paid subscriptions started to increase in recent years. Although as of the end of 2011 post-paid subscribers constitute just 35% of the total mobile users, it could be asserted that recent trends in support of the share of the post-paid subscription may continue to increase as a result of the rigorous marketing strategy of the operators in favour of the post-paid subscription as mentioned earlier.
Graph 2. Evolution of pre-paid and post paid subscription (%)
Source: Data is gained from Darıcı (2002), ITAA (2008; 2009; 2011)
3. Empirical Analysis
3.1. The model
Since the mobile phone subscribers face with two alternative choices (pre-paid and post-paid plans) in their subscription decisions regarding the subscription type, a binary logit model is a useful tool to analyse their decisions. In binary logit models the estimation is done by maximum likelihood (ML) method. In analysing the determinants of a choice decision, the researcher faces with observable and unobservable variables. Thus, the utility to a decision maker of choosing one of the alternatives can be divided into two components:
ij ij ij V
U = +ε (1)
where i indicates the decision maker, j shows the chosen alternative, V is the ij observed part of the utility and εij is the unobserved random term. In this setting, assuming that ε is distributed logistically with Var
( )
ε =π2/3 leads to the binary logit model which can be formulated as follows for a single independent variable (Long and Freese, 2001: 101):) exp( 1 ) exp( ) | 1 Pr( x x x y β α β α + + + = = (2) 0% 20% 40% 60% 80% 100% 2001 2002 2003 2004 2005 2006 2007 2008 2009 2010 2011 post-paid pre-paid
In this paper, more than one independent variables are used under two different models. In the first model subscriber’s demographic characteristics and his/her family features are used as regressors, while in the second model the independent variables consist of the usage behaviour. Socioeconomic variables used in Model 1 are gender, age, marital status, education level, monthly mobile expenditure level, household size, employment status and whether the respondent has multiple subscriptions (respectively GENDER, AGE, MARITAL, EDUC, EXP, HHNO, ACTINLF and MULTI), and the variable indicating household usage is the number of post-paid subscribers in the household (HOUSEPOST). Equation 3 shows Model 1 which was estimated employing a binary logit analysis.
+ + + + + + + + + = = MULTI ACTINLF HHNO HOUSEPOST EXP EDUC MARITAL AGE GENDER F postpaid choice MULTI ACTINLF HHNO HOUSEPOST EXP EDUC MARITAL AGE GENDER β β β β β β β β β α0 ) Pr( (3)
In Model 2 the independent variables comprise the usage behaviours of the subscribers. In the interviews the respondents are asked to specify the frequency (from 1 to 5 never to always respectively) that they use their mobile phones for the purposes of mobile calls, sending short messages, listening to music, taking photos, playing games and web browsing (CALL, SMS, MUSIC, PHOTO, GAME and INTERNET respectively). Equation 4 depicts the Model 2 that was estimated using these variables. + + + + + + = = INTERNET GAME PHOTO MUSIC SMS CALL F postpaid choice INTERNET GAME PHOTO MUSIC SMS CALL β β β β β β α0 ) Pr( (4) 3.2. Data
The data for the logistic analysis was collected from a nation-wide survey, which was conducted by the local branch of an international market research company in 2009.4 The face-to-face interviews were carried out in 16 large cities that represent the socio-economic and demographic characteristics of the urban population in Turkey. After excluding the respondents who are not a subscriber of any mobile carriers and who did not reveal their expenditure levels among the 1303 interviews, the sample size equals to 1079.
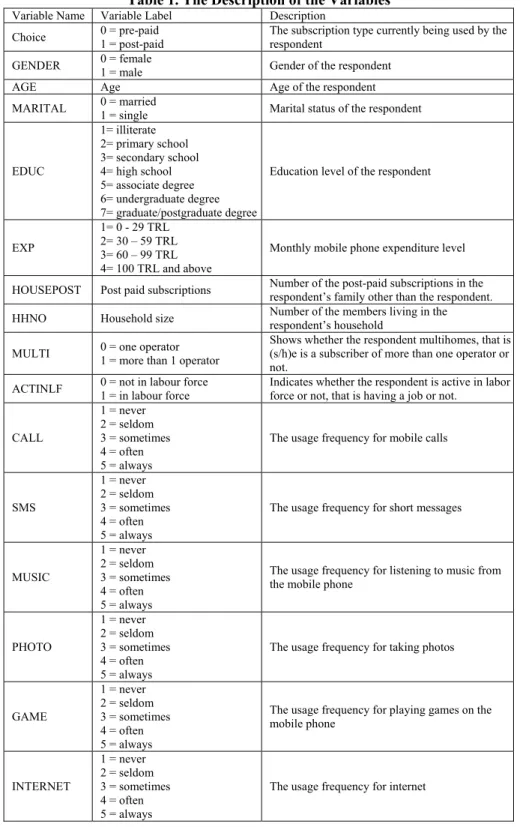
The data comprises the subscription types of both the respondents and the people living in the same house with the respondents, as well as the demographic characteristics and the usage behaviours of the respondents. The descriptions of the variables which used in Model 1 and Model 2 illustrated respectively in Equation 3 and Equation 4 are displayed in Table 1.
Table 1. The Description of the Variables
Variable Name Variable Label Description
Choice 0 = pre-paid 1 = post-paid The subscription type currently being used by the respondent
GENDER 0 = female 1 = male Gender of the respondent
AGE Age Age of the respondent
MARITAL 0 = married 1 = single Marital status of the respondent
EDUC 1= illiterate 2= primary school 3= secondary school 4= high school 5= associate degree 6= undergraduate degree 7= graduate/postgraduate degree
Education level of the respondent
EXP
1= 0 - 29 TRL 2= 30 – 59 TRL 3= 60 – 99 TRL 4= 100 TRL and above
Monthly mobile phone expenditure level HOUSEPOST Post paid subscriptions Number of the post-paid subscriptions in the respondent’s family other than the respondent. HHNO Household size Number of the members living in the respondent’s household MULTI 0 = one operator 1 = more than 1 operator
Shows whether the respondent multihomes, that is (s/h)e is a subscriber of more than one operator or not.
ACTINLF 0 = not in labour force 1 = in labour force Indicates whether the respondent is active in labor force or not, that is having a job or not.
CALL 1 = never 2 = seldom 3 = sometimes 4 = often 5 = always
The usage frequency for mobile calls
SMS 1 = never 2 = seldom 3 = sometimes 4 = often 5 = always
The usage frequency for short messages
MUSIC 1 = never 2 = seldom 3 = sometimes 4 = often 5 = always
The usage frequency for listening to music from the mobile phone
PHOTO 1 = never 2 = seldom 3 = sometimes 4 = often 5 = always
The usage frequency for taking photos
GAME 1 = never 2 = seldom 3 = sometimes 4 = often 5 = always
The usage frequency for playing games on the mobile phone INTERNET 1 = never 2 = seldom 3 = sometimes 4 = often 5 = always
3.3. Descriptive statistics
Empirical part of the study includes two different analyses. First all, subscription type choice is regressed by respondents’ characteristics and her/his family features (Model 1). In the second part the relationship between the same binary dependent variable and the usage behaviour is explored (Model 2). Table 2 and Table 3 exhibit the descriptive statistics for the variables (frequencies for discrete variables and means for continuous variables) used in the two models.
Table 2. Descriptive Statistics for Model 1
Variable Obs. Frequency
0 1 2 3 4 5 6 7 8 Choice 1079 915 164 - - - - GENDER 1079 522 557 - - - - MARITAL 1079 511 568 - - - - EDUC 1079 - - 389 255 300 28 101 6 - EXP 1079 - 737 230 52 60 - - - - HOUSEPOST 1079 168 353 283 186 69 13 4 - 3 HHNO 1079 - 25 101 246 351 216 140 - - ACTINLF 1079 697 382 - - - - MULTI 1079 1037 42 - - - -
Mean Min. Max.
AGE 1079 32.5 15 77
According to the summary statistics depicted in Table 2, it is clear that most of the respondents use pre-paid mobile tariffs. This is analogous with the pre-paid/post-paid subscription profile of the Turkish mobile market as introduced in the preceding section. On the other hand while the respondents are usually males and mainly single, on average mobile phone users are youths and adults. The descriptions of other variables are straightforward.
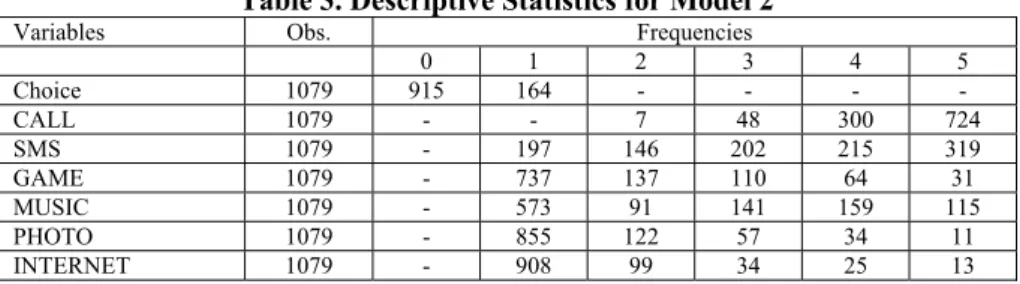
Table 3 shows the summary information for Model 2 where the independent variables represent the mobile phone usage of the subscribers. As shown in Table 3, mobile call and short message services are the main motives of the respondents to use a mobile phone. It is also clear that mobile phone users, to a slighter extent, also use their phones as a portable music player.
Table 3. Descriptive Statistics for Model 2
Variables Obs. Frequencies
0 1 2 3 4 5 Choice 1079 915 164 - - - - CALL 1079 - - 7 48 300 724 SMS 1079 - 197 146 202 215 319 GAME 1079 - 737 137 110 64 31 MUSIC 1079 - 573 91 141 159 115 PHOTO 1079 - 855 122 57 34 11 INTERNET 1079 - 908 99 34 25 13 3.4. Empirical Results
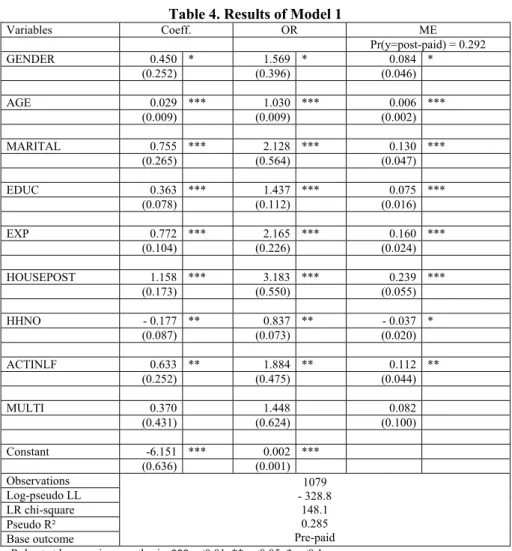
The regression results are presented in Table 4 for Model 1 in which the relationship between the subscription type choice and the individual specific variables is explored. All of the variables except from MULTI are statistically significant. Since the coefficients of a logistic regression are not directly interpretable, Table 4 also includes odds ratios and marginal effects at the specified levels.
Table 4. Results of Model 1 Variables Coeff. OR ME Pr(y=post-paid) = 0.292 GENDER 0.450 * 1.569 * 0.084 * (0.252) (0.396) (0.046) AGE 0.029 *** 1.030 *** 0.006 *** (0.009) (0.009) (0.002) MARITAL 0.755 *** 2.128 *** 0.130 *** (0.265) (0.564) (0.047) EDUC 0.363 *** 1.437 *** 0.075 *** (0.078) (0.112) (0.016) EXP 0.772 *** 2.165 *** 0.160 *** (0.104) (0.226) (0.024) HOUSEPOST 1.158 *** 3.183 *** 0.239 *** (0.173) (0.550) (0.055) HHNO - 0.177 ** 0.837 ** - 0.037 * (0.087) (0.073) (0.020) ACTINLF 0.633 ** 1.884 ** 0.112 ** (0.252) (0.475) (0.044) MULTI 0.370 1.448 0.082 (0.431) (0.624) (0.100) Constant -6.151 *** 0.002 *** (0.636) (0.001) Observations 1079 - 328.8 148.1 0.285 Pre-paid Log-pseudo LL LR chi-square Pseudo R² Base outcome
- Robust std. errors in parenthesis. *** p<0.01, ** p<0.05, * p<0.1
- Reference values for MEs are GENDER=1, AGE=32, MARITAL=1, EDUC=3, EXP=1,
HOUSEPOST=1, HHNO=3, ACTINLF=1 and MULTI =0.
The results shown in Table 4 indicate that the probability to use a post-paid mobile tariff increases as age and monthly mobile expenditure increases. While the probability of males to choose a post-paid tariff package is greater than females (the odds ratio for GENDER is 1.569), it is also explored that singles are more likely to use post-paid tariffs compared to the married respondents (the odds ratio for MARITAL is 2.128). In addition, a degree of education positively affects the probability of being a post-paid subscriber (the marginal effects of EDUC is 0.075), while subscribing to more than one mobile operator at the same time (multihoming) does not have statistically significant effects on subscription type choice. On the other hand as the household size gets larger, the probability to choose pre-paid subscription increases (the coefficient of HHNO is negative). And the positive coefficient for ACTINLF indicates that the respondents who are employed (i.e. in labour force) are more likely to choose a post-paid tariff plan. More interestingly the subscription types of the members of the respondents’ household have highly considerable effects on the choices of respondents. It is highly significant that the number of post-paid users in the household positively effects respondents’ post-paid
subscription decisions (the marginal effects of HOUSEPOST is 0.239). This result indicates that mobile users not only coordinate their mobile carrier choices with their (close) social networks as explored in the previous literature on (social) network effects, but also take into account their closers’ subscription types.
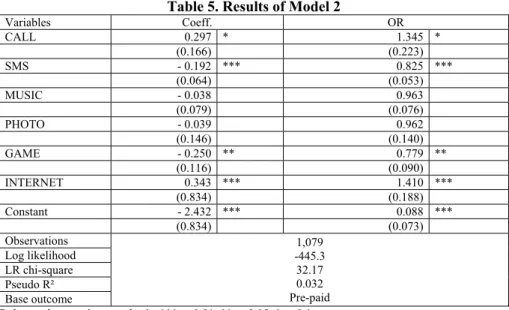
After exploring the relationship between the subscription type and individual characteristics, Table 5 exhibits the results of the second analysis which comprises the relationship between the subscribers’ choices and their usage behaviours concerning mobile calls, short message service, mobile phone games, listening to music, taking photos and internet usage. The independent variables in the second regression show the frequency levels stated by the respondents.
Table 5 demonstrates both the coefficients and odds ratios of the logistic regression. Supporting the conventional perceptions, the positive coefficients for the variables CALL and INTERNET indicate that as the mobile phone subscribers use more frequently their phones for mobile calls and web browsing, the probability to be a post-paid subscriber increases. In contrast, when the mobile phone subscribers mainly use their phones for sending short messages and playing mobile games, the probability of choosing a pre-paid mobile tariff increases.
Table 5. Results of Model 2
Variables Coeff. OR CALL 0.297 * 1.345 * (0.166) (0.223) SMS - 0.192 *** 0.825 *** (0.064) (0.053) MUSIC - 0.038 0.963 (0.079) (0.076) PHOTO - 0.039 0.962 (0.146) (0.140) GAME - 0.250 ** 0.779 ** (0.116) (0.090) INTERNET 0.343 *** 1.410 *** (0.834) (0.188) Constant - 2.432 *** 0.088 *** (0.834) (0.073) Observations 1,079 -445.3 32.17 0.032 Pre-paid Log likelihood LR chi-square Pseudo R² Base outcome
Robust std. errors in parenthesis. *** p<0.01, ** p<0.05, * p<0.1
4. Discussion and Conclusion
Since the revenue gained from post-paid subscribers is still higher than the revenue gained from pre-paid subscribers (ITCA, 2012), carriers active in the Turkish mobile market have a strong incentive to push their pre-paid installed base to switch to post-paid services. As mentioned earlier, tough competitive conditions in the market and strict regulatory environment as well as increasing penetration levels whip up the operators to follow such a marketing strategy. Analysing the socio-demographic and usage characteristics of current pre-paid and post-paid subscribers may lead to helpful outcomes for both operators and regulators.
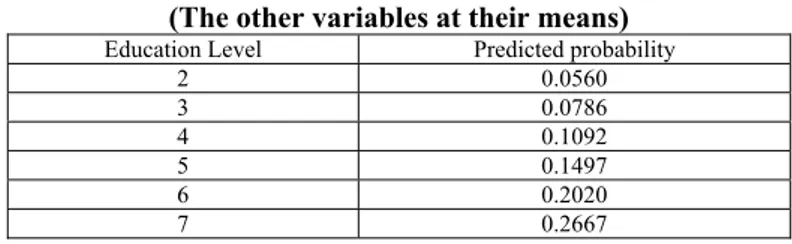
In this respect, empirical results of this paper suggest that operators need to mind the demographic characteristics such as age, gender, marital status and education levels, and expenditure and usage profiles of their subscribers. Although the overall results are demonstrated in the previous section, an in-depth examination of subgroups under each variable may present more perceptible indications. Thus operators may take the advantage of focusing on ideal types of target groups in order to make them churn to post-paid plans. As an example, while 15% of the overall sample is post-paid users, this ratio increases to 39% when the university graduates are considered. Predicted probabilities by education levels depicted in Table 6 indicate that higher graduation levels have higher predicted probabilities of post-paid subscription type choice.
Table 6. Predicted Probabilities by Education Levels (The other variables at their means)
Education Level Predicted probability
2 0.0560 3 0.0786 4 0.1092 5 0.1497 6 0.2020 7 0.2667
On the other hand, the most important contribution of this research is on the effects of household members’ choices (social network effects) on subscription type choice. As demonstrated in Table 5, post-paid subscribers in the respondents’ household have the highest marginal effect on the respondents’ choice probability. This result indicates that subscribers either simultaneously or sequentially coordinate their subscription type choice with their peers. In this sense, the results point that, it may be a rational strategy for a mobile carrier to check the calling patterns of its existing subscribers as a focal point and develop pre-paid to post-paid churn strategies based on this information. Since the operators have the data for the realistic topology and calling patterns of their existing subscribers and the demographic features of these subscribers, grounding churn strategies on the information gained from the analyses of this actual data may lead to more fruitful outcomes. Thus using this information, operators may exploit social network effects in order to increase post-paid subscriber base.
Lastly, it is worth mentioning that enhancing post-paid users not only benefits the mobile carriers but also benefits the governments, in the sense that the more post-paid subscribers lead to more ARPU and more ARPU lead to more tax revenue from mobile phone usage.
5. References
AKIN, M. (2011). Predicting preferences of university students for pre-paid vs post-paid cell phone service plans. Expert Systems with Applications, 38 (8), pp. 9207-9210.
AMDOCS (2009). Pre-paid loyalty: fact or fiction? [Available at]: <http://www.amdocs.com/ documents/Amdocs_Pre-paid_Loyalty.pdf> [Date accessed: 12.05.2012].
ATİYAS, I., DOĞAN, P. (2007). When good intentions are not enough: sequential entry and competition in the Turkish mobile industry. Telecommunications Policy, 31 (8-9), pp. 502-523.
AYDIN, K. (2004). Üniversite öğrencilerinin cep telefonu kullanımı ve GSM operatörü tercihleri üzerine bir çalışma. Süleyman Demirel Üniversitesi İİBF Dergisi, 9 (1), pp. 149-164.
BAGDADIOGLU, N., CETINKAYA, M. (2010). Sequencing in telecommunications reform: a review of the Turkish case. Telecommunications Policy, 34 (11), pp. 726-735.
BASARAN, A. A., CETINKAYA, M., BAGDADIOGLU, N. (2014). Operator choice in the mobile telecommunications market: Evidence from Turkish urban population.
Telecommunications Policy, 38 (1), pp. 1-13.
BIRKE, D. (2009). The economics of networks: a survey of the empirical literature. Journal of
Economic Surveys, 23 (4), pp. 762-793.
BIRKE, D., SWANN, G. M. P. (2006). Network effects and the choice of mobile phone operator. Journal of Evolutionary Economics, 16 (1-2), pp. 65-84.
CORROCHER, N., ZIRULIA, L. (2009). Me and you and everyone we know: An empirical analysis of local network effects in mobile communications. Telecommunications Policy, 33 (1-2), pp. 68-79.
DARICI, A. (2002). 3. nesil mobil haberleşme sistemleri, [Available at]: <http://www.tk.gov.tr/kutuphane_ve_veribankasi/raporlar/arastirma_raporlari/dosyalar/3G_ Raporu_Aralik_2002.PDF>, [Date accessed: 12.05.2012].
FARRELL, J., KLEMPERER, P. (2007). Coordination and lock-in: competition with switching costs and network effects. In M. Armstrong, R. Porter (ed.), Handbook of Industrial
Organization, North Holland-Elsevier BV., Netherlands, pp. 1967-2072.
ITCA (2008). Developments and trends in the Turkish telecommunications industry – 2007 report. [Available at]: <http://www.tk.gov.tr/kutuphane_ve_veribankasi/raporlar/ arastirma _raporlari/dosyalar/3D_2008_Rapor.pdf>, [Date accessed: 15.05.2012].
ITCA (2009). Turkish electronic communications industry quarterly market data, 2009-Q4. [Available at]: <http://www.btk.gov.tr/kutuphane_ve_veribankasi/pazar_verileri/ ucaylik09 _4.version2.pdf>, [Date accessed: 15.05.2012].
ITCA (2011). Turkish electronic communications industry quarterly market data, 2011-Q4. [Available at]: <http://www.btk.gov.tr/kutuphane_ve_veribankasi/pazar_verileri/ ucaylik11_4.pdf>, [Date accessed: 15 May 2012).
ITCA (2012). Turkish electronic communications industry quarterly market data, 2012-Q3. [Available at]: <http://www.btk.gov.tr/kutuphane_ve_veribankasi/pazar_verileri/ ucaylik12 _3.pdf>, [Date accessed: 12.12.2012].
KARACUKA, M., HAUCAP, J., HEIMESHOFF, U. (2011). Competition in Turkish mobile telecommunications markets: price elasticities and network substitution.
Telecommunications Policy, 35 (2), pp. 202-210.
LEE, R., MURPHY, J. (2006). The consumption of mobile services by Australian university students. International Journal of Mobile Marketing, 1 (1), pp. 13-20.
LEE, R., MURPHY, J., DICKINGER, A. (2006). Investigating the loyalty of pre-paid and post-paid mobile customer. International Conference on Business and Information (BAI), 12–14 July, Singapore. [Available at]: <http://www.docin.com/p-396416659.html>, [Date accessed: 26.05.2013].
LONG, J. S., FREESE, J. (2001). Regression models for categorical dependent variables using
STATA. USA: Stata Corporation,
MAICAS, J. P., POLO, Y., SESE, F. J. (2009). The role of (personal) network effects and switching costs in determining mobile users’ choice. Journal of Information Technology, 24 (2), pp. 160-171.
MAICAS, J. P., SESE, F. J. (2011). Network effects in the mobile communications industry: an overview. In J. P. MAICAS (ed.), Recent Developments in the Mobile Communications
Industry: A Multidisciplinary Approach. Crotia: InTech, pp. 131-140.
OECD (2011). OECD Communications Outlook 2011, OECD Publishing.
OKTAY, E., ÖZER, H., ÖZÇOMAK, M. S. (2006). Atatürk Üniversitesi öğrencilerinin cep telefonu abonelik türünü tercih etmeleriyle ilgili faktörlerin tespiti. EKEV Akademi Dergisi, 10 (27), pp. 275-296.
ÖZER, H., ÖZÇOMAK, M. S., OKTAY, E. (2006). Üniversite öğrencilerinin cep telefonu hat tercih olasılığının belirlenmesi: Atatürk Üniversitesi örneği. Gazi Üniversitesi İİBF Dergisi, 7 (2), pp. 39-52.
SHY, O. (2011). A short survey of network economics. Review of Industrial Organization, 38 (2), pp. 119-149.