THE RELATIONSHIP BETWEEN COST LEADERSHIP STRATEGY, TOTAL QUALITY MANAGEMENT APPLICATIONS AND FINANCIAL
PERFORMANCE
MALİYET LİDERLİĞİ STRATEJİSİ, TOPLAM KALİTE YÖNETİMİ UYGULAMALARI VE FİNANSAL PERFORMANS İLİŞKİSİ
Ali KURT
(1), Cemal ZEHİR
(2) (1) Fatih Sultan Mehmet Vakif University(2) Yıldız Technical University, FEAS, Business Administration (1) [email protected], (2) [email protected] Geliş/Received: 19-11-2015, Kabul/Accepted: 07-01-2016
ABSTRACT: Firms need to implement some competition strategies and total
quality management applications to overcome the fierce competition among others. The purpose of this study is to show the relationship between cost leadership strategy, total quality management applications and firms’ financial performance with literature review and empirical analysis. 449 questionnaires were conducted to the managers of 142 big firms. The data gathered was assessed with AMOS. As a result, the relationship between cost leadership strategy, total quality management applications and firms’ financial performance has been gathered. In addition, the relationship between TQM applications and financial performance has also been gathered.
Keywords: Cost Leadership Strategy, Total Quality Management Applications,
Financial Performance, Competition Strategies
JEL Classification: M10
ÖZ: İşletmeler rekabetin üstesinden gelebilmek için bazı rekabet stratejileri ve
toplam kalite yönetimi prensiplerini uygulama gereği duyarlar. Bu çalışmanın amacı maliyet liderliği stratejisi, toplam kalite yönetimi uygulamaları ve finansal perfromans arasındaki ilişkiyi literatür çalışması ve ampirik analizle göstermektir. 142 büyük işletmenin 449 yöneticisine anket uygulandı. Toplanan bilgi AMOS ile değerlendirildi. Sonuç olarak, maliyet liderliği stratejisi, toplam kalite yönetimi uygulamaları ve finansal performans arasındaki ilişki ortaya kondu. Bununla birlikte TKY uygulamaları ve finansal performans arasındaki ilişki de değerlendirildi.
Anahtar Kelimeler: Maliyet Liderliği Stratejisi, Toplam Kalite Yönetimi
Uygulamaları, Finansal Performans, Rekabet Stratejileri
1. Introduction
Generally, quality is defined as the degree of a firm’s meeting the customer needs (Kehoe, 1996: 3). Total quality management (TQM) is a systematic quality improvement approach for firm-wide management for the purpose of improving performance in terms of quality, productivity, customer satisfaction, and profitability.
TQM is an integrated management philosophy and set of practices that emphasizes, among other things, continuous improvement, meeting customers’ requirements, reducing rework, long range thinking, increased employee involvement and teamwork, process design, competitive benchmarking, team
based problem solving, constant measurement of results and closer relationships with suppliers (Powell, 1995: 16). There isn’t a consensus on “what the real elements of TQM are. In our study, we discuss “leadership of the management, decision making process, process approach, continuous improvement approach, participation of workers, relationships with the suppliers, customer orientation and education” as the applications of Total Quality Management.
Although there have been many studies conducted to show the relationship between TQM and performance of a firm, some have failed but some have succeeded. Some elements of TQM have positively effected the financial and innovative performance of the firm. Although, in some studies, the total of TQM principles and elements have positive effect on performance, when we closely study the results for each element, the results may be surprising and may not support the general idea that TQM positively effects the firm performance. So, a detailed and a new study should be conducted to get the results as a whole and separately.
Competition is competing for the same resources and customer groups (Ünlücan, 2004: 28). Porter (1998: 33) defines competition as doing many different things from the competitors. Extensive discussions on strategic management literature suggest that sustainable performance results from the sustainable competitive advantage (Hoffman, 2000: 5). Theoretically, competitive advantage is defined as creating superior added value. A firm with a competitive advantage has added value and therefore the potential for profit (Ghemawat & Rivkin, 2006: 4).
Strategy is a plan of action that channels an organization’s resources so that it can effectively differentiate itself from competitors and accomplish unique and viable goals (Çavuşgil, Knight & Riesenberger, 2008: 312). According to Day & Wensley (1988: 2), strategy while slowing the process of decreasing the advantages at hand is searching new horizons. Strategy is essentially is the result of a strategic planning process and should directly be in connection with the goals of the businesses. The aim of the strategy is to overcome the competitors and get high performance.
There are two main approaches trying to explain the performance differences among the firms in the same industry. Positioning theory deals with analysis of the external environment of business as the starting point of the corporate strategy. It analyzes the firm’s position on the market and makes such strategic plans to exploit the opportunities on markets. Porter’s (1985: 11) works have an important place in the Positioning School, which sees the fundamental role of strategy as positioning the firm for the future. His premise is that some industries are intrinsically more attractive than others. Thus, a business should have access to the possible strategic positions in the market and select the most efficient one among these positions. Followers of the positioning theory suggest that analyzing of external environment should result in decision about which was the advantageous position in market.
Resource Based View (Barney, 1991: 100) advocates a contrary view to acquire strategically advantageous position. This theory deals with the resource base of the business itself as a starting point. RBV theorists argued that firms need to
achieve competitive advantage to give response to ever-changing market conditions through strategically deploying resources and capabilities within the firm and adding new capabilities to existing ones (Acar & Zehir, 2010: 690). Consequently, if the organizations or strategic business units (SBU) are able to deploy their resources and capabilities strategically, they will convert competitive struggle to their own interests in the best way and create a sustainable competitive advantage.
While making their strategic decisions, executives, in practice, take both of them into account at the same time. But in this study our aim is to make analysis of Porterian cost leadership strategy’s effect to firm’s financial performance directly and TQM applications to firm’s financial performance and with the mediator role of cost leadership strategy. To achieve this purpose, we created a research model to test the effects of TQM applications and cost leadership strategy to financial performance.
2. Theoretical Background 2.1. Competition Strategies
There are two main approaches that try to explain the performance differences among the firms in the same industry. These two approaches, which are considered as contrary to each other, are strategically based on competitive position and resource- based view (RBV). Traditionally strategy has taken greater notice of the external environment and hence put more emphasis on external analysis. Positioning theory deals with analysis of the external environment of business as the starting point of the corporate strategy. It analyzes the firm’s position on the market and makes such strategic plans to exploit the opportunities on markets (Acar & Zehir, 2010: 689).
Business resources include all values, skills, organizational processes and knowledge controlled by a company and enable strategies to increase effectiveness and productivity in the business (Daft, 1983: 539). In traditional strategic analysis language, business resources are the powers of the firm to grasp and implement its strategies. Many scholars have found out approaches that enable firms to plan and implement strategies creating value (Barney & Hesterly, 2001: 220). Business resources divide into three categories: Physical resources, human resources and organizational resources. Literature says that business capabilities differ in resources and it is the main competitive power to create effective resources and capabilities for the business (Teece, Pisano, & Shuen, 1997: 515). Firms should develop new capabilities to sustain especially in times of crisis (Acar & Zehir, 2010: 705). As a result, resource based approach can be defined as important knowledge and competency important strategically to manage the actions and assets of the firm effectively.
2.1.1. Generic Business Strategies
According to Porter (1985: 13), the key of competitive advantage is the ability to set the position of the business against the competition in the market. There have been many researches on competition and competitive advantage and many different views about them. As the conditions of the competition have changed, the literature has also changed. Companies achieve competitive advantage either by having the lowest product cost or by having products, which are different in
ways which are valued by customers. Porter (1990: 5) defined these strategic choices namely as cost leadership strategy and differentiation strategy. Parallel to this view, Mintzberg (1988: 82) discussed focusing strategy defines the size of the market share, but Porter’s other two strategies reflect how a firm competes in the market area.
According to positioning school, the base of competitive advantage is the competition outside and this approach sees the root of the competitive advantage as linking the firm to its environment. (McKiernan, 1997: 793).
Leading researcher of the positioning school, Porter (1990: 4) has determined which activities a business should do, how they will shape these activities and how they correlate each other at the same time. Thus, first mentioned by Porter (1985: 13), the concept of value chain is the process in which a business carry out its activities by using less cost than its competitors and if it creates more value than it is required to create it, it will give competitive advantage to the firm. According to Porter (1985: 15), the key to competitive advantage was the ability to position the company against the industry competition. The firm’s competitive position in the industry and its strategy are determined by five forces of competitiveness. These are the threat of new entrants, the threat of substitutes, the bargaining power of buyers, the bargaining power of suppliers, and the degree of rivalry among existing competitors within the industry. A firm may pursue superior performance after careful consideration of these market forces with the goal of either selecting an attractive industry or developing a strong competitive position within an industry (Acar & Zehir, 2010: 691).
Cost leadership
Cost leadership strategy is expressed as cost advantage reflecting selling the goods and services at a lower cost than competitors in terms of design and production (Wheelen & Hunger, 2002: 120). Cost leadership strategy aims to gain competitive advantage by reducing the costs of R&D, service, sales and marketing activities (Rugman & Hodgetts, 2000: 135). Companies can get competitive advantage in scale of economics by using effective systems to reduce the cost of human resources and minimizing the costs with cheaper raw material, mass production and distribution (Eraslan, 2008: 77). Cost leadership provides competitive advantage in the markets in which the consumers are sensitive to the prices. Firms conducting this strategy aim to reduce all cost in the value chain (Thompson & Strictland, 1996: 228).
The basic principle is to reduce the costs of all actions. By this way, the gap between the prices at the market and costs will be longer and a firm will get a competitive advantage by gaining a high income and profit.
The strategic logic of cost leadership usually requires that a firm be the cost leader, not one of the several firms vying for this position. Many firms have made strategic errors by failing to recognize this. When there is more than one aspiring cost leader, rivalry among them is usually fierce because every point of market share is viewed as crucial (Porter, 1985: 21).
Differentiation
Second generic business strategy is differentiation. In this strategy, a firm aims to be unique in its sector with some characteristics valued by most buyers. It chooses one or more specific characteristics and it positions itself to meet these needs. In the situations where standard goods and services don’t meet customer needs, firms have to find different solutions to customers’ specific needs. This is another way to compete in the market. The basic principle of the differentiation strategy is channeling the customer choices to its goods and services by doing different things from every rival does (Bal, 2011: 81). Approaches for differentiation can be composed of elements such as brand name, technology, customer services, sales network and other dimensions. The ideal approach is firm’s differentiating itself in several dimensions (Porter, 1985: 12).
2.2. TQM Elements
Total quality management (TQM) is a systematic quality improvement approach for firm-wide management for the purpose of improving performance in terms of quality (Sadıkoğlu & Zehir, 2010: 13). TQM is an integrated management philosophy and set of practices that emphasizes, among other things, continuous improvement, meeting customers’ requirements, reducing rework, long range thinking, increased employee involvement and teamwork, process redesign, competitive benchmarking, team based problem solving, constant measurement of results, and closer relationships with suppliers. Its adherents claim that managers can implement TQM in any organization – manufacturing, service, non-profit or government – and that it generates improved products and services, reduced costs, more satisfied customers and employees, and improved bottom line financial performance (Powell, 1995: 17).
In TQM literature, researchers and gurus have different opinions on the number and content of the elements of TQM. Each management guru invariably identifies a set of “key practices” that they claim are essential to achieving superior quality outcomes. The number of critical elements ranges from Juran’s “triology” of managerial processes to Deming’s 14 points (Dow, Samson, & Ford, 1999: 1). In this study, we will take eight of these elements into account in our research model. These are leadership, decision-making approach, process approach, continuous improvement approach, employee participation, supplier management, customer focus and training.
3. Research Model and Proposed Hypothesis
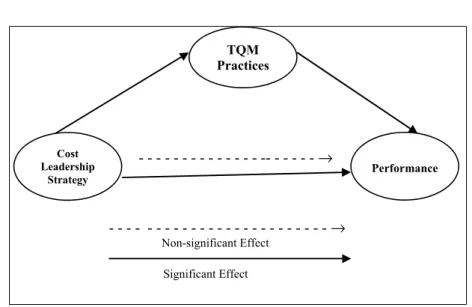
There are many study results showing positive and negative (or non-significant) relationships or correlations between TQM practices and various performance indicators. There isn’t any consensus among scholars on the elements of TQM practices (whether these indicators are assessed one by one or as a whole) and their effect on financial and innovative or other firm performance indicators. Furthermore, there are also many study results showing relationships between competition strategies and performance indicators. Our study aims to show the relationships between cost leadership strategy and firm’s financial performance using the TQM practices as the mediator. In addition, we aimed to discover the relationships between cost leadership strategy and financial performance indicators.
Figure 1. Proposed Research Model of the Relationships Between Cost Leadership Strategy, TQM Practices and Firm’s Financial Performance
H1; Cost leadership strategy are positively related to TQM practices.
H2; Cost leadership strategy are positively related to financial performance
H3 ; TQM practices are positively related to financial performance.
H4; Cost leadership strategy are positively related to financial performance
with TQM practices as the mediator.
4. Research Methodology
The research plan is stated as: establishing research model, researching for the survey questions in the literature, constructing the best fitting survey from the alternatives, reaching the participants and informing them for the survey, gathering the data and measuring and analysing the data to test the hypothesizes.
We adapted items for TQM factors and performance measures from the studies of Rahman & Bullock (2005), Chong & Rundus (2004), Fuentes, Saez & Montes (2004), Cua, Kone & Schoreder (2001), Saraph, Benson & Schroeder (1989), Kannan & Tan (2005), Prajogo & Sohal (2004), and Kaynak (2003) and competition strategies from Porter (1985). The questionnaire included a five-point Likert-type scale anchored at (1) strongly disagree and (5) strongly agree, indicating respondents’ disagreement or agreement with each item.
5. Results of the Analysis 5.1. Sample Demographics
This study has focused on Turkish medium and big sized firms operating mostly in İstanbul and Gebze. More than 70% of the Turkish manufacturing industry is performed and located in Marmara Region of Turkey. Thus our data were taken from medium and large manufacturing firms of this region.
We sent more than 600 questionnaires to middle and top level managers and directors of the companies by sending e-mail or by requesting them to fill the hard
- - - -- - - → - - - - - - - → Non-significant Effect Significant Effect TQM Practices Cost Leadership Strategy Performance
copy while one to one interaction in 2014 and 2015, assuring confidentiality, and offering the resulting general firm profile for participating in the survey in order to obtain a high response rate. As a result of data collection process, we received 442 usable questionnaires from 142 different companies and this means a 74% response rate.
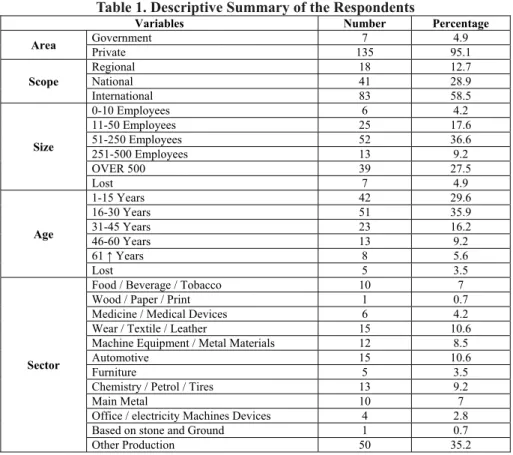
The table below shows the demographic statistics of the respondents. Mostly manufacturing companies, %95.1 of the respondents are private companies. Approximately %75 of the companies are middle and big sized ones.
Table 1. Descriptive Summary of the Respondents
Variables Number Percentage
Area Government Private 135 7 95.1 4.9 Scope Regional 18 12.7 National 41 28.9 International 83 58.5 Size 0-10 Employees 6 4.2 11-50 Employees 25 17.6 51-250 Employees 52 36.6 251-500 Employees 13 9.2 OVER 500 39 27.5 Lost 7 4.9 Age 1-15 Years 42 29.6 16-30 Years 51 35.9 31-45 Years 23 16.2 46-60 Years 13 9.2 61 ↑ Years 8 5.6 Lost 5 3.5 Sector
Food / Beverage / Tobacco 10 7
Wood / Paper / Print 1 0.7
Medicine / Medical Devices 6 4.2
Wear / Textile / Leather 15 10.6
Machine Equipment / Metal Materials 12 8.5
Automotive 15 10.6
Furniture 5 3.5
Chemistry / Petrol / Tires 13 9.2
Main Metal 10 7
Office / electricity Machines Devices 4 2.8
Based on stone and Ground 1 0.7
Other Production 50 35.2
5.2. Validity and reliability of the measurement instrument
The below analysis and methods have been used for testing the validity and reliability of the scales belong to the research variables.
The survey factor analysis has been done by using Principal Component Analysis, estimation method and Varimax rotation to display the scales belong to the variables used at the research has been perceived by the participants in what scale and under how many sub dimensions.
In order to test the conformity of the data set to the factor analysis, Kaiser-Meyer-Olkin (KMO) sample efficiency test and Bartlett test have been applied. At the end of the analysis performed, KMO value has been over the expected level 0.50 with the 0.945 value and it has been displayed that it is meaningful at the 0.001
importance level at the Bartlett test. At the principal component analyses, sub limit of factor weights of each material have been taken as 0.45 by taking into consideration to the size of the sample (Hair, Black, & Babin, 2010: 120). According to the PCA, each variant has been loaded to the foreseen factor component and factor weights have been between 0.455 and 0.787. Besides, is has been observed that factor weights have been mostly over the 0.500 value.
On the basis of the Cronbach’s Alpha value of the factors, their factor reliabilities have been seen separated and it is observed that such value has been over 0.70 value that is the acceptable lowest value. This is also displaying that these factors have domestic coherence and reliability.
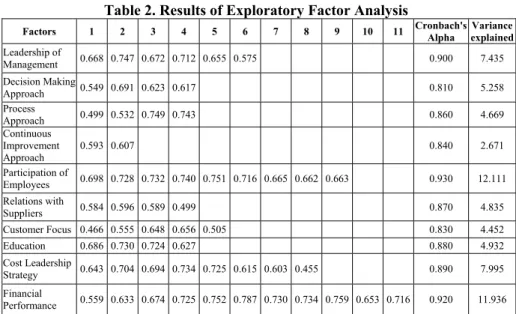
Table of the concerning factor analysis is shown below.
Table 2. Results of Exploratory Factor Analysis
Factors 1 2 3 4 5 6 7 8 9 10 11 Cronbach's Alpha explained Variance
Leadership of Management 0.668 0.747 0.672 0.712 0.655 0.575 0.900 7.435 Decision Making Approach 0.549 0.691 0.623 0.617 0.810 5.258 Process Approach 0.499 0.532 0.749 0.743 0.860 4.669 Continuous Improvement Approach 0.593 0.607 0.840 2.671 Participation of Employees 0.698 0.728 0.732 0.740 0.751 0.716 0.665 0.662 0.663 0.930 12.111 Relations with Suppliers 0.584 0.596 0.589 0.499 0.870 4.835 Customer Focus 0.466 0.555 0.648 0.656 0.505 0.830 4.452 Education 0.686 0.730 0.724 0.627 0.880 4.932 Cost Leadership Strategy 0.643 0.704 0.694 0.734 0.725 0.615 0.603 0.455 0.890 7.995 Financial Performance 0.559 0.633 0.674 0.725 0.752 0.787 0.730 0.734 0.759 0.653 0.716 0.920 11.936
Notes: (i) Principal Component Analyses with Varimax Rotation. (ii) KMO =0,945, Bartlett Test; <0.001.
(iii) Total Explained Variance (%); 66.295
For the purpose of confirmatory of the scale obtained at the solution of the exploratory factor analysis, the data obtained from the 442 directors have been taken under the recognition factor analysis on the basis of the structural equation modelling technique. At the confirmatory factor analysis, Maximum Probability estimation method has been used and this method is based on three basic hypotheses (Hox ve Bencger, 1998). These are; samples to be at an efficient number such as 200 data, the scale contending the observed variants to be comprising from the continuous data and the hypothesis of the data to be conforming to the normal distribution. Presence of these two conditions has been proved and irregularity and lowness values of the data variables have been looked at. Because these values have been between +1 –1 (Garson, 2012), it has been revealed that data variables have conformed to the normal distribution.
After proving the concerning conditions, confirmatory factor analysis has been performed. All items were loaded statistically significantly on their respective
variables (with the lowest t value being 11.302 at p < 0.01). Average of the factor weights of the items belong to one factor to be over 0,7 is an expected circumstance and this certain condition has been answered for the factors that take place at our research. According to this, it has been observed that the scales have high rate of convergent validity (Bagozzi, Richard, Youjae Yi, & Lynn, 1991: 426).
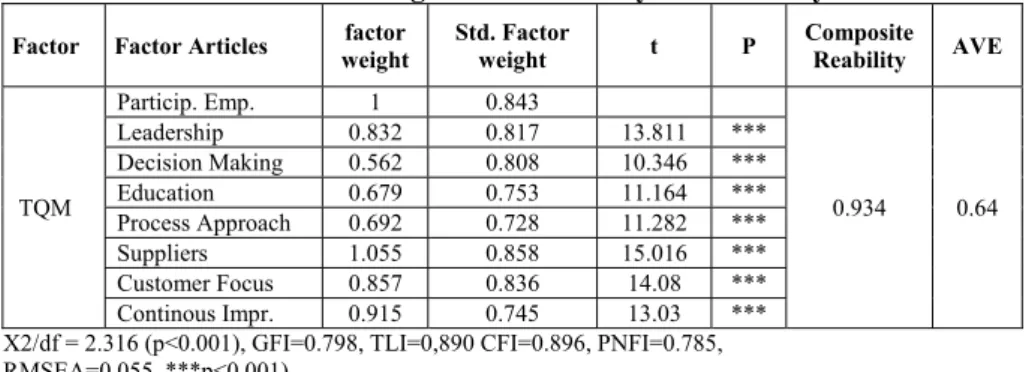
According to the research hypothesis, TQM applications have been collected under only one factor and recognition factor analysis has been applied. Table of the analysis result is shown below. According to this, factor weight of each item has been over 0.7 and it is displayed that it is statically meaningful.
Table 3. Second Degree Confirmatory Factor Analysis
Factor Factor Articles weight factor Std. Factor weight t P Composite Reability AVE
TQM Particip. Emp. 1 0.843 0.934 0.64 Leadership 0.832 0.817 13.811 *** Decision Making 0.562 0.808 10.346 *** Education 0.679 0.753 11.164 *** Process Approach 0.692 0.728 11.282 *** Suppliers 1.055 0.858 15.016 *** Customer Focus 0.857 0.836 14.08 *** Continous Impr. 0.915 0.745 13.03 *** X2/df = 2.316 (p<0.001), GFI=0.798, TLI=0,890 CFI=0.896, PNFI=0.785, RMSEA=0.055 ***p<0.001)
At the structural equation modelling, to test the statically meaningfulness of the theoretical model, the values that are called goodness of fit index are being used. The goodness of fit indexes that we will use at our study are X2/df, RMSEA , GFI, NNFI-TLI, CFI, PNFI (Hooper, Coughlan, & Mullen, 2008: 54) indexes.
The model goodness of fit values of recognition factor analysis of the first degree have been as X2/df = 2.263 (p<0.001), GFI=0.807, TLI=0.894 CFI=0.903, PNFI=0.771, RMSEA=0.054 and the model goodness of fit values of recognition factor analysis of the second degree TQM applications have been as X2/df = 2.316 (p<0.001), GFI=0.798, TLI=0.890 CFI=0.896, PNFI=0.785, RMSEA=0.055, presence of a conformity that can generally be accepted for both two factor analyses has been observed.
AVE (Average Variance Extracted) and SCR (Scale Composite Reliability) (Bagozzi, Richard, & Yi, 1988: 76) values have been used for testing the validity and reliability of the factors. If AVE value is CR value of 0.5, when it has been over 0.7, it is possible to say that validity and reliability of the concerning factor has been proved. AVE and SCR values belonging to the research factors are shown above. According to this, it has been displayed that validity and reliability of the factors have been at the expected level.
Results of the correlation analysis have displayed that there is a meaningful and in the positive direction relation between the factors. Besides, because square root of AVE values for each factor has been higher than the correlation of the concerning factors with the other factors, it has been observed that the discriminant validity has been proved (Hair et al., 2010: 330).
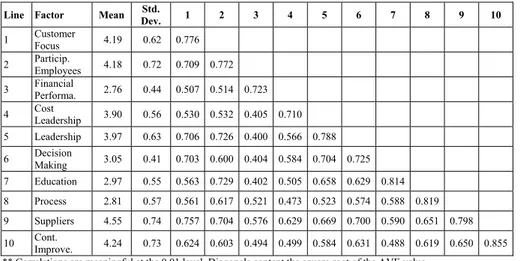
Table 4. The Correlation, Average and Standard Deviation Values for the Research Variables
Line Factor Mean Dev. Std. 1 2 3 4 5 6 7 8 9 10
1 Customer Focus 4.19 0.62 0.776 2 Particip. Employees 4.18 0.72 0.709 0.772 3 Financial Performa. 2.76 0.44 0.507 0.514 0.723 4 Cost Leadership 3.90 0.56 0.530 0.532 0.405 0.710 5 Leadership 3.97 0.63 0.706 0.726 0.400 0.566 0.788 6 Decision Making 3.05 0.41 0.703 0.600 0.404 0.584 0.704 0.725 7 Education 2.97 0.55 0.563 0.729 0.402 0.505 0.658 0.629 0.814 8 Process 2.81 0.57 0.561 0.617 0.521 0.473 0.523 0.574 0.588 0.819 9 Suppliers 4.55 0.74 0.757 0.704 0.576 0.629 0.669 0.700 0.590 0.651 0.798 10 Cont. Improve. 4.24 0.73 0.624 0.603 0.494 0.499 0.584 0.631 0.488 0.619 0.650 0.855
** Correlations are meaningful at the 0.01 level. Diagonals content the square root of the AVE value. 5.3. Test of the research model
For the purpose of testing the hypothesis of the research, the arithmetical averages of the items of each one factor have been taken and regression analyses have been done by using path analysis based on the structural equation modelling technique from the variables formed.
The research hypotheses that are formed whether TQM applications have affected the establishment performance or not are given below.
H1; Cost leadership strategy are positively related to TQM practices.
H2; Cost leadership strategy are positively related to financial performance
H3; TQM practices are positively related to financial performance.
Results of the multiple regression analyses performed with the path analysis method to test the subjected research hypotheses are given at the below table.
Table 5. Results of the Multiple Regression Analyses
Independent Variables Dependent Variables
TQM Applications Financial Performance MODEL 1 Cost Leadership Strategy Std. β t p 0.676*** 10.924 0.000 R2=0.46
MODEL 2 Leadership Cost Strategy Std. β t P 0.403*** 6.831 0.000 R2=0.16 MODEL 3 Applications TQM Std. β t P 0.595*** 9.340 0.000 R2=0.35
According to the results of Model 1, cost leadership strategy (β=0.676; p<0.01) variable is affecting to the TQM applications variable meaningful and in the positive direction.
According to the results of Model 2, cost leadership strategy (β=0.403; p<0.01) variable is affecting to the financial performance variable meaningful and in the positive direction.
According to the results of Model 3, TQM applications (β=0.595; p<0.01) variable is affecting to the financial performance variable meaningful and in the positive direction.
Multiple correlation coefficients (R2) show the percentage of explaining by
independent variables to the dependent variable. According to this, it is seen that cost leadership variable is explaining the TQM applications variables at the 46% level and explaining the financial performance variable at the 16% level. TQM applications variable is explaining the financial performance variable at the 35% level.
At the relationship between the cost leadership strategy and establishment performance, the research hypothesis that has been formed for the probable agency variable relationship of the TQM applications is shown below.
H4; Cost leadership strategy are positively related to financial performance with
TQM practices as the mediator.
Results of the structural equation models that are formed for testing the H4
hypothesis that is formed for stating the agent and variable relationship at the relationship between the cost leadership strategy of TQM applications variable and financial performance variable are shown below.
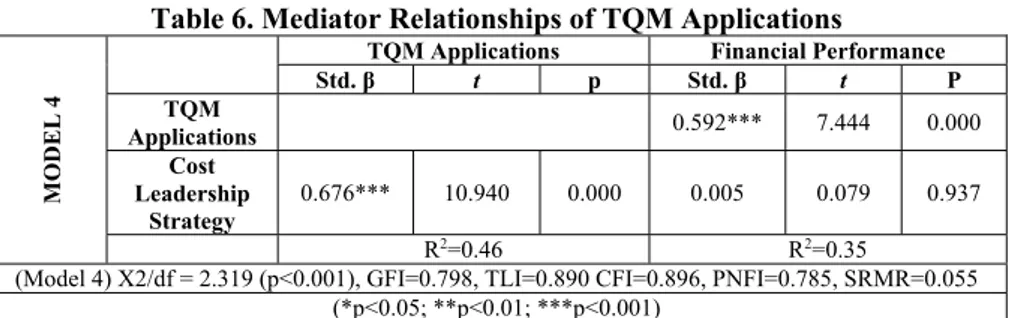
Table 6. Mediator Relationships of TQM Applications
MO
DEL 4
Std. β TQM Applications t p Std. Financial Performance β t P TQM Applications 0.592*** 7.444 0.000 Cost Leadership Strategy 0.676*** 10.940 0.000 0.005 0.079 0.937 R2=0.46 R2=0.35
(Model 4) X2/df = 2.319 (p<0.001), GFI=0.798, TLI=0.890 CFI=0.896, PNFI=0.785, SRMR=0.055 (*p<0.05; **p<0.01; ***p<0.001)
According to the above mentioned regression analysis, during the cost leadership variable has been affecting the performance variable meaningful and in the positive direction before agent variable gets into the relation (β=0.595; p<0.001), when the agent variable has been included to the relationship (Model 4), it is seen that effect of the cost leadership strategy variable on the financial performance has been removed (β=0.005; p>0.05).
For measuring the validity of the probable mediator effects, “Bootstrap” method has been used and the indirect effect of the cost leadership strategy variable on the financial performance has been researched on the 5000 samples (Preacher ve Hayes, 2004) and because of the presence of the meaningful indirect effect in the 95 percent confidence level (β=0.400; p<0.001), it was seen that the effect of mediator has been valid.
According to this, H4 has been accepted. So, it has been displayed that TQM
applications have formed a complete mediator effect at relationship between the cost leadership strategy and financial performance. The figure showing the results of concerning structural equation modelling is shown below.
Table. 7. Results of the Research Model
6. Conclusions
The results of the analysis show that cost leadership strategy is significantly and positively correlated with the eight Total Quality Management Applications and financial performance of the firm. Generally, in the literature, the relationship between TQM applications and performance or the relationship between strategies with the performance of a firm are tested and results are evaluated. But in this study, cost leadership strategy is the independent variable and TQM applications are the mediator and financial performance is the dependent variable. Especially managers who place cost leadership strategy at the starting point can utilize this study. Because our study supported the hypothesis that cost leadership study is strongly related to the financial performance of the firm.
Another important result of our study is that the hypothesis “Cost leadership strategy is positively related to financial performance with TQM practices as the mediator.” is supported. That means that TQM applications have formed a complete mediator effect in the relationship between the cost leadership strategy and financial performance. At the end of the analysis, we have seen that our four hypothesis are supported.
7. References
Acar, A. Z., & Zehir, C. (2010). The Harmonized Effects of Generic Strategies and Business Capabilities on Business Performance. Journal of Business Economics and Management, 11(4), 689-711.
Bal, Y. (2011). The effect of competitive strategies on human resource management practices (Unpublished doctoral dissertation). Istanbul University Institute of Social Sciences, İstanbul. B; 0.005 ns - - - → - - - - - - -- - - - → Non-significant Effect Significant Effect TQM Practices Cost Leadership Strategy Performance B;0.592*** (w/o mediator)
Barney, J. (1991). Firm resources and sustained competitive advantage. Journal of Management, 17(1), 99-120.
Barney, J. & Hesterly, W. S. (2011). Strategic management and competitive advantage: concepts (4th ed.). Upper Saddle River, NJ: Pearson Education.
Bagozzi, Richard P., Youjae Yi, & Lynn W. P. (1991). Assessing construct validity in organizational research. Administrative science quarterly, 36, 421-458.
Bagozzi, Richard P., & Youjae Yi. (1988). On the evaluation of structural equation models. Journal of the Academy of Marketing Science, 16 (1), 74-94.
Cavusgil, S. T., Knight, G., & Riesenberger, J. R., (2008). International business: Strategy, management and the new realities (1st ed.). Upper Saddle River, New Jersey: Prentice
Hall.
Chong, V. K., Rundus, M. J., (2004). Total quality management, market competition and organizational performance. The British Accounting Review, 36, 155–172.
Crocker, L., & J. Algina. (1986). Introduction to classical & modern test theory (1st ed.).
Holt, Reinhart & Winston, Orlando.
Cua, K. O., Mc Kone, K. E., & Schoreder, R. G. (2001). Relationship between implementation of TQM, JIT and TPM and manufacturing performance. Journal of Operations Management, 19, 675–694.
Daft, R. L. (1983). Learning the craft of organizational research. Academy of Management Review, 8(4), 539-546
Day, G. S., & Wensley, R. (1988). Assessing advantage: A framework for diagnosing competitive superiority. Journal of Management, 52, 1-20.
Dow, D., Samson, D., & Ford, S. (1999). Exploding the myth: Do all quality management practices contribute to superior quality performance? Production and Operations Management, 8, 1-25.
Eraslan, İ. H. (2008). The effects of competitive strategies on firm performance: A study in Turkish textile and apparel industry considering the mediating role of value chain activities (Unpublished doctoral dissertation). Boğaziçi University Social Sciences Institute, İstanbul.
Field, A. (2009). Discovering statistics using SPSS (3rd Ed.). London: Sage
Fuentes, M. M. F., Saez, A. C. A. & Montes, F. J. L. (2004). The impact of environmental characteristics on TQM principles and organizational performance. Omega, 32 (6), 425– 442.
Garson, D. (2012). Testing statistical assumptions, USA: Statistical associates publishing, Retrieved from http://www.statisticalassociates.com/assumptions.pdf
Ghemewat, P. & Rivkin, J. W. (2006). Creating competitive advantage. Harvard Business School Background Note, 798-062.
Hair, J. F., Black, W. C., & Babin, B. J. (2010). Multivariate data analysis: A global perspective (7thed.). Upper Saddle River: Prentice Hall.
Hoffman, N. P. (2000). An examination of the sustainable competitive advantage concept: Past, present, and future. Academy of Marketing Science Review, 4, 1-21
Hooper, D., Coughlan, J., & Mullen, M. (2008). Structural equation modelling: Guidelines for determining model fit. Electronic Journal of Business Research Methods, 6 (1), 53-60. Hox, J. J., & T. M. Bechger, (1998). An introduction to structural equation modelling. Family
Science Review, 11, 354-373.
Hu, L. T. & Bentler, P. M. (1999). Cut off criteria for fit indexes in covariance structure analysis: Conventional criteria versus new alternatives. Structural equation modeling: A Multidisciplinary Journal, 6(1), 1-55.
Kannan, V. R. & Tan, K. C. (2005). Just in time, total quality management, and supply chain management: understanding their linkages and impact on business performance. Omega 33(2), 153–162.
Kaynak H. (2003). The relationship between total quality management practices and their effects of firm performance, Journal of Operations Management, 21(4), 405-435. Kehoe, D. F. (1996). The fundamentals of quality management, Netherlands, Springer. McKiernan, P., (1997). Strategy past; strategy futures. Long Range Planning, 30(5), 790-798.
Mintzberg, H. (1988). Generic strategies: Toward a comprehensive framework. Advances in Strategic Management 5, 1-67.
Porter, M. E. (1985). Competitive advantage: Creating and sustaining superior performance. New York: The Free Press.
Porter, M. E. (1990). New global strategies for competitive advantage. Planning Rewiev, 18(3), 4-14
Porter, M. E. (1998). Competitive advantage creating and sustaining superior performance. New York: The Free Press.
Powel, T. C. (1995). Total quality management as competitive advantage: A review and empirical study. Strategic Management Journal, 16(1), 15-37.
Prajogo, D. I. & Sohal, A. S., (2004). The multidimensionality of TQM practices in
determining quality and innovation performance-an empirical examination. Technovation, 24, 443–453.
Preacher, K. J. & Hayes, A. F. (2004). SPSS and SAS procedures for estimating indirect effects in simple mediation models. Behavior Research Methods, Instruments, & Computers, 36(4), 717-731.
Rahman, S. & Bullock, P. (2005). Soft TQM, hard TQM, and organizational performance relationships: An empirical investigation. Omega 33, 73-83.
Rugman, A. & Hodgetts, R., (2000). International business: A strategic management approach (2nd ed.). New York and London: Prentice Hall
Sadıkoğlu, E. & Zehir, C. (2010). Investigating the effects of innovation and employee performance on the relationship between total quality management practices and firm performance: An empirical study of Turkish firms. International Journal of Production Economics, 127, 13-26.
Saraph, J. V., Benson, P. G., & Schroeder, R. G. (1989). An instrument for measuring the critical factors of quality management. Decision Sciences, 20, 810–829.
Teece, D. C., Pisano, G., & Shuen, A., (1997). Dynamic capabilities and strategic management, Strategic Management Journal, 18(7), 509-533.
Thompson, A. A., & Strickland, A. J. (1996). Strategic management: Concepts and cases. (9th ed.). USA: Irwin McGraw-Hill.
Ünlücan, D. (2004). Competitive strategies in small and medium-sized businesses: A research
on developing competitive strategies for small and medium-sized businesses in the
Turkish Republic of Northern Cyprus while preparing for the European Union,
(Unpublished doctoral dissertation) Çukurova University Institute of Social Sciences, Adana.
Wheelen, T. L., & Hunger, D. J. (2002). Strategic management and business policy (8th ed.). Massachusetts: Prentice Hall.
Zehir, C., & Sadıkoğlu, E. (2012). Relationships among total quality management practices: An empirical study in Turkish industry, International Journal of Performability Engineering, 8, 667-678.