(1)Kastamonu Üniversitesi, İİBF, İktisat Bölümü; [email protected] Geliş/Received: 11-09-2017, Kabul/Accepted: 12-04-2018
Tarımsal Ar-Ge Harcamalarının Tarımsal Toplam Faktör Verimliliği Üzerindeki Etkileri: Seçilmiş Latin Amerika Ülkeleri Örneği
Sefa IŞIK(1)
ABSTRACT:
The aim of the study is to investigate the impacts of agricultural research and development expenditures on agricultural total factor productivity by using annual panel data set covering 5 selected Latin American countries from 1981 to 2013. In doing so, we use the panel cointegration analysis under cross-section dependence and panel fully modified ordinary least squares (FMOLS) method. At the end of the analysis; there is a cointegration relationship between research and development and total factor productivity in agriculture sector for these selected countries. Also, the elasticity coefficient of agricultural research and development expenditures is 0.58.Keywords: Research and Development, Total Factor Productivity, Agriculture Sector JEL Classifications: O3; O4; Q0
Öz
: Bu çalışmanın amacı, 1981-2013 döneminde seçilmiş 5 Latin Amerika ülkesinikapsayan tarımsal AR-GE harcamalarının tarımsal toplam faktör verimliliği üzerindeki etkilerini araştırmaktır. Çalışmada yatay kesit bağımlılığı altında panel eşbütünleşme analizi ve tamamen değiştirilmiş en küçük kareler (FMOLS) yöntemi kullanılmıştır. Çalışmanın sonucunda tarımsal AR-GE harcamaları ile tarımsal toplam faktör verimliliği arasında eşbütünleşme ilişkisi tespit edilmiş olup tarımsal AR-GE harcamalarının esneklik katsayısı 0,58 olarak bulunmuştur.
Anahtar Kelimeler: AR-GE, Toplam Faktör Verimliliği, Tarım Sektörü
1. Introduction
In 1798 T. R. Malthus predicted that subsistence increases only in an arithmetical ratio, whereas population increases in a geometrical ratio (McAtee, 1936:444). That is, population growth would exceed food sources and amount of food per person would decrease in the near future. However, it didn’t happen as feared. Moreover, people are able to reach more foods than before.
In the period 1960-2011, world population dramatically increased from roughly 3 billion to 7 billion (The World Bank, 2018). On the other hand, global agricultural output more than tripled from 1961 to 2011 (FAO, 2017). How could food amenities increase faster than the increase in the population growth? This can be explained by the agricultural growth.
Agricultural growth decomposes growth due to total input use and total factor productivity (TFP). In particular, TFP has become the main source of agricultural growth worldwide (USDA, 2012). Agricultural research and extension, public investment in infrastructures (irrigation, electricity, roads) and efficient use of water and plant nutrients are mainly sources of increase in TFP (Singh vd., 2002: 24). In particular, research and development (R&D) in agriculture sector is widely considered as an important factor of TFP growth (Suphannachart, and Warr, 2011:35). The effect of R&D may occur after many years, but we expect that the returns are considerable. Since the economic theory ensures little information about relationship between R&D and productivity (or production) in agricultural sector, empirical works either estimate the elasticity of agricultural productivity or output with respect to R&D expenditures or appraise R&D as a source of productivity (Salim, and Islam, 2010:561-562). A. Lusigi and C. Thirtle (1997) investigated the impact of agricultural R&D on TFP by usingdeterministic and stochastic frontier models. Their study included 47 African countries over the period 1961-91.They found that the impact of agricultural R&D on TFP was positive and significant.
Evenson, Pray, and Rosegrant (1999) conducted a study examining the effect of research and development on productivity in Indian agriculture. They found that India benefited from investments in agricultural research, extension, and irrigation. According to this study, public agricultural research and extension were the key sources of agricultural productivity in India during 1956–87. Also, improvement in human capital, expansion of irrigated area, and rural infrastructure were considerable sources. Although private investment in agricultural research was substantial, public investment in agricultural research had primary role.
Chen et al. (2008) examined the agricultural productivity growth in China for the period 1990-2003 by using a dataset of 29 provinces in China. They indicated that technical progress was the major source of TFP growth. Their results also stated that public investment in R&D, agricultural tax cut, infrastructure, and mechanization were the main factors of technical progress. Education, policy reforms, and disaster mitigations were equally considerable sources in terms of efficiency improvement. A.D. Alene (2010) measured and compared agricultural TFP growth in Africa over the period 1970-2004 under contemporaneous and sequential technology frontiers. He showed that agricultural R&D had a positive and significant aggregate effect on agricultural productivity. He stated that whereas the strong agricultural R&D expenditure growth in 1970s led to strong agricultural TFP growth after 1985, low R&D expenditure in the 1980s and early 1990s led to slower TFP growth in the 2000s in African agriculture. He also found that the elasticity of agricultural productivity with respect to R&D was 0.20. According to the author, increasing in the R&D expenditures is needed to sustain TFP growth in African agriculture.
Salim and Islam (2010) examined the effect of climate change and R&D expenditure on agricultural TFP in Western Australia for the period of 1977-2005 by using time series analysis. Their results showed that both these two variables were decisive for agricultural productivity growth in the long run. They also reported that the long-run elasticity of TFP with respect to climate change was 0.506, while that of R&D expenditure was 0.497.
Suphannachart and Warr (2011) investigated the impact of public investment in agricultural R&D on TFP in Thai agriculture for crop production. They used error correction methods for the period of 1970-2006. The authors concluded that publicly funded agricultural research had a positive and significant effect on TFP. Also, the rate of return to public investment in agricultural research was estimated 29.5 percent in Thai agriculture.
The two papers, Mullen and Cox (1995); Cox, Mullen and Hu (1997), measured the impact of public research expenditures on Australian broadacre agriculture1. Mullen and Cox (1995) concluded that the internal rate of return2 to public research was 15-40 per cent in the period of 1953-88. Cox, Mullen and Hu (1997), using nonparametric methods, reported that internal rate of return to research expenditures was estimated to be in the 12 per cent to 20 per cent range over the 1953-94 period for Australian broadacre agriculture.
Alston, Chan-Kang, Marra, Pardey, and Wyatt (2000) conducted a meta-analysis of studies that had estimated rates of return to agricultural R&D. The paper included 292 studies with 1,852 estimates of rates of return to agricultural R&D. After excluded statistical outliers and incomplete observations, they implemented a meta-analysis regression using 1,128 estimates. They estimated that the mean of internal rates of return was 65 per cent overall for a sample of 1,128 estimates.
In this paper, we investigate the effects of total agricultural research and development (AgRD) expenditures on agricultural total factor productivity (AgTFP). The study uses a panel dataset of 5 selected Latin American countries over the period 1981-2013 by using the panel co-integration analysis under the cross section dependence and panel FMOLS.
The study is organized as follows. In section 2, we present a brief overview of AgRD expenditure and AgTFP for Latin America. Section 3 describes the dataset and method. Section 4 presents empirical analysis, and the conclusions and policy suggestions are in Section 5.
2. A Brief Overview of Agricultural R&D and Agricultural TFP for
Latin America
2.1. Agricultural R&D
According to OECD (2015), “research and experimental development (R&D)
comprise creative and systematic work undertaken in order to increase the stock of knowledge – including knowledge of humankind, culture and society – and to devise new applications of available knowledge.” In this context, agricultural R&D can be
explained as R&D activities in agriculture sector.
1 Broadacre agriculture refers to the sheep, beef and cropping industries.
2 The Internal Rate of Return is one of the popular metrics used to measure the economic return on
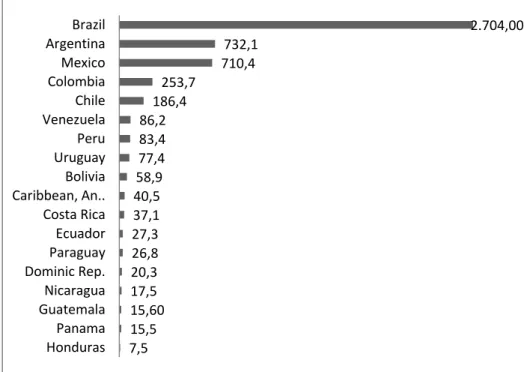
Both public and private sectors finance agricultural R&D expenditures and conduct agricultural R&D projects. In Latin America and the Caribbean (LAC), R&D expenditures in 2013 are shown in table 1.
Table 1. Total Agricultural R&D Expenditures in 2013 (Million 2011 PPP dollars)
Note: Total agricultural R&D spending includes salaries, operating and program costs, and capital investments for all government, nonprofit, and higher education agencies that conduct agricultural research (excl. the private for-profit sector) in a given country.
Source: Agricultural Science and Technology Indicators (ASTI, 2018)
Table 1 shows that LAC as a whole spent 5.1 billion dollar on Agricultural R&D in 2013. A striking result is that Brazil spent more than half the region’s total spending that year (2.7 billion dollar), representing the largest country in the region in terms of agricultural R&D expenditure. Brazil is followed by Argentina (732 million dollar), Mexico (710 million dollar), Colombia (254 million dollar), and Chile (186 million dollar). The rest of the region had lower agricultural R&D spending levels in 2013.
2.2. Agricultural TFP
Productivity can be defined in two ways. Firstly, productivity is output per unit of an
input such as labor. The second way is that productivity is output per unit of all inputs
used in production. The latter measure is known as TFP. Growth in TFP is computed as the difference between the total output growth rate and the total inputs growth rate (Fuglie, MacDonald, and Ball, 2007:6). If a growth in TFP is computed for agriculture sector, then it can be called as the growth in agricultural TFP.
7,5 15,5 15,60 17,5 20,3 26,8 27,3 37,1 40,5 58,9 77,4 83,4 86,2 186,4 253,7 710,4 732,1 2.704,00 Honduras Panama Guatemala Nicaragua Dominic Rep. Paraguay Ecuador Costa Rica Caribbean, An.. Bolivia Uruguay Peru Venezuela Chile Colombia Mexico Argentina Brazil
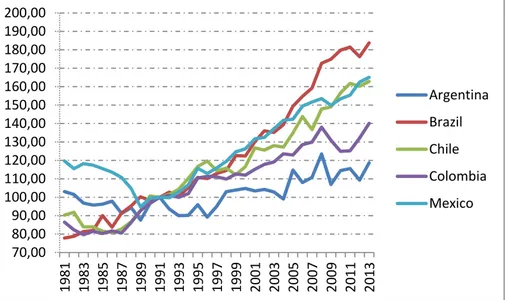
Agricultural TFP has long been considered as the key to overall economic growth (Alene, 2010:223). Agricultural TFP, therefore, can be seen as a considerable indicator of the long run performance of overall economy as well as the agricultural sector. Figure 1 shows agricultural TFP Index for selected Latin American countries.
Figure 1. Agricultural TFP Index, 1981-2013 (1991=100)
Source: United States Department of Agriculture – Economic Research Service (USDA – ERS, 2018)
Figure 1 shows that agricultural TFP increased from 1981 to 2013 for all selected countries. The fastest increase in that period belonged to Brazil’s agricultural TFP. Also, whereas Chile and Colombia had fast agricultural TFP growth, Argentina had relatively slow growth. Although Mexico's TFP growth had fallen in 1989, it rose rapidly after 1989.
Ludena (2010) examined TFP growth in LAC’s agriculture over the period 1961-2007 and stated that LAC had the highest agricultural productivity growth among developing regions. In the last two decades, the performance of LAC’s agriculture was particularly strong because of developments in efficiency and the introduction of new technologies. Nin-Pratt, Falconi, Ludena, and Martel (2015) analyzed the performance of LAC’s agriculture between 1980 and 2012 and concluded that regional agricultural TFP increased by 45 percent. They also reported that this performance of LAC’S agriculture was the result of increases in land productivity, fast growth in the use of fertilizer, and growth in the use of capital that expanded cultivated area per worker.
3. Data and Method
In this study, 5 Latin American countries are selected and data of the period 1981-2013 is used. These countries are Argentina, Brazil, Chile, Colombia, and Mexico. Share of these countries was about 90 percent in terms of agricultural R&D expenditure in 2013 within Latin America. This fact affected the country selection for this study. AgRD dataset is provided from the Agricultural Science and Technology
70,00 80,00 90,00 100,00 110,00 120,00 130,00 140,00 150,00 160,00 170,00 180,00 190,00 200,00 19 81 19 83 19 85 19 87 19 89 19 91 19 93 19 95 19 97 19 99 20 01 20 03 20 05 20 07 20 09 20 11 20 13 Argentina Brazil Chile Colombia Mexico
Indicators3 (ASTI, 2018). On the other hand, AgTFP indexes (based year 1991) dataset is provided from United States Department of Agriculture – Economic Research Service (USDA – ERS, 2018). Natural logarithm of these variables is used in this study.
In this study, cross-sectional dependence among countries is tested by using Breusch-Pagan (1980) Lagrange Multiplier (LM) test. The stationarity of the series is analyzed with Pesaran (2007) Panel Unit Root test (CIPS) which is one of the second generation panel unit root tests. Westerlund (2008) Durbin-H panel Cointegration Test is used to test the existence of co-integration relationship between AgTFP and AgRD series. Finally, panel FMOLS method is used to investigate the coefficients of long term cointegration results of variables.
4. Empirical Analysis
4.1. Test of Cross Sectional Dependence
In panel data analysis, test of cross sectional dependence is needed to be decided which unit root test would be proper. In this study, since the cross-sectional dimension (N=5) of the panel is less than the time dimension (T=33). Breusch-Pagan (1980) Lagrange Multiplier (LM) test statistic is used.
2
where the are the correlation coefficients obtained from the residuals of the model as described above. The asymptotic distribution is obtained for Ν fixed as → ∞ for all (i, j) and follows from a normality assumption on the errors.
This test allows us to test the following hypothesis:
: There is cross-sectional Independence
The hypothesis is rejected at a significance level of 1%, 5%, and 10% when the
probability value of the test is less than level of 1%, 5%, and 10%, respectively and be accepted that there is cross-section dependency across these countries. Results of Breusch-Pagan (1980) LM test are given in table 2:
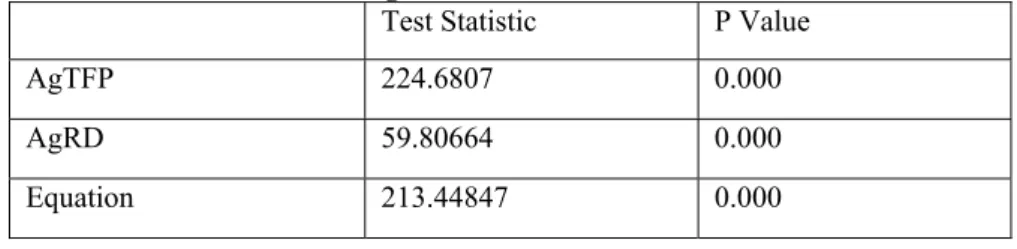
Table 2. Results of Breusch-Pagan (1980) LM Test
Test Statistic P Value
AgTFP 224.6807 0.000
AgRD 59.80664 0.000
Equation 213.44847 0.000
3 ASTI defines “agricultural research to include research on crops, livestock, forestry, fisheries, natural resources, and the socioeconomic aspects of primary agricultural production. Also included is research concerning the on-farm storage and processing of agricultural products, commonly referred to as postharvest or food-processing research. R&D in the agrochemical industry, agricultural machinery, and the food processing industry off farm is not included in the current ASTI data” (Source:
According to Table 2, for variables AgTFP, AgRD and co-integration equation the null hypothesis is strongly rejected at a significance level of 1%, i.e., there is cross-sectional dependence. Therefore, while testing the unit root, it should be chosen test methods which consider the cross-section dependence.
4.2. Panel Unit Root Test
In this study, stationarity of the series is tested with Pesaran’s (2007) CADF test because of presence of cross-section dependence. This test allows us to test the following hypothesis:
: All series are non-stationary
When test results obtain probability value less than level of 1%, 5%, and 10% the hypothesis is rejected at a significance level of 1%, 5%, and 10%, respectively and it means that there is not unit root. Calculated results of panel unit root test are presented in table 3:
Table 3. Results of Pesaran (2007) Panel Unit Root Test
Test Statistic P Value
I (0) I(1) I (0) I(1)
AgTFP -2.079 -3.671 0.237 0.000
AgRD -1.797 -3.461 0.480 0.000
Note: Lag=1 depending on Schwarz information criterion
According to table 3, we cannot reject null hypothesis that all series are non- stationary in level variables at all significance levels. After the first order difference, the all series become stationary. Thus, we can confirm that all series have I(1).
4.3 Westerlund (2008) Durbin – H panel Cointegration Test
Since cross-sectional dependency is observed, cointegration relationship can be tested by the Westerlund (2008) Durbin-H method. This method tests co-integration relationship between the dimension of group and panel separately.
This test allows us to test the following hypothesis:
: There is no co-integration relationship. Table 4. Results of Westerlund (2008) Durbin-H Test
Test Statistic P Value
Durbin-H Group Statistic 1.421 0.078
Durbin-H Panel Statistic 7.025 0.000
As shown in Table 4, the Durbin-H Panel test statistics indicate that the null hypothesis of no cointegration is rejected at all significance levels. Hence, it can be inferred that there is a cointegration relationship between AgTFP and AgRD.
4.4 Panel Fully Modified Least Squares (FMOLS)
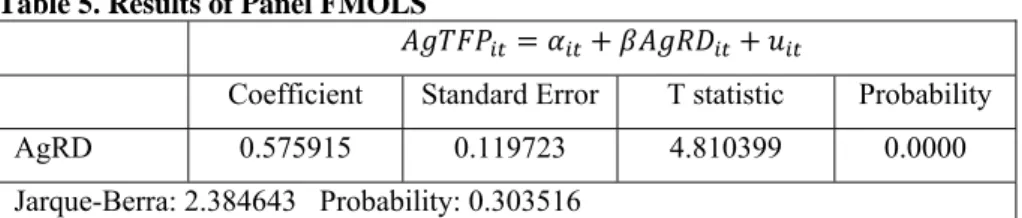
It can be used panel FMOLS method developed by Philips and Hansen (1990) to investigate the coefficients of long term cointegration results of variables. There are some advantages of FMOLS approach which are correcting for endogeneity and serial correlation, and asymptotically eliminating sample bias (Khundrakpam, J.K. and Ranjan, R., 2010:56). The results of FMOLS are shown in Table 5. According to Panel FMOLS result the elasticity coefficient of AgRD expenditure is 0.58. It means that one percent increase in AgRD expenditure causes 0.58 percent increase in AgTFP in the long run.
Table 5. Results of Panel FMOLS
Coefficient Standard Error T statistic Probability
AgRD 0.575915 0.119723 4.810399 0.0000
Jarque-Berra: 2.384643 Probability: 0.303516
Note: We adopted the Newey-West estimation method in our regression in order to obtain heteroskedacity and autocorrelation (HAC)-consistent standard errors.
5. Conclusions and Policy Suggestions
In this study, effects of total agricultural research and development expenditures on agricultural total factor productivity is examined for the selected 5 Latin American countries.In doing so, we have used under cross section dependence panel unit root and panel co-integration tests for the period of 1981-2013.
The cross-section dependency for variables and co-integration equation were tested via Breusch-Pagan (1980) LM Test. As a result of this analysis cross-section dependency is determined. This result plays important role on selecting panel unit root test. Therefore, Pesaran (2007) panel unit root test that takes into account the dependence of cross-sectional methods are used in this study. Having established that all variables are integrated of order one, we examined whether agricultural research and development expenditures, and agricultural total factor productivity are cointegrated or not by using Westerlund (2008) Durbin – H panel Cointegration Test. The result of this panel cointegration test provides that there is cointegration relationship between R&D expenditures and total factor productivity in agricultural sector. The coefficients of long term cointegration relation between variables are investigated by FMOLS method. According to the result, the elasticity coefficient is found as 0.58. As a result, one percent increase in Agricultural Research and Development expenditures leads to 0.58 percent increase in Agricultural Total Factor Productivity. These results justify that an increase in R&D expenditures to improve the long-run TFP growth in the agricultural sector.
Research and development expenditures are beneficial in the agriculture sector as in the other sectors. Countries that allocate a significant share of their budgets to R&D expenditures can increase total factor productivity in agriculture. Also, they can be successful by supporting the private sector. Since effects of R&D expenditures on productivity arise in the long run countries or policymakers may need to wait for many years.
References
Agricultural Science and Technology Indicators (ASTI, 2018). Retrieved from www.asti.cgiar.org.
Alene, A.D. (2010). “Productivity growth and the effects of R&D in African agriculture”, Agricultural Economics, 41, 223–238.
Alston, J.M., Chan-Kang, C., Marra, M.C., Pardey, P.G. and Wyatt, T.J. (2000). A Meta-Analysis of Rates of Return to Agricultural R&D: Ex Pede Herculem? Washington D.C.: IFPRI Research Report No 113.
Breusch, T., and A. Pagan (1980). “The lagrange multiplier test and its application to model specification in econometrics”, Review of Economic Studies, 47, 239– 253.
Chen, P. C., Yu, M. M., Chang, C. C., and Hsu, S. H. (2008). “Total factor productivity growth in China's agricultural sector”, China Economic Review, 19(4), 580-593. doi:https://doi.org/10.1016/j.chieco.2008.07.001
Cox, T., Mullen, J. and Hu, W.S. (1997). “Nonparametric measures of the impact of public research expenditures on Australian broadacre agriculture”,
Australian Journal of Agricultural and Resource Economics, 41, 333–360.
Evenson, R. E., Pray, C. E., and Rosegrant, M. W. (1999). Agricultural research and productivity growth in India, Research Report, 109. Washington: IFPRI. FAO. (2017). The future of food and agriculture – Trends and challenges. Rome. Fuglie, K.O., MacDonald, J.M., and Ball, E. (2007). Productivity growth in U.S.
agriculture, United States Department of Agriculture – Economic Research Service (USDA – ERS), Economic Brief Number 9.
Khundrakpam, J.K. and Ranjan, R. (2010). “Saving-investment nexus and international capital mobility in India: Revisiting Feldstein-Harioka hypothesis”, Indian Economic Review, New Series, Vol. 45, No. 1, 49-66. Ludena, C. (2010). “Agricultural productivity growth, efficiency change and technical
progress in Latin America and the Caribbean”. Inter-American Development
Bank, Working Paper Series No. 186, Washington DC..
Lusigi, A. and Thirtle, C. (1997). “Total factor productivity and the effects of R&D in African Agriculture”, Journal of International Development, Vol. 9, No. 4, 529-538.
McAtee, W. (1936). “The Malthusian Principle in Nature”. The Scientific Monthly, 42(5), 444-456. Retrieved from http://www.jstor.org/stable/15956.
Mullen, J.D. and Cox, T.L. (1995). “The returns from research in Australian broadacre agriculture”, Australian Journal of Agricultural Economics, 39, 105–128. Nin-Pratt, A., Falconi, C., Ludena, C.E., and Martel, P. (2015). “Productivity and the
performance of agriculture in Latin America and the Caribbean: from the lost decade to the commodity boom”. Inter-American Development Bank, Working Paper No. 608 (IDB-WP-608), Washington DC..
OECD (2015). Frascati Manual 2015: Guidelines for Collecting and Reporting Data on Research and Experimental Development, OECD Publishing, Paris. http://dx.doi.org/10.1787/9789264239012-en
Pedroni, P. (2000). “Fully-modified OLS for heterogeneous cointegrated panels”,
Advances in Econometrics, 15, 93-130.
Pesaran, M. H. (2007). A simple panel unit root test in the presence of cross-section dependence. J. Appl. Econ., 22: 265–312. doi: 10.1002/jae.951
Phillips, P., and Hansen, B. (1990). “Statistical inference in instrumental variables regression with I (1) processes”, Review of Economic Studies, Vol. 57, Issue: 1, 99–125.
Salim, R. A., and Islam, N. (2010). “Exploring the impact of R&D and climate change on agricultural productivity growth: the case of Western Australia”, The
Australian Journal of Agricultural and Resource Economics, 54, 561–582.
Singh, R.B., Kumar, P., and Woodhead, T. (2002). Smallholder farmers in India: food
security and agricultural policy, FAO Regional Office for Asia and the
Pacific, RAP publication: 2002/03.
Suphannachart, W. and Warr, P. (2011). “Research and productivity in Thai agriculture”, Australian Journal of Agricultural and Resource Economics, 55: 35–52. doi: 10.1111/j.1467-8489.2010.00519.x.
The World Bank (2018), Population indicators. Retrieved from https://data.worldbank.org/indicator/SP.POP.TOTL
United States Department of Agriculture – Economic Research Service (USDA – ERS, 2018), International Agricultural Productivity (Data set). Retrieved from www.ers.usda.gov.
USDA (2012). Total factor productivity has become the primary source of growth in world agriculture. Retrieved from https://www.ers.usda.gov/data-products/chart-gallery/gallery/chart-detail/?chartId=76219
Westerlund, J. (2008). Panel cointegration tests of the Fisher effect, Journal of
Applied Econometrics, 23: 193 233.
Zereyesus, Y.A., Dalton, T.J. (2017) “Rates of return to sorghum and millet research investments: A meta-analysis”. PLoS ONE 12(7): e0180414. https://doi.org/10.1371/journal.pone.0180414