EVALUATION OF PORTFOLIO PERFORMANCE
OF TURKISH INVESTMENT FUNDS
Cudi Tuncer GÜRSOY
Doğuş University
Y. Ömer ERZURUMLU
Doğuş University
ABSTRACT: This article attempts to measure performances of Type A and Type B
funds relative to T-Bill rates and ISE-100 index in Turkey over the period of January 1998-June 2000 using Sharpe, Treynor, Jensen, and Graham&Harvey indices. 55 Type A, and 77 Type B Funds were included in the analysis. In order to test whether four different indices make similar ranking, Spearman rank correlation analysis was utilized. Secondly, Wilcoxon Signed-Rank test was applied to test the significance of the differences in Sharpe indices of alternative investment instruments included in the analysis.
Analysis revealed that different criteria rank the portfolios similarly. But more importantly it was found that, the best investment over the entire analysis period as well as in the sub-periods was T-Bills, which was followed by ISE-100 index, Type B Funds, and Type A funds respectively. This finding makes the merits of the efforts spent by funds managers, over the analysis period, to outperform the market highly questionable.
Key Words: Type A Funds, Type B Funds, Portfolio performance, Sharpe Index, Treynor Index, Jensen Criterion, Graham&Harvey Criterion , Portfolio Ranking ÖZET: Bu makale A ve B tipi fonların 1998 0cak-2000 Haziran dönemindeki per
formanslarını, Sharpe, Treynor, Jensen ve Graham&Harvey kriterlerini kullanarak Hazine bonosu ve İMKB-100 indeksine kıyasla ölçümlemeyi amaçlamaktadır. Ana lize 55 A Tipi, 77 B tipi fon dahil edilmiştir. Bu kriterlerin fonları aynı şekilde sıra layıp sıralamadığını görmek için Spearman dizi korelasyonundan yararlanılmıştır. İkinci olarak, dört farklı yatırım aracının ortalama Sharp katsayılarının birbirinden anlamlı ölçüde farklı olup olmadığı Wilcoxon İşaretli Sıra testiyle irdelenmiştir. Yapılan analizler portföy performansını değerlendirmede kullanılan dört kriterin fonları benzer şekilde sıraya koyduğunu göstermiştir. Ama daha önemlisi, gerek tüm analiz döneminde gerekse alt dönemlerde hazine bonosunun en iyi yatırım aracı ol duğu, onu sırasıyla İMKB-100 endeksi, B Tipi fon ve A Tipi fonun izlediği görül müştür. Bu sonuç, fon yöneticilerinin, analiz dönemi boyunca, pazar ortalamasından daha iyi fonlar oluşturma çabalarının yararı konusunda kuşku yaratmaktadır.
Anahtar Kelimeler: A Tipi Fon, B Tipi Fon, Fon performansı, Sharpe indeksi, Treynor indeksi, Jensen kriteri, Graham&Harvey kriteri, Portföy sıralaması
Cudi Tuncer Gursoy, Y. Omer Erzurumlu 44
I. INTRODUCTION
This paper aims at :
a) measuring portfolio performance of Type-A and Type-B investment funds in Turkey with alternative indices over the period of January 1, 1998 - June 30, 2000,
b) testing whether alternative evaluation criteria give similar results,
c) comparing portfolio performances of Type A and Type B funds with those of T- Bills , and ISE-100 in order to see the significance of the differences over the same period.
Before 1960, investors evaluated portfolio performance almost entirely on the rate of return, although they knew that risk was a very important variable in determining investment success. The reason for omitting risk was the lack of knowledge how to measure and quantify it. After the development of portfolio theory in early 60s, and CAPM in subsequent years, risk, measured as either by standard deviation or beta, was included in evaluation process. However, since there was not a single measure combining both return and risk, two factors were to be considered separately: Researchers grouped portfolios into similar risk classes and compared rates of return of portfolios in the same risk class.
Treynor (1965) was the first researcher developing a composite measure of portfolio performance. He measures portfolio risk with beta, and calculates portfolio’s market risk premium relative to its beta:
Ti = ( Rp- Rf) / pp (1)
Where:
Ti = Treynor’s performance index
Rp = Portfolio’s actual return during a specified time period Rf = Risk-free rate of return during the same period Pp = beta of the portfolio
Whenever Rp> Rf and Pp > 0 a larger T value means a better portfolio for all investors regardless of their individual risk preferences. In two cases we may have a negative T value: when Rp < Rf or when Pp < 0. If T is negative because Rp < Rf, we judge the portfolio performance as very poor. However, if the negativity of T comes from a negative beta, fund’s performance is superb. Finally when Rp- Rf, and Pp are both negative, T will be positive, but in order to qualify the fund’s performance as good or bad we should see whether Rp is above or below the security market line pertaining to the analysis period (Reilly, 1992).
Sharpe (1966) developed a composite index which is very similar to the Treynor measure, the only difference being the use of standard deviation, instead of beta, to measure the portfolio risk:
Si = ( Rp- R f) / Op (2)
Where:
Si = Sharpe performance index Op = Portfolio standard deviation
This formula suggests that Sharpe prefers to compare portfolios to the capital market line(CML) rather than the security market line(SML). Sharpe index, therefore, evaluates funds performance based on both rate of return and diversification (Sharpe 1967). For a completely diversified portfolio Treynor and Sharpe indices would give identical rankings.
Jensen (1968), on the other hand, writes the following formula in terms of realized rates of return, assuming that CAPM is empirically valid:
Rjt = Rf + pj (Rm - Rf ) + ujt
Subtracting Rf from both side he obtains: Rj t - Rf = Pj (Rm - Rf ) + ujt
This formula says that risk premium earned on j th portfolio is equal to the market risk premium times Pj plus a random error term. In this form, one would not expect an intercept for the regression equation, if all securities are in equilibrium. But if certain superior portfolio managers can persistently earn positive risk premiums on their portfolios, the error term ujt will always have a positive value. In such a case, an intercept value which measures positive differences from the model must be included in the equation as follows:
Rjt - Rf = aj + Pj (Rm - Rf) + ujt
Jensen uses aj as his performance measure. A superior portfolio manager would have a significant positive aj value because of the consistent positive residuals. Inferior managers, on the other hand, would have a significant negative aj. Average portfolio managers having no forecasting ability but, still, cannot be considered inferior would earn as much as one could expect on the basis of the CAPM. The residual terms would randomly be positive and negative, and this would give an intercept value which is insignificantly different from zero.
Jensen performance criterion, like the Treynor measure, does not evaluate the ability of portfolio managers to diversify, since the risk premiums are calculated in terms of P.
Cudi Tuncer Gursoy, Y. Omer Erzurumlu 46 Graham & Harvey (1997) recently suggested that performance of a portfolio should be measured by its excess return over the return of a "market index/risk-free-asset combination" with a standard deviation equal to that of the portfolio. Therefore, if the standard deviation of a portfolio is different from the market standard deviation, the latter must be increased or decreased to the level of portfolio standard deviation by forming an appropriate combination of market index and risk-free-asset. Assuming a market return of 15 %, with a standard deviation of 20 %; a portfolio return of 25 % with a standard deviation 40 %, and a risk-free rate of 10 %, Graham&Harvey would make 100 % levered portfolio of which standard deviation is also 40 % (-1 * 0 + 2 * 0.2) . Since the return of this combination would be 20 % (2*0.15 - 1* 0.10) , excess return of the portfolio would be measured as 5 % (25 % - 20 %) . The higher the excess return, the better the portfolio performance.
II. EVALUATION OF TYPE A AND TYPE B FUNDS IN TURKEY 2.1) Research Data
Data used in this research includes:
a) weekly returns of Type A and Type B funds b) weekly returns on T-Bills
c) weekly returns on Istanbul Stock Exchange 100 index(ISE-100) over the analysis period.
Weekend prices of all existing funds(55 Type A, and 77 Type B Funds) were obtained from Capital Markets Board (CMB) statistics, and the weekly returns were calculated thereupon. Type A funds are those which include a stocks component of minimum 25 %. Type B funds, on the other hand, are various combinations of T-Bills, Repos and other low-risk instruments.
Weekly returns on Turkish T-Bills were calculated based on the T-Bill prices obtained from ISE taking the days to maturity into consideration. The resulting figure, therefore, is an overall average of the returns of all outstanding T-Bills of different maturities.
Weekly returns on iSE-100 index, on the other hand, were calculated based on the index values obtained from Metastock database.
Averages, standard deviations, and beta coefficients of weekly portfolio returns, T- Bill rates and ISE-100 index were calculated for the entire period as well as the sub-periods of 1998, 1999, and first half of 2000. Dividends were ignored in beta calculations.
2.2) Research Methodology
Treynor, Sharpe, Jensen and Graham-Harvey indices were calculated for each "Type A" and "Type B" fund as well as the ISE-100 index, based on the formulas and explanations given in I above. Then, the portfolios were ranked according to their performance indicators.
In order to test whether the four different methods rank the portfolios similarly, Spearman rank correlation coefficients were calculated for each pair of ranking criteria. In order to compare portfolio performances of Type A and Type B funds with those of T-Bills , and ISE-100, average Sharpe coefficients of Type A and Type B funds and ISE-100 index were compared and the statistical significance of the differences were tested with Wilcoxon Signed-Rank Test.
2.3) Research Findings
2.3.1) R isk Premiums
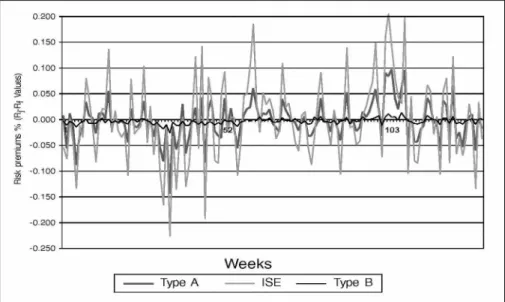
Figure 1 depicts the behaviour of average weekly risk premiums (Rj - R f) on Type A funds, Type B funds and the ISE-100 index. Under normal capital market conditions these risk premiums would always be expected to be positive. But, this was not the case in Turkey over the analysis period. Negative risk premiums mean that T-Bills were a better investment than the other three instruments in almost half of the observation periods. This is obviously the financial market implication of unfavourable macroeconomic conditions prevailing in Turkey over those years.
Figure 1 Risk Premiums
Cudi Tuncer Gürsoy, Y. Ömer Erzurumlu 48 Figure 1 permits us to make following observations as well:
a) Type B funds were not a good investment at all. Their average risk premium was negative, but their variation was greater than zero.
b) Type A funds were successful in reducing the portfolio risk below the market risk. However their risk premiums were below the market risk premium. Therefore the rationale of Type A funds can be commented upon only after evaluating them against ISE index with the criteria defined in I. This will be done below.
c) Type A funds have provided higher risk premiums than Type B funds as expected.
2.3.2) Portfolio Rankings
Type A and Type B funds were ranked according to Sharpe, Treynor, Jensen, and Graham&Harvey criteria, and Spearman rank correlation coefficients were calculated for each pair of indices. The results are summarized in Table 1.
In Type A funds , the calculated "Spearman r"s for the entire period as well as the three sub-periods are quite high and significant at 1% a level. This means that index used in evaluating Type A funds does not matter.
In Type B funds Spearman rank correlation coefficients are much lower. But they are still significant at 1% a level in 18 cases, at 5 % a level in 3 cases, and at 10 % a level in 1 case. Only in two cases in Year 1999, r was found insignificant.
Table 1
Results of "Spearman R" Correlation Analysis
Type A Funds Type B Funds
Spearman R
T Value Spearman R
T Value
Entire Period S & T 0.8826 13.80 *** 0.4141 3.94 *** S & J 0.9372 19.74 *** 0.4754 4.68 *** S & GH 0.9494 22.22 *** 0.5052 5.07 *** T & J 0.8906 14.39 *** 0.3017 274 *** T & GH 0.8891 14.28 *** 0.2834 2.56 ** J & GH 0.9921 58.01 *** 0.9959 95.33 *** 1998 S & T 0.9285 18.38 *** 0.8107 11.99 *** S & J 0.7624 8.66 *** 0.2252 2.00 ** S & GH 0.9640 26.66 *** 0.6578 8.00 *** T & J 0.8451 11.62 *** 0.2902 2.63 ** T & GH 0.9118 16.32 *** 0.5560 579 *** J & GH 0.8234 10.66 *** 0.7554 9.98 *** 1999 S & T 0.9380 19.89 *** 0.0052 0.04 S & J 0.9336 19.15 *** 0.4281 4.10 *** S & GH 0.9452 21.27 *** 0.075 0.65 T & J 0.9714 30.04 *** 0.5288 5.40 *** T & GH 0.8343 11.12 *** 0.4818 4.76 *** J & GH 0.8612 12.45 *** 0.7413 9.56 ***
Table 1 (cont.)
Type A Funds Type B Funds
Spearman R T Value Spearman R T Value 2000/I S & T 0.9976 106.04 *** 0.2005 1.77 * S & J 0.9304 18.66 *** 0.6095 6.66 *** S & GH 0.9711 29.89 *** 0.7094 8.82 *** T & J 0.9303 18.64 *** 0.3339 3 07 *** T & GH 0.9710 29.82 *** 0.3568 3.31 *** J & GH 0.9714 30.08 *** 0.9122 19.28 *** *, **, * * * in d ica tes sig n ifica n ce a t 1 0 , 5 ,1 % sig n ifica n ce le v e l re sp ective ly u sin g tw o -ta ile d test.
2.3.3 ) Comparison o f Sharpe Indices
Having seen that it is highly correlated with other indices , and given the fact that it measures the success in diversification as well, the Sharpe index was chosen to compare the performances of alternative investment media included in the research. Weekly Sharpe indices of T-Bills, Type A Funds, Type B Funds and ISE-100 index are graphed in Figure 2. Sharpe index for T-Bills is zero by definition, and coincides with X axis. For other instruments, a negative Sharpe index means that return on the instrument is less than T-Bill rate. Figure 2 indicates that there are as many negative Sharpe indices as positive ones, and this is against the expectation.
2 .5 0 0 2 .0 0 0 1.500 1.000 „ 0 .5 0 0 £Z : i 0.000 œ <3 -0 .5 0 0 œ c5 -1 .0 0 0 .c œ -1 .5 0 0 -2 .0 0 0 -2 .5 0 0 -3 .0 0 0 -3 .5 0 0
ISE --- Type B ---Type A
T i l
CO onrflf
Weeks
Figure 2 Sharpe CoefficientsCudi Tuncer Gürsoy, Y. Ömer Erzurumlu 50 Averages of weekly Sharpe indices of the four categories are given in Table 2.
Table 2
Average Sharpe Index Entire Period 1998 1999 2000/I T-Bills 0 0 0 0 ISE-100 Index -0.02 -0.29 0.27 -0.11 Type A Funds -0.45 -0.77 -0.23 -0.27 Type B Funds -0.09 -0.36 0.20 -0.15
According to Table 2, for the entire period as well as the years 1998 and 2000/1, T- Bill was the best investment, followed by ISE-100 index, Type B funds and Type A funds respectively. Only in 1999, performances of ISE-100 and Type B funds were superior to T-Bill. The sign and rank of Type A funds, however, remained to be same. Table 3 shows the number of Type A funds with Sharpe coefficients greater than that of ISE-100 index. The figures on the diagonal of the matrix represents the total number of Type-A funds that exceeded ISE-100 in Sharpe coefficient. Other figures in the same row tells us how many of them were better than ISE-100 in other periods as well. For example in the entire period 7 Type A funds performed better than ISE-100. Of this 7, 2 in 1998, 4 in 1999, 6 in 2000/I also outperformed ISE-100.
Table 3
Number of Type A funds That Performed Better Than ISE-100 Entire Period 1998 1999 2000/I Entire Period 7 2 4 6 1998 2 6 1 3 1999 4 1 9 7 2000/I 6 3 7 24
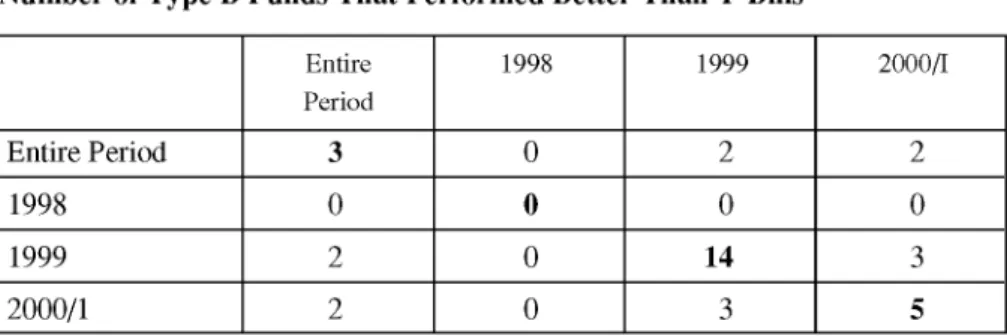
Table 3 figures are not promising with respect to the performance of Type A funds. Table 4, on the other hand, provides information on Type B funds which outperformed T-Bills:
Table 4
Number of Type B Funds That Performed Better Than T-Bills
E ntire P eriod 1998 1999 2 000/I Entire Period 3 0 2 2 1998 0 0 0 0 1999 2 0 14 3 2000/1 2 0 3 5
Table 4 is a reflection of poor performance of Type B funds over the analysis period as well as in the sub-periods.
In order to see whether the average Sharpe indices of the four investment alternatives given in Table-2 were significantly different from each other, the standard Z test was applied to the calculated Wilcoxon’s W statistics. The findings are summarized in Table - 5 .
Table 5
Z Test Results For The Significance of Sharpe Index Mean Differences
IS E -1 0 0 / T-B ill Type A / T-B ill T ype B / T-Bill Type A / ISE -100 T ype B / ISE -100 T ype A / T ype B
Entire Mean Difference - 0 . 0 2 -0.45 -0.09 -0.43 -0.07 -0.36
Z-Statistics 0.57 7.85*** 1.26 5.56*** 1.84* 6.1***
1988 Mean Difference -0.29 -0.77 -0.36 -0.48 -0.07 -0.41
Z-Statistics 2.05** 6.24*** 2.62*** 3.88*** 0.80 4.30***
1999 Mean Difference 0.27 -0.23 0 . 2 0 -0.50 -0.07 -0.43
Z-Statistics 1.74* 3.40*** 1.35 4.07*** 1.51 4.78***
2000/I Mean Difference -0 .1 1 -0.27 -0.15 -0.16 -0.04 -0 . 1 2
Z-Statistics 0.82 27 9*** 1.04 0.82 0.93 0.58
*, **, * * * in d ica tes sig n ifica n ce a t 1 0 , 5 ,1 % sig n ifica n ce le v e l re sp ective ly u sin g tw o -ta ile d
Cudi Tuncer Gürsoy, Y. Ömer Erzurumlu 52 Table 5 permits the following comments:
a) For the entire analysis period, and in Years 1988 and 1999 the differences between the Sharpe coefficients are statistically significant. This means that performance ranking in Table 2, which is against the expectations under normal capital market conditions, is dependable. Only two observations, both in 1999, are in line with expectations of capital market theory: In that year ISE-100 performed better than Type B funds, and Type B funds better than T-Bills. However the differences between Type B funds, T-Bills and ISE-100 index and Type B funds were not found to be statistically significant. The difference between ISE-100 and T-Bills, on the other hand, is significant at 10% a level. b) Table-2 ranking is valid in 2000 as well, but Z-values are insignificant except the
one pertaining to Type A funds- T-Bills difference.
III. CONCLUSION
Portfolio performances of Type A and Type B funds were measured by the methods suggested by Sharpe, Treynor, Jensen, and Graham&Harvey . Using Spearman Rank Correlation Test it was found that these methods rank Type A funds in the same manner. In Type B funds rank correlation coefficients were lower, but still statistically significant.
Relative performances of T-Bills, Type B funds, ISE-100 index and Type A funds were measured through the Sharpe index. It was found that, over the entire analysis period as well as in the three sub-periods T-Bills were the best investment. It was followed by ISE-100 index, Type B funds and Type A funds respectively. The dependability of this ranking was tested through standard Z test applied to Wilcoxon Signed-Rank Test Statistic calculated for each pair of investment media included in the analysis over the entire period and for each of the sub-periods. Z test gave supportive results.
Therefore, it was concluded that the efforts to form Type A and Type B funds in expectation of reaching superior performance to T-Bills, and ISE-100 index totally failed over the analysis period. This is interpreted as the financial market implication of adverse macroeconomic conditions prevailing in the country during the same period.
REFERENCES
FARRAR, E.D. and L. J. TREYNOR (1968). "Problems in Selection of Security Portfolios: Discussion", Journal o f Finance Vol.23, Issue 2, (May), 417-419. GRAHAM, J. R. and C. R. HARVEY (1997). "Market Timing Ability and Volatility Implied Investment Newsletters’ Asset Allocation Recommendations" Journal o f
JENSEN, M. (1968). "The Performance of Mutual Funds in the Period 1945- 1964",
Journal o f Finance 23, No 2 ( May) : 389-416.
REILLY, F. R. (1992). Investments, The Dryden Press, Fort Worth, p. 620.
SHARPE, W. F. (1966). "Mutual Fund Performance", Journal o f Business, No 1, Part 2 (January): 119-138.
SHARPE, W. F. (1967). "Portfolio Analysis", Journal o f Financial and Quantitative
Analysis, Vol. 2, Issue.2 (June), 76-84.
TREYNOR J. L. (1965). "How To Rate Management of Investment Funds",
Harvard Business Review, (January-February) : 63-75.
1998 1999 2000 Entire Period Return StdDev Beta Return StdDev Beta Return StdDev Beta Return StdDev Beta Treasury Fund 0.018 0.003 0.000 0.015 0.002 -0.004 0.008 0.001 0.002 0.015 0.005 -0.001 IS E-100 Index -0.004 0.080 1.000 0.036 0.071 1.000 0.001 0.078 1.000 0.013 0.078 1.000 Type A Funds
ABN Amro A. Alarko Special 0.010 0.025 0.286 0.020 0.021 0.273 0.009 0.035 0.423 0.014 0.027 0.308 ABN Amro A. Alarko Mixed 0.007 0.037 0.412 0.021 0.036 0.436 0.005 0.046 0.529 0.012 0.039 0.441 Altematifbank A. Variable 0.003 0.038 0.399 0.021 0.033 0.357 0.003 0.044 0.483 0.010 0.038 0.406 Ata Yatırım A. Mixed 0.007 0.035 0.401 0.022 0.028 0.357 0.004 0.027 0.310 0.012 0.032 0.370 Ata Yatırım A. Stock 0.001 0.063 0.730 0.031 0.057 0.765 0.002 0.070 0.824 0.013 0.064 0.763 Bank Ekspres A. Variable 0.005 0.044 0.383 0.026 0.032 0.376 0.008 0.097 0.800 0.014 0.055 0.469 Commercial Union. A. Variable 0.008 0.039 0.364 0.026 0.035 0.386 0.008 0.037 0.428 0.015 0.038 0.390 Demir Yatirim. A. Variable 0.007 0.048 0.501 0.032 0.054 0.701 0.006 0.062 0.739 0.017 0.054 0.623 Demirbank. A. Variable 0.004 0.045 0.462 0.030 0.050 0.653 0.006 0.063 0.728 0.015 0.052 0.589 Eczacibasi Men.Deg. A. Variable 0.013 0.023 0.242 0.028 0.043 0.543 0.011 0.042 0.455 0.019 0.037 0.394 Eczacibasi AXA. A. Variable 0.002 0.011 0.032 0.004 0.009 0.004 0.003 0.007 -0.002 0.003 0.010 0.018 EGS Bank. A. Mixed 0.005 0.038 0.432 0.022 0.034 0.404 0.004 0.036 0.424 0.012 0.037 0.421 EsbankA. Variable -0.002 0.087 0.766 0.009 0.035 0.366 0.000 0.051 0.577 0.003 0.063 0.566 Finansbank. A. Variable 0.004 0.032 0.324 0.018 0.022 0.282 0.000 0.060 0.660 0.009 0.037 0.380 Garanti Bankası. A. Mixed 0.010 0.025 0.274 0.020 0.024 0.295 0.005 0.025 0.290 0.013 0.025 0.286 Garanti Bankası. A. Variable 0.002 0.041 0.394 0.023 0.035 0.443 0.005 0.042 0.508 0.011 0.040 0.440 Global Men. Dep. A. Variable 0.012 0.039 0.375 0.028 0.061 0.511 0.009 0.030 0.362 0.018 0.048 0.421 Hak Menkul Kiy. A. Variable 0.003 0.035 0.369 0.018 0.023 0.268 0.005 0.042 0.480 0.010 0.033 0.357 Halkbank. A. Mixed 0.008 0.034 0.297 0.021 0.029 0.352 0.001 0.034 0.375 0.012 0.033 0.336 İktisat Bankasi. A. Variable 0.000 0.155 0.610 0.017 0.037 0.389 0.004 0.042 0.488 0.008 0.102 0.502 Interbank A.$. A. Variable 0.008 0.024 0.268 0.028 0.036 0.432 0.001 0.040 0.472 0.015 0.035 0.379 Interbank A. $. A. Mixed 0.010 0.027 0.281 0.032 0.065 0.321 0.000 0.043 0.407 0.017 0.036 0.396 Inter Yatirim Men.Dep. A. Stock 0.005 0.044 0.491 0.029 0.049 0.477 0.001 0.048 0.589 0.014 0.048 0.515 1$ Bankası. A. Owner. Interest -0.001 0.051 0.568 0.029 0.049 0.552 0.002 0.056 0.657 0.011 0.053 0.591
pö <T> <T> *1 o 5T ö > -o -O<T> S a K' L /l 4^ C u di T un cer G ü rs o y , Y . Ö m er E rz u ru m lu
Return StdDev Beta Return StdDev Beta Return StdDev Beta Return StdDev Beta i$ Bankası. A. Stock -0.003 0.043 0.465 0.027 0.041 0.514 -0.003 0.041 0.437 0.009 0.044 0.495 iş Bankası. A. Variable 0.007 0.027 0.309 0.022 0.028 0.366 0.004 0.037 0.428 0.012 0.031 0.357 Is Yatırım. A. Variable 0.007 0.027 0.302 0.024 0.032 0.411 0.006 0.040 0.480 0.014 0.033 0.381 Kapital. A. Variable 0.003 0.040 0.355 0.022 0.042 0.426 0.002 0.081 0.936 0.010 0.052 0.500 Koç Allianz. A. Insurance 0.005 0.031 0.197 0.024 0.026 0.305 0.008 0.052 0.642 0.013 0.035 0.336 Koçbank. A. Stock 0.000 0.046 0.483 0.029 0.043 0.555 0.000 0.059 0.700 0.012 0.049 0.564 Koçbank. A. Variable 0.004 0.034 0.380 0.022 0.030 0.375 0.005 0.030 0.357 0.012 0.032 0.378 Nurol Men. Kıy. A. Variable 0.007 0.031 0.333 0.023 0.045 0.485 0.008 0.036 0.391 0.014 0.039 0.400 Osmanlı Bankası. A. Mixed 0.008 0.025 0.282 0.019 0.023 0.310 0.004 0.026 0.312 0.012 0.025 0.299 Strateji Men. Deg. A. Variable 0.009 0.026 0.293 0.030 0.043 0.486 0.006 0.067 0.807 0.017 0.045 0.473 Sümerbank. A. Mixed 0.004 0.045 0.465 0.023 0.025 0.307 0.001 0.039 0.459 0.011 0.038 0.414 Tacirler Men. Değ. AS. A. Mixed 0.005 0.041 0.432 0.018 0.025 0.294 0.007 0.038 0.398 0.011 0.035 0.373 TEBA. Variable 0.009 0.030 0.328 0.021 0.024 0.310 0.003 0.033 0.391 0.013 0.029 0.336 TEB. A. Mixed 0.005 0.038 0.415 0.024 0.032 0.397 0.006 0.044 0.523 0.013 0.038 0.435 TEB Yatırım A. Variable 0.009 0.028 0.312 0.021 0.022 0.272 0.005 0.030 0.359 0.013 0.027 0.310 Tekten Yat. Fin. Bank. A. Variable 0.002 0.053 0.544 0.019 0.021 0.217 0.004 0.025 0.298 0.009 0.038 0.380 Tekstilbank. A. Stock -0.004 0.046 0.479 0.024 0.046 0.517 0.005 0.062 0.718 0.009 0.051 0.548 Toprakbank A. Variable 0.007 0.035 0.374 0.020 0.029 0.358 0.004 0.029 0.353 0.012 0.032 0.363 Türk Dış.Tic.Bank.A. Variable 0.006 0.036 0.371 0.019 0.020 0.251 0.004 0.023 0.270 0.011 0.029 0.310 Türk Dış. Tic.Bank.A. Mixed 0.006 0.040 0.404 0.020 0.022 0.279 0.004 0.021 0.256 0.011 0.031 0.333 Türkiye Kalkınma Ba. A. Variable 0.002 0.038 0.435 0.019 0.025 0.308 0.003 0.030 0.345 0.009 0.033 0.375 Vakıflar Bankası. A. Stock 0.001 0.063 0.706 0.031 0.054 0.691 -0.001 0.062 0.765 0.013 0.061 0.718 Yapı Kredi Men. Deg. A. Textile -0.007 0.058 0.599 0.021 0.045 0.493 0.006 0.058 0.568 0.007 0.054 0.560 Yapı Kredi Men. Deg. A. Metal -0.006 0.069 0.779 0.034 0.058 0.710 0.013 0.071 0.832 0.014 0.067 0.774 Yapı Kredi Men. Deg. A. Fin. 0.002 0.083 0.952 0.033 0.063 0.837 -0.001 0.072 0.896 0.014 0.075 0.894 Yapı Kredi Men. Deg. A. Food 0.006 0.065 0.676 0.020 0.042 0.416 0.009 0.054 0.569 0.012 0.054 0.550 Yapı Kredi Men. Deg. A. Stock -0.003 0.074 0.862 0.027 0.045 0.566 0.006 0.052 0.636 0.011 0.061 0.711 Yapı Kredi Yatırım. A. Insurance 0.007 0.034 0.358 0.029 0.043 0.584 0.006 0.055 0.649 0.015 0.044 0.503 Yaşarbank. A. Variable -0.002 0.049 0.491 0.019 0.030 0.339 0.003 0.039 0.449 0.008 0.041 0.434 Yatırım Finansman A. Variable 0.007 0.024 0.281 0.023 0.031 0.395 0.001 0.043 0.502 0.012 0.032 0.371
Ev aluation of P ort fol io P e rf or m an c e of T u rk is h In v e st m e n t F u n d s
1998 1999 2000 Entire Period Return StdDev Beta Return StdDev Beta Return StdDev Beta Return StdDev Beta Ziraat Bankasi. A. Variable 0.005 0.036 0.381 0.020 0.027 0.337 0.006 0.038 0.462 0.011 0.034 0.382 TYPEB Funds
ABN Amro B. Variable 0.010 0.013 0.094 0.013 0.008 0.084 0.007 0.008 0.060 0.011 0.011 0.085 Akbank B. Bond 0.013 0.010 0.026 0.014 0.005 0.020 0.005 0.004 0.029 0.012 0.008 0.027 Akbank B. Variable 0.014 0.075 0.072 0.013 0.003 -0.002 0.006 0.002 0.006 0.012 0.047 0.033 Alfa Menkul Değ. B. Variable 0.012 0.011 0.058 0.014 0.006 0.014 0.005 0.023 0.165 0.012 0.013 0.066 Alternatifbank B. Foreign Sec. 0.009 0.011 0.034 0.010 0.013 0.047 0.007 0.012 0.018 0.009 0.012 0.035 Alternatifbank B. Variable 0.008 0.015 0.052 0.013 0.007 0.025 0.006 0.008 0.058 0.010 0.011 0.048 Ata Yatırım B. Bond 0.012 0.010 0.083 0.013 0.009 0.050 0.005 0.019 0.033 0.011 0.012 0.063 Bank Ekspres B. Variable 0.011 0.011 0.049 0.013 0.007 0.035 0.005 0.047 0.339 0.011 0.022 0.104 Bayındır Men. Deg. B. Variable 0.013 0.009 0.021 0.013 0.005 0.000 0.007 0.004 0.022 0.012 0.007 0.015 Demir Yat.Men.Deg. B. Variable 0.013 0.009 0.033 0.019 0.029 0.214 0.007 0.008 0.050 0.014 0.020 0.105 Demirbank B. Variable 0.012 0.008 0.022 0.016 0.024 0.168 0.005 0.016 0.172 0.012 0.018 0.107 Eczacibasi Men. Deg. B. Variable 0.013 0.004 0.016 0.013 0.005 0.010 0.006 0.006 0.024 0.012 0.006 0.018 Egebank. B. Variable 0.012 0.007 0.037 0.014 0.006 0.016 0.005 0.006 0.013 0.011 0.007 0.028 EGS Bank. B. Variable 0.013 0.016 0.125 0.015 0.013 0.068 0.005 0.015 0.170 0.012 0.015 0.114 Ekinciler Yatirim; B; Variable 0.010 0.009 0.067 0.015 0.010 0.050 0.008 0.007 0.051 0.012 0.010 0.063 Emlak Bankasi. B. Variable 0.014 0.011 0.078 0.017 0.011 0.057 0.007 0.008 0.076 0.014 0.011 0.074 Emlak Bankasi. B. Liguid 0.014 0.003 0.008 0.015 0.005 -0.010 0.006 0.002 0.003 0.013 0.005 0.005 Emlakbank. B. Bond 0.015 0.008 0.034 0.016 0.005 0.011 0.007 0.007 0.027 0.014] 0.007 0.027 EsbankB. Variable 0.005 0.023 0.217 0.012 0.009 0.082 0.002 0.027 0.286 0.007 0.020 0.185 Esbank. B. Liquid 0.006 0.040 0.333 0.014 0.011 0.048 0.005 0.004 -0.013 0.009 0.026 0.163 Finansbank. B. Bond 0.014 0.036 -0.045 0.013 0.011 0.052 0.007 0.006 0.050 0.012 0.024 0.011 Finansbank. B. Liquid 0.013 0.002 0.002 0.013 0.003 -0.008 0.006 0.004 -0.001 0.011 0.004 0.001 Finansbank. B. Variable 0.015 0.016 -0.013 0.015 0.011 0.053 0.007 0.009 0.067 0.014 0.013 0.029 Garanti Bankası. B. Bond 0.013 0.007 0.044 0.012 0.011 0.064 0.005 0.007 0.052 0.011 0.009 0.051 Garanti Bankası. B. Liquid 0.013 0.002 0.002 0.013 0.003 -0.005 0.006 0.004 0.000 0.012 0.004 0.002 Garanti Bankası. B. Variable 0.011 0.005 0.023 0.013 0.003 -0.005 0.006 0.004 0.001 0.011 0.005 0.012 Garanti Men. Kıy. B. Variable 0.012 0.005 0.010 0.011 0.007 0.028 0.006 0.004 -0.001 0.010 0.006 0.016 Halkbank. B. Bond 0.009 0.018 0.164 0.016 0.012 0.127 0.001 0.019 0.154 0.010 0.017 0.154 > ■o ■o fD s o. H' n o s Uı o\ C ud i T u nc er G ü rs o y , Y . Ö m er E rz u ru m lu
Return StdDev Beta Return StdDev Beta Return StdDev Beta Return StdDev Beta Halkbank. B. Variable 0.010 0.015 0.106 0.014 0.009 0.101 0.003 0.072 -0.112 0.011 0.034 0.065 İktisat Bankasi. B. Variable 0.010 0.008 0.035 0.001 0.001 0.002 0.007 0.005 0.010 0.006 0.007 0.004 İktisat Bankasi. B. Bond 0.011 0.010 0.060 0.010 0.010 0.043 0.005 0.012 0.099 0.009 0.010 0.059 Interbank A. Ş. B. Liquid 0.013 0.004 0.003 0.013 0.003 -0.004 0.006 0.002 -0.001 0.011 0.004 0.003 Interbank A. Ş. B. Variable 0.012 0.007 0.033 0.016 0.019 0.103 0.006 0.006 0.049 0.013 0.014 0.065 İsviçre Siq. B. Bond 0.014 0.008 0.034 0.013 0.009 0.034 0.006 0.005 0.021 0.012 0.008 0.032 iş Bankası. B. Foreign Sec. 0.009 0.006 0.017 0.011 0.007 0.033 0.003 0.018 0.028 0.009 0.010 0.029 İş Bankası. B. Bond 0.012 0.005 0.034 0.014 0.006 0.041 0.006 0.005 0.020 0.012 0.006 0.036 İş Bankası. B. Liquid 0.013 0.002 0.010 0.013 0.004 0.009 0.006 0.004 0.005 0.011 0.004 0.011 Kapital. B. Variable 0.014 0.013 0.032 0.015 0.006 0.020 0.004 0.010 0.078 0.012 0.011 0.446 Koçbank B. Variable 0.012 0.005 0.031 0.012 0.008 0.040 0.005 0.006 0.029 0.011 0.007 0.036 Koçbank. B. Bond 0.017 0.012 -0.016 0.018 0.013 0.035 0.008 0.006 0.048 0.016 0.012 0.041 Körfezbank. B. Variable 0.013 0.003 0.008 0.015 0.010 0.031 0.012 0.008 0.029 0.014 0.007 -0.032 Osmanh Bankası. B. Bond 0.013 0.005 0.026 0.011 0.013 0.098 0.005 0.006 0.052 0.010 0.010 0.062 OyakBank. B.Variable 0.012 0.006 0.038 0.013 0.003 -0.002 0.006 0.004 0.030 0.011 0.005 0.175 Pamukbank. B. Liquid 0.013 0.002 0.001 0.013 0.003 -0.005 0.007 0.004 0.000 0.012 0.004 0.061 Sınai Yatırım. B. Variable 0.013 0.007 0.056 0.017 0.009 0.075 0.010 0.011 0.094 0.014 0.009 0.356 Sümerbank. B. Variable 0.009 0.020 0.156 0.018 0.007 0.038 0.007 0.014 0.146 0.012 0.016 1.387 Sümerbank. B. Liquid 0.013 0.002 0.001 0.013 0.003 -0.003 0.006 0.004 0.000 0.012 0.004 0.542 Sümerbank. B. Bond 0.011 0.012 0.094 0.019 0.012 0.051 0.009 0.010 0.044 0.014 0.012 1.283 Şekerbank. B. Variable 0.011 0.007 0.050 0.013 0.004 0.006 0.007 0.005 0.008 0.011 0.006 0.739 Tacirler Men. Değ. B. Variable 0.014 0.008 0.029 0.020 0.021 0.184 0.002 0.030 0.304 0.014 0.020 1.200 Taib. B. Variable 0.010 0.016 0.063 0.016 0.012 0.089 0.006 0.015 0.137 0.012 0.015 0.749 Tarişbank. B. Variable 0.012 0.006 0.007 0.013 0.005 -0.003 0.007 0.004 -0.003 0.012 0.006 0.806 Tarişbank. B. Liquid 0.014 0.004 0.000 0.013 0.003 0.000 0.007 0.003 -0.003 0.012 0.004 0.798 TEB B. Variable 0.013 0.005 0.038 0.013 0.005 0.024 0.005 0.007 0.050 0.011 0.006 0.957 TSKB. B. Bond 0.007 0.022 0.201 0.012 0.025 0.001 0.002 0.008 0.049 0.008 0.022 0.250 Tekstilbank. B. Liquid 0.012 0.003 0.000 0.012 0.005 -0.010 0.006 0.002 -0.006 0.011 0.005 0.022 Tekstilbank. B. Variable 0.012 0.004 0.006 0.015 0.011 0.083 0.005 0.008 0.045 0.012 0.009 0.049 Toprakbank B. Variable 0.012 0.005 0.029 0.014 0.002 -0.001 0.007 0.005 0.002 0.012 0.005 0.045 Eva luation of P ort fol io P e rf o rm an c e of T u rk is h In v e st m e n t F u n d s
1998 1999 2000 Entire Period Return StdDev Beta Return StdDev Beta Return StdDev Beta Return StdDev Beta TSKB. B. Variable 0.014 0.003 0.010 0.015 0.041 0.024 0.005 0.010 0.096 0.012 0.027 0.145 Türk Dış. Tic. Bank. B. Variable 0.013 0.003 0.015 0.013 0.003 -0.001 0.006 0.004 0.013 0.012 0.005 0.526 Türkiye Kalkınma B. Variable 0.012 0.005 0.042 0.015 0.008 0.084 0.006 0.014 0.150 0.012 0.009 0.616 Vakıflar Bankası. B. Foreign Sec. 0.010 0.005 0.001 0.012 0.013 0.079 0.003 0.019 0.153 0.010 0.012 0.220 Vakıflar Bankası. B. Bond 0.012 0.014 0.102 0.013 0.008 0.069 0.005 0.011 0.104 0.011 0.012 0.675 Vakıflar Bankası. B. Liquid 0.013 0.002 0.002 0.013 0.003 -0.001 0.006 0.002 -0.004 0.012 0.003 0.098 Vakıflar Bankası. B. Mixed 0.011 0.011 0.093 0.016 0.017 0.206 0.005 0.017 0.200 0.012 0.016 0.732 Vakıflar Bankası. B. Variable 0.012 0.009 0.077 0.013 0.006 0.037 0.006 0.002 0.000 0.011 0.008 0.399 Yapı Kredi Men. Deg. B. Bond 0.012 0.011 0.086 0.012 0.051 -0.003 -0.003 0.028 0.259 0.009 0.036 0.521 Yapı Kredi B. Variable 0.009 0.015 0.096 0.012 0.008 0.035 0.003 0.013 0.094 0.009 0.013 0.186 Yapı Kredi B. Foreign Sec. 0.008 0.057 0.198 0.009 0.024 0.094 0.004 0.021 0.004 0.008 0.040 0.106 Yapı Kredi B. Liquid 0.013 0.003 0.001 0.013 0.003 -0.003 0.006 0.002 -0.005 0.012 0.004 0.036 Yapı Kredi B. Bond 0.011 0.012 0.094 0.013 0.011 0.064 0.004 0.015 0.086 0.010 0.013 0.322 Yaşarbank. B. Liquid 0.013 0.002 0.003 0.013 0.003 -0.002 0.005 0.002 -0.008 0.011 0.004 0.039 Yaşarbank. B. Variable 0.011 0.010 0.032 0.013 0.005 -0.007 0.005 0.003 0.012 0.011 0.007 0.058 Yatırım Finansman B. Variable 0.008 0.030 0.026 0.013 0.003 0.010 0.006 0.002 0.001 0.010 0.019 0.058 Ziraat B Variable 0.014 0.005 0.033 0.014 0.015 0.049 0.006 0.013 0.124 0.012 0.012 0.225 Ziraat B. Liquid 0.013 0.002 0.006 0.013 0.003 -0.003 0.006 0.003 -0.001 0.012 0.004 0.103 Ziraat Bankası. B. Bond 0.013 0.006 0.046 0.014 0.007 0.042 0.006 0.006 0.040 0.012 0.007 0.215
> ■o ■oCD S a H' n o S Ltı 00 C u di Tu nc er G ü rs o y , Y . Ö m er E rz u ru m lu