Tarım Bilimleri Dergisi
Tar. Bil. Der.Dergi web sayfası: www.agri.ankara.edu.tr/dergi
Journal of Agricultural Sciences
Journal homepage: www.agri.ankara.edu.tr/journal
TARIM BİLİMLERİ DERGİSİ
—
JOURNAL OF AGRICUL
TURAL SCIENCES
21 (2015) 483-491
Impacts of the Harran Plain Irrigation Projects on the Well-being of
Local Cotton Farmers Operating in the Sanliurfa Province of Turkey:
Income Distribution Revisited
Tamer ISGINa, Fatma Öcal KARAa
aHarran University, Faculty of Agriculture, Department of Agricultural Economics, Sanliurfa, TURKEY
ARTICLE INFO
Research Article
Corresponding Author: Tamer ISGIN, E-mail: [email protected], Phone: +90 (414) 318 37 18 Received: 05 June 2014, Received in Revised Form: 12 September 2014, Accepted: 01 October 2014
ABSTRACT
This paper aims to address the issue of income distribution among farm households growing cotton under the irrigated conditions of the Harran Plain located in the Sanliurfa Province. Comparing the results from ex-ante and ex-post distributional analyses, it is possible to determine the socio-economic impacts of the South Eastern Anatolia (GAP) Project on the well-being of these local cotton farmers. Results show that although in absolute terms the provision of Harran Plain irrigation projects has increased income of local cotton farmers, Gini ratio of 0.49 indicates that there has been uneven income distribution in the Harran Plain’s cotton sector. The most important factor affecting income distribution is determined to be how well or poor land under cotton is distributed among these local farmers.
Keywords: Cotton farm; Irrigation; Income distribution; Gini coefficient; Harran Plain; GAP project
Türkiye’de Şanlıurfa İli Harran Ovası Sulama Projelerinin Lokal Pamuk
Çiftçileri Refahına Etkileri: Gelir Dağılımı Konusuna Yeni Bir Ziyaret
ESER BİLGİSİ
Araştırma Makalesi
Sorumlu Yazar: Tamer IŞGIN, E-posta: [email protected], Tel: +90 (414) 318 37 18 Geliş Tarihi: 05 Haziran 2014, Düzeltmelerin Gelişi: 12 Eylül 2014, Kabul: 01 Ekim 2014
ÖZET
Bu araştırmayla hedeflenen amaç, Şanlıurfa İli Harran Ovası sulu şartlarında faaliyet gösteren pamuk çiftçileri arasındaki gelir dağılımının araştırılmasıdır. Proje öncesi ve sonrası karşılaştırmalar yapmak suretiyle, GAP projesinin sosyo-ekonomik sonuçlarının ortaya konması olasıdır. Araştırmadan elde edilen sonuçlara göre, Harran Ovası pamuk sektörünün, GAP projesiyle hayata geçirilen sulama imkânlarından genel anlamda olumlu bir şekilde etkilendiği ancak, bölgede pamuğa dayalı tarımsal gelirin halen adaletsiz bir şekilde dağılım gösterdiği, 0.49 olarak hesaplanan Gini oranı ile saptanmıştır. Bu dağılımda etkili faktörlerden en önemlisi ise, işletme arazilerinin büyüklük dağılımıdır.
Anahtar Kelimeler: Pamuk işletmesi; Sulama; Gelir dağılımı; Gini oranı; Etki analizi; Harran Ovası; GAP projesi © Ankara Üniversitesi Ziraat Fakültesi
Impacts of the Harran Plain Irrigation Projects on the Well-being of Local Cotton Farmers Operating in the Sanliurfa..., Isgın & Kara
1. Introduction
Located right in the heartland of the South Eastern Anatolia region lies one of the largest plains, namely the Harran Plain in the province of Sanliurfa-Turkey, which covers an area of 225109 hectares. While cotton production is prevalent in the Harran Plain agriculture, yield and quality factors are at low levels due to farmers’ inefficient production techniques, leading to negative impacts on farmer incomes (Isgin et al 2010). In 1995 an area of 20655 hectares on the Harran Plain was used to grow cotton, delivering a total of 82603.6 tonnes in production (Paksoy 2000). Compared to the area seeded with cotton and amount produced on the Harran Plain in 1995, these figures have multiplied over five times in 2008, reaching 113121 hectares in area and 435139 tonnes in production (MFAL 2010).
With the South Eastern Anatolia project, better known as the “GAP” in Turkish acronym, it was aimed to improve the welfare of local farmers and finally to facilitate the nation’s development. However, improving of welfare is not only related to per-capita income increase but also to how well it is distributed. There is understandable concern that income and even productivity growth on their own are very inadequate if the gains are realized only by households in the top half of the income distribution (Jayne et al 2003). It is well recognized that development is often associated with worsening income distribution as some people capture benefits and some others lose. For instance, irrigation brought in by a regional project may increase income of landowners but the introduction of machinery by the same project may throw landless laborers out of work. Thus income distribution among farm households is always seen as a matter that should be given considerations (Isgin & Forster 2003). Income inequality within the farm sector, however, has received little attention by researchers during the past decades. One reason behind this is the fact that there has not yet been a general theory developed about income distribution in spite of the latest improvements.
There exist two main reasons why agricultural economists should be interested in the distributional issues of income among individuals. The first reason is that it is important to better understand the factors behind the distribution of agricultural incomes and its change over time. The second reason is to specify explicitly the distributional impacts of public policies by comparing their distribution of benefits and costs with the initial farm income distribution (Witzke 1984).
Within this context, comparing the Gini coefficients calculated for Harran Plain farm households with those calculated for farmers of other regions, especially with those previously calculated for Harran Plain farmers will help better explain the distributional impacts of the GAP project on local farmers’ welfare, particularly the impacts of Harran Plain irrigation projects finalized in 1995. Thus the central goal in this research is to determine how equal or unequal incomes earned by Harran Plain cotton farmers are distributed in order to identify the distributional impacts of Harran Plain irrigation projects, which were a major deal through the GAP project. The analysis runs along similar lines to previous studies (Paksoy 2000; Isgin 2006) except for one major difference: a brand new data set is now available based on the outcome of an officially supported (TUBITAK) project and so this paper is a contiuation of earlier works on income distribution, in other terms, an old topic is revisited capitalizing on a new as well as more reliable data set.
2. Material and Methods
2.1. Data collection process and the material used The core materials of this research consist mainly of the information gathered using a data collection technique based on farmer registry information and monetary inducement systems, applied to a random sample of cotton farmers operating on the Harran Plain. The reason behind using this technique comes from the fact that farm level micro data collected from Turkish farm enterprises suffer from lack of information and even contain fallacious entries that can easily spoil the results from a survey.
Türkiye’de Şanlıurfa İli Harran Ovası Sulama Projelerinin Lokal Pamuk Çiftçileri Refahına Etkileri: Gelir Dağılımı..., Isgın & Kara
Participants of a survey usually have hard times to remember the numbers regarding their agricultural practices such as rates of fertilizers applied, amount of diesel fuel used, or labor costs incurred etc. Farmers are usually asked these questions relating to their farming practices occured in the past. So it is deemed urgent to minimize these flaws in surveys by some methods and applications.
Thus, a monetary inducement system was adopted in this work to provide the participant farmers with an incentive to fill out the diaries on a daily or at least weekly basis so as to accomplish the keeping of financial and production records with minimum information loss. To initiate this inducement a payment schedule was followed once our farmers have finished filling out the diaries at the end of the season. The main point to consider when diaries are prepared is that they must be easy to understand and simple to fill out with as little confusion as possible, yet detailed enough to cover all the production activities in cotton farming. 2.2. Methods used in designing the survey
In pursuit of the technical goals raised above, 126 participatory cotton farmers, selected using a stratified random sampling process, were supplied diaries to fill out begining the 2012 production season and later on these diaries were to be controlled by frequent visits to these farmers throughout the season. Depending on the location of the villages in which our farmers reside, 10-20 visits were made to every farm in the sample in order to collect reliable information on all inputs and outputs. Such a scheme adopted in this work resulted in sincere releationships established between the survey workers and the sampled farmers, which ultimately lead to a better farmer motivation in the survey. Hence running the risk of recording fallacious entries in the diaries was minimized.
The sampling was carried out using a two-step process. In the first step 51 villages were purposely selected, which are thought to be representative of the study area in terms of the topography, climate, and commonly applied farming techniques.The sample was drawn from a population of 1029 cotton
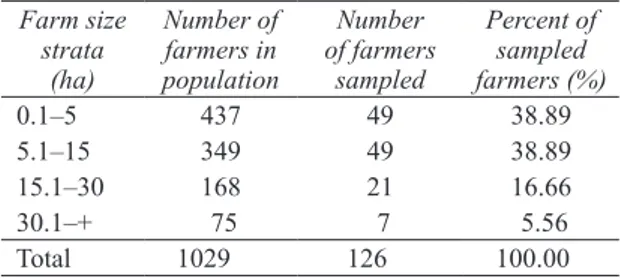
farmers operating on the Harran Plain. In the second step, the number of farmers to be supplied with the farmer diaries was determined to be 126 using a stratified random sampling design introduced by Yamane (1967) with a percentage allowable error margin of 5% taken throughout. Table 1 summarizes the sampling results for the study. To be representative of the total population, these sampled farmers were divided into four size strata. This process leads to a stratifying distribution, yielding 49, 49, 21, and 7 cotton farmers to be sampled in each size stratum, respectively.
Table 1- The population and the sample drawn
Çizelge 1- Anakitle ve çekilen örnek Farm size strata (ha) Number of farmers in population Number of farmers sampled Percent of sampled farmers (%) 0.1–5 437 49 38.89 5.1–15 349 49 38.89 15.1–30 168 21 16.66 30.1–+ 75 7 5.56 Total 1029 126 100.00
2.3. Methods used in measuring income inequalities
There are several ways to measure income disparities in Agriculture. Some of those are the share of aggregate income (Nelson 1994), the frequency distribution, and the Lorenz curve (Pen 1979) but the most common measure of relative income inequalities is the Gini-coefficient of concentration (Witzke 1984).
The Lorenz curve, devised by the American statistician Lorenz in 1905, is characterized by both axes equally long and enclosed by a square. It measures the relation between the percentage of income receiving units and the percentage of income. The Gini coefficient is the weighted sum of slopes of the Lorenz curve, and calculated based on data on an individual level. The model assumption is that the income vector y is arranged in a monotonically ascending (non-decreasing) order and then the Gini concentration ratio is mathematically defined as in Equation 1, 2 and 3.
Impacts of the Harran Plain Irrigation Projects on the Well-being of Local Cotton Farmers Operating in the Sanliurfa..., Isgın & Kara
3
farm in the sample in order to collect reliable information on all inputs and outputs. Such a scheme adopted in this work resulted in sincere releationships established between the survey workers and the sampled farmers, which ultimately lead to a better farmer motivation in the survey. Hence running the risk of recording fallacious entries in the diaries was minimized.
The sampling was carried out using a two-step process. In the first step 51 villages were purposely selected, which are thought to be representative of the study area in terms of the topography, climate, and commonly applied farming techniques.The sample was drawn from a population of 1029 cotton farmers operating on the Harran Plain. In the second step, the number of farmers to be supplied with the farmer diaries was determined to be 126 using a stratified random sampling design introduced by Yamane (1967) with a percentage allowable error margin of 5% taken throughout. Table 1 summarizes the sampling results for the study. To be representative of the total population, these sampled farmers were divided into four size strata. This process leads to a stratifying distribution, yielding 49, 49, 21, and 7 cotton farmers to be sampled in each size stratum, respectively.
Table 1- The population and the sample drawn
Çizelge 1- Anakitle ve çekilen örnek Farm size
strata (ha)
Number of farmers
in population Number of farmers sampled Percent of sampled farmers (%) 0.1 – 5 437 49 38.89 5.1 – 15 349 49 38.89 15.1 – 30 168 21 16.66 30.1 – + 75 7 5.56 Total 1029 126 100.00
2.3. Methods used in measuring income inequalities
There are several ways to measure income disparities in Agriculture. Some of those are the share of aggregate income (Nelson 1994), the frequency distribution, and the Lorenz curve (Pen 1979) but the most common measure of relative income inequalities is the Gini-coefficient of concentration (Witzke 1984).
The Lorenz curve, devised by the American statistician Lorenz in 1905, is characterized by both axes equally long and enclosed by a square. It measures the relation between the percentage of income receiving units and the percentage of income. The Gini coefficientis the weighted sum of slopes of the Lorenz curve, and calculated based on data on an individual level. The model assumption is that the income vector y is arranged in a monotonically ascending (non-decreasing) order and then the Gini concentration ratio is mathematically defined as in equation 1, 2 and 3.
CG Y
=
s−1(y z)`q (1)Y
sY
i i n=
=∑
1 , and (2) * n n . . . *i n n . . . *n n n − − − − − = − − − − z 2 1 1 1 2 1 1 2 1 1 = n i Y Y Y y . . . . . . 1
=
1
.
.
.
.
.
.
1
q
(3) (1) 3farm in the sample in order to collect reliable information on all inputs and outputs. Such a scheme adopted in this work resulted in sincere releationships established between the survey workers and the sampled farmers, which ultimately lead to a better farmer motivation in the survey. Hence running the risk of recording fallacious entries in the diaries was minimized.
The sampling was carried out using a two-step process. In the first step 51 villages were purposely selected, which are thought to be representative of the study area in terms of the topography, climate, and commonly applied farming techniques.The sample was drawn from a population of 1029 cotton farmers operating on the Harran Plain. In the second step, the number of farmers to be supplied with the farmer diaries was determined to be 126 using a stratified random sampling design introduced by Yamane (1967) with a percentage allowable error margin of 5% taken throughout. Table 1 summarizes the sampling results for the study. To be representative of the total population, these sampled farmers were divided into four size strata. This process leads to a stratifying distribution, yielding 49, 49, 21, and 7 cotton farmers to be sampled in each size stratum, respectively.
Table 1- The population and the sample drawn
Çizelge 1- Anakitle ve çekilen örnek Farm size
strata (ha)
Number of farmers
in population Number of farmers sampled Percent of sampled farmers (%) 0.1 – 5 437 49 38.89 5.1 – 15 349 49 38.89 15.1 – 30 168 21 16.66 30.1 – + 75 7 5.56 Total 1029 126 100.00
2.3. Methods used in measuring income inequalities
There are several ways to measure income disparities in Agriculture. Some of those are the share of aggregate income (Nelson 1994), the frequency distribution, and the Lorenz curve (Pen 1979) but the most common measure of relative income inequalities is the Gini-coefficient of concentration (Witzke 1984).
The Lorenz curve, devised by the American statistician Lorenz in 1905, is characterized by both axes equally long and enclosed by a square. It measures the relation between the percentage of income receiving units and the percentage of income. The Gini coefficientis the weighted sum of slopes of the Lorenz curve, and calculated based on data on an individual level. The model assumption is that the income vector y is arranged in a monotonically ascending (non-decreasing) order and then the Gini concentration ratio is mathematically defined as in equation 1, 2 and 3.
CG Y
=
s−1(y z)`q (1)Y
sY
i i n=
=∑
1 , and (2) * n n . . . *i n n . . . *n n n − − − − − = − − − − z 2 1 1 1 2 1 1 2 1 1 = n i Y Y Y y . . . . . .1
=
1
.
.
.
.
.
.
1
q
(3) , and (2) 3farm in the sample in order to collect reliable information on all inputs and outputs. Such a scheme adopted in this work resulted in sincere releationships established between the survey workers and the sampled farmers, which ultimately lead to a better farmer motivation in the survey. Hence running the risk of recording fallacious entries in the diaries was minimized.
The sampling was carried out using a two-step process. In the first step 51 villages were purposely selected, which are thought to be representative of the study area in terms of the topography, climate, and commonly applied farming techniques.The sample was drawn from a population of 1029 cotton farmers operating on the Harran Plain. In the second step, the number of farmers to be supplied with the farmer diaries was determined to be 126 using a stratified random sampling design introduced by Yamane (1967) with a percentage allowable error margin of 5% taken throughout. Table 1 summarizes the sampling results for the study. To be representative of the total population, these sampled farmers were divided into four size strata. This process leads to a stratifying distribution, yielding 49, 49, 21, and 7 cotton farmers to be sampled in each size stratum, respectively.
Table 1- The population and the sample drawn
Çizelge 1- Anakitle ve çekilen örnek Farm size
strata (ha)
Number of farmers
in population Number of farmers sampled Percent of sampled farmers (%) 0.1 – 5 437 49 38.89 5.1 – 15 349 49 38.89 15.1 – 30 168 21 16.66 30.1 – + 75 7 5.56 Total 1029 126 100.00
2.3. Methods used in measuring income inequalities
There are several ways to measure income disparities in Agriculture. Some of those are the share of aggregate income (Nelson 1994), the frequency distribution, and the Lorenz curve (Pen 1979) but the most common measure of relative income inequalities is the Gini-coefficient of concentration (Witzke 1984).
The Lorenz curve, devised by the American statistician Lorenz in 1905, is characterized by both axes equally long and enclosed by a square. It measures the relation between the percentage of income receiving units and the percentage of income. The Gini coefficientis the weighted sum of slopes of the Lorenz curve, and calculated based on data on an individual level. The model assumption is that the income vector y is arranged in a monotonically ascending (non-decreasing) order and then the Gini concentration ratio is mathematically defined as in equation 1, 2 and 3.
CG Y
=
s−1(y z)`q (1)Y
sY
i i n=
=∑
1 , and (2) * n n . . . *i n n . . . *n n n − − − − − = − − − − z 2 1 1 1 2 1 1 2 1 1 = n i Y Y Y y . . . . . .1
=
1
.
.
.
.
.
.
1
q
(3) (3)The box operator (
3
farm in the sample in order to collect reliable information on all inputs and outputs. Such a scheme adopted in this work resulted in sincere releationships established between the survey workers and the sampled farmers, which ultimately lead to a better farmer motivation in the survey. Hence running the risk of recording fallacious entries in the diaries was minimized.
The sampling was carried out using a two-step process. In the first step 51 villages were purposely selected, which are thought to be representative of the study area in terms of the topography, climate, and commonly applied farming techniques.The sample was drawn from a population of 1029 cotton farmers operating on the Harran Plain. In the second step, the number of farmers to be supplied with the farmer diaries was determined to be 126 using a stratified random sampling design introduced by Yamane (1967) with a percentage allowable error margin of 5% taken throughout. Table 1 summarizes the sampling results for the study. To be representative of the total population, these sampled farmers were divided into four size strata. This process leads to a stratifying distribution, yielding 49, 49, 21, and 7 cotton farmers to be sampled in each size stratum, respectively.
Table 1- The population and the sample drawn
Çizelge 1- Anakitle ve çekilen örnek Farm size
strata (ha)
Number of farmers
in population Number of farmers sampled Percent of sampled farmers (%) 0.1 – 5 437 49 38.89 5.1 – 15 349 49 38.89 15.1 – 30 168 21 16.66 30.1 – + 75 7 5.56 Total 1029 126 100.00
2.3. Methods used in measuring income inequalities
There are several ways to measure income disparities in Agriculture. Some of those are the share of aggregate income (Nelson 1994), the frequency distribution, and the Lorenz curve (Pen 1979) but the most common measure of relative income inequalities is the Gini-coefficient of concentration (Witzke 1984).
The Lorenz curve, devised by the American statistician Lorenz in 1905, is characterized by both axes equally long and enclosed by a square. It measures the relation between the percentage of income receiving units and the percentage of income. The Gini coefficientis the weighted sum of slopes of the Lorenz curve, and calculated based on data on an individual level. The model assumption is that the income vector y is arranged in a monotonically ascending (non-decreasing) order and then the Gini concentration ratio is mathematically defined as in equation 1, 2 and 3.
CG Y
=
s−1(y z)`q (1)Y
sY
i i n=
=∑
1 , and (2) * n n . . . *i n n . . . *n n n − − − − − = − − − − z 2 1 1 1 2 1 1 2 1 1 = n i Y Y Y y . . . . . .1
=
1
.
.
.
.
.
.
1
q
(3) ) performs an element-by-element multiplication of vectors or matrices of identical dimensions. Gini ratio measures the deviation from perfect equality, roughly defined as, for example, fifth quantile of the population receiving one-fifth of the whole income. Therefore, as the income distribution moves further from equality, the Gini coefficient increases (Maxwell 1990). The Gini ratio lies in the interval 0-1 (0 beingequal distribution, and 1 being completely unequal distribution).
2.4. Economic properties of farm enterprises in the study area
Some of the economic properties of the cotton sector on the Harran Plain are depicted in Table 2. The sampled farmers have an average farm size of 10.79 hectares seeded with cotton. This figure is higher than both the regional and national farm size averages of 9.5 and 6.1 hectares, respectively, according to the 2001 Turkish Census of Agriculture.
We reach the gross margin by taking into account the proceeds from the cotton sale minus total variable costs, averaging out to about 11658 Turkish Liras (TL). The twelve-month average exchange rate of TL in 2012 was 1 dollar= 1.80 TL. Net profits are then calculated by further subtracting total fix costs from the gross margin, equaling 6592 TL on the average. When family labor equivalents are added back to net profits, agricultural income from cotton production hence results, which averages out to about 11435 TL. To come up with an income figure on which distributional calculations are to be based later on, we add subsidies and cotton payments to agricultural income, hence generating cotton household income, averaging 37395 TL in 2012 terms.
Table 2- Descriptive statistics for variables used in the analysis
Çizelge 2- Analizde kullanılan değişkenlere ait betimleyici istatistikler Variables related to
cotton production Mean deviation Standard Minimum Maximum variation (%)Coefficient of
Total variables costs (TL) 39795.67 40987.02 2471.00 287123.00 102.99 Total fix costs (TL) 5066.61 12194.08 0.00 82718.44 240.68 Gross margin (TL) 11658.35 18880.71 -39827.00 82525.10 161.95 Net profits (TL) 6591.74 23595.54 -122545.00 79858.43 357.96 Agricultural income (TL) 11435.48 24535.44 -105255.80 79858.43 214.56 Household income (TL) 37394.99 35436.88 0.00 166483.40 94.76
Türkiye’de Şanlıurfa İli Harran Ovası Sulama Projelerinin Lokal Pamuk Çiftçileri Refahına Etkileri: Gelir Dağılımı..., Isgın & Kara
3. Results and Discussions
3.1. Results from the analysis of land distribution within the sample
Table 3 demonstrates numerically the distribution of farmland among the local farmers studied on the Harran Plain during the season 2012. Figure 1 depicts the relevant Lorenz curve drawn based on the numbers in Table 3, illustrating in a visual manner the distributional results based on land-use by sampled farmers. When the trend in the Lorenz curve is taken into account it is clear that the distribution of farmland among Harran farmers is considerably unequal. The Gini coefficient of concentration, which is the ratio explaining mathematically the status of land distribution, is then calculated to be 0.4804 using the equations (1) and (2) given above. This ratio (0.4804) is quite comparable to those (0.4956 and 0.4797) calculated and/or given in Paksoy (2000) but slightly lower than the one (0.5173) generated in Isgin (2006). When we consider these results as the third period distributional impacts of the provision of Harran Plain Irrigation projects finalized in 1995, no progress in terms of land distribution has been shown whatsoever. Nevertheless we must treat this case with a great caution because no direct comparison between these Gini concentration ratios calculated now and calculated then in different studies may
be possible since nither the samples used nor the sample sizes worked with are a match. Thus these distributional results are only comparable to get a general idea.
5
Table 3- Distribution of farmland among the farmers sampled
Çizelge 3- İncelenen işletmelerde işletme arazisinin dağılımı Land size
Groups (ha)
Farms Land size
Count Cumulative % Hectare Cumulative (ha) % 0.1-5 49 49 38.89 155.0 155.0 11.40 5.1-10 37 86 68.25 293.3 448.3 32.97 10.1-15 12 98 77.78 150.6 598.9 44.05 15.1-20 9 107 84.92 165.0 763.9 56.19 20.1-25 8 115 91.27 179.0 942.9 69.35 25.1-30 4 119 94.44 116.0 1058.9 77.88 30.1-35 3 122 96.83 92.3 1151.2 84.67 35.1-40 1 123 97.62 37.5 1188.7 87.43 40.1- + 3 126 100 170.9 1359.6 100.00 Gini: 0.48043
Figure 1- Farmland distribution and its Lorenz curve
Şekil 1- İşletme arazisi dağılımı ve ilgili Lorenz eğrisi
The distribution worsens depanding on how far the Lorenz curve falls apart from the diagonal of equality and improves conversely depanding on how close it gets to this diagonal. The shape of the lorenz curve drawn for farmland distribution in Figure 1, therefore, presents a visible evidence of such a disparity in land-use relative to the diagonal of equality. Similarly, as seen on Table 3, while more than half (68%) of the farmers sampled operate about 33% of the land in total, a small portion of the farmers falling in the upper 5% quantile operates 22% of all the land within the sample. This result confirms to show that farmland among local farmers is unjustly distributed.
3.2. Results from the analysis of household income distribution
The distribution of household incomes from cotton production among the farmers sampled is shown numerically in Table 4, geometrically by the Lorenz curve in Figure 2 and finally mathematically by the Gini coefficient of concentration. At the first glance, Table 4 demonstrates that while more than half (57%) of the farmers earns less than 30000 TL and the bulk (90%) of them earns less than 90000 TL, their earnings have a share of 21% and 70% of all income, respectively. A small portion of the farmers falling in the upper 10% quantile, on the other hand, earns more than 90000 TL with a share 30% of all income within the sample. Thus a small portion (10%) of the farmers has a large income share of about 30%, declaring how unequal the distribution of household incomes from cotton production is, as in the case experienced in earlier studies. The Gini coefficient of 0.49082 calculated for this sample is in favor of the evidence supporting an unequal distribution of household incomes in Harran Plain cotton sector.
38.89, 11.40 68.25, 32.97 77.78, 44.05 84.92, 56.19 91.27, 69.35 94.44, 77.88 96.83, 84.6797.62, 87.43 100, 100 0 10 20 30 40 50 60 70 80 90 100 0 10 20 30 40 50 60 70 80 90 100 Ag gr eg at e La nd S ize U nde r C ot to n (C umu la tive % )
Number of Farmers (Cumulative %) Diagonal of
Equality
Lorenz Curve
Figure 1- Farmland distribution and its Lorenz curve
Şekil 1- İşletme arazisi dağılımı ve ilgili Lorenz eğrisi The distribution worsens depanding on how far the Lorenz curve falls apart from the diagonal of equality and improves conversely depanding on how close it gets to this diagonal. The shape of the lorenz curve drawn for farmland distribution in Figure 1, therefore, presents a visible evidence of
Table 3- Distribution of farmland among the farmers sampled
Çizelge 3- İncelenen işletmelerde işletme arazisinin dağılımı Land size
Groups (ha)
Farms Land size
Count Cumulative % Hectare Cumulative (ha) %
0.1-5 49 49 38.89 155.0 155.0 11.40 5.1-10 37 86 68.25 293.3 448.3 32.97 10.1-15 12 98 77.78 150.6 598.9 44.05 15.1-20 9 107 84.92 165.0 763.9 56.19 20.1-25 8 115 91.27 179.0 942.9 69.35 25.1-30 4 119 94.44 116.0 1058.9 77.88 30.1-35 3 122 96.83 92.3 1151.2 84.67 35.1-40 1 123 97.62 37.5 1188.7 87.43 40.1- + 3 126 100.00 170.9 1359.6 100.00 Gini: 0.48043
Impacts of the Harran Plain Irrigation Projects on the Well-being of Local Cotton Farmers Operating in the Sanliurfa..., Isgın & Kara
such a disparity in land-use relative to the diagonal of equality. Similarly, as seen on Table 3, while more than half (68%) of the farmers sampled operate about 33% of the land in total, a small portion of the farmers falling in the upper 5% quantile operates 22% of all the land within the sample. This result confirms to show that farmland among local farmers is unjustly distributed.
3.2. Results from the analysis of household income distribution
The distribution of household incomes from cotton production among the farmers sampled is shown numerically in Table 4, geometrically by the Lorenz curve in Figure 2 and finally mathematically by the Gini coefficient of concentration. At the first glance, Table 4 demonstrates that while more than half (57%) of the farmers earns less than 30000 TL and the bulk (90%) of them earns less than 90000 TL, their earnings have a share of 21% and 70% of all income, respectively. A small portion of the farmers falling in the upper 10% quantile, on the other hand, earns more than 90000 TL with a share 30% of all income within the sample. Thus a small portion (10%) of the farmers has a large income share of about 30%, declaring how unequal the distribution of household incomes from cotton production is, as in the case experienced in earlier studies. The Gini
coefficient of 0.49082 calculated for this sample is in favor of the evidence supporting an unequal distribution of household incomes in Harran Plain cotton sector. The same result is also evident from the shape of the lorenz curve depicted in Figure 2, which is drawn based on the numbers in Table 4.
6
The same result is also evident from the shape of the lorenz curve depicted in Figure 2, which is drawn based on the numbers in Table 4.
Table 4- Household income distribution among the sampled cotton farmers
Çizelge 4- İncelenen pamuk işletmelerinde hanehalkı gelir dağılımı
Income
Groups (TL) Count CumulativeCotton farms % TL Cotton household incomeCumulative (TL) % 1-10000 24 24 19.05 117816.20 117816.20 2.50 10001-20000 30 54 42.86 453798.92 571615.12 12.13 20001-30000 18 72 57.14 431622.45 1003237.57 21.29 30001-40000 13 85 67.46 443088.21 1446325.78 30.70 40001-50000 8 93 73.81 366676.82 1813002.60 38.48 50001-60000 4 97 76.98 222322.35 2035324.94 43.20 60001-70000 6 103 81.75 378961.05 2414285.99 51.24 70001-80000 6 109 86.51 452154.37 2866440.36 60.84 80001-90000 5 114 90.48 423923.28 3290363.64 69.83 90001- + 12 126 100.00 1421405.70 4711769.34 100.00 Gini: 0.49082
Figure 2- Distribution of cotton household income and its Lorenz curve
Şekil 2- Pamukta hanehalkı gelir dağılımı ve ilgili Lorenz eğrisi
When compared to those ratios of 0.5523 and 0.5093 given in Paksoy (2000) and 0.6043 calculated in Isgin (2006), the Gini coefficient of 0.49082 calculated in this analysis renders a clear evidence that there has been no progress recorded in terms of income distribution for the last two decades. Similarly there are other studies dealing with income distribution in agriculture, revealing Gini ratios of 0.4152 (Turgut 1991), 0.3648 (Polat 1994), and 0.4105 (Eraktan 1995). Based on these figures we can declare that there is a common problem of income distribution in Turkish agriculture.
3.3. Distributional status before and after Harran Plain (GAP) irrigation projects
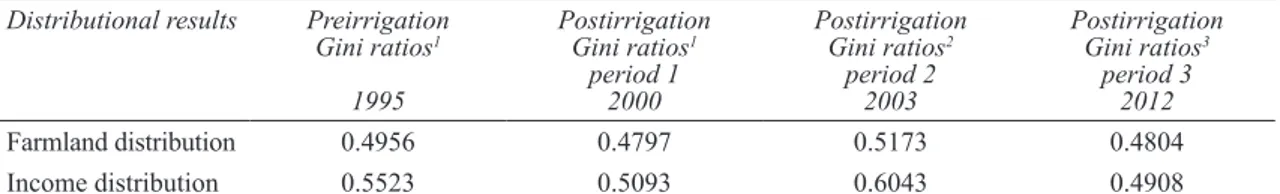
A before/after comparison of the distributional impacts of the Harran Plain irrigation projects is demonstrated in Table 5. While the Gini coefficients were G= 0.4956 for the land distribution and G= 0.5523 for the income distribution before Harran Plain irrigation applications started back in 1995, these ratios stayed reletively close at G= 0.4797 and G= 0.5093, respectively, within the first period of the postirrigation era in 2000. In the second period of the postirrigation era started in 2003, these Gini ratios increased to become G= 0.5173 and G= 0.6043 for the land distribution and income distribution, respectively, whereas finaly sitting back on the levels of G= 0.4804 and G= 0.4908, respectively, within the third period of the postirrigation era in 2012. Thus Table 5 reveals visible evidence of a chronical
19.05, 2.50 42.86, 12.13 57.14, 21.29 67.46, 30.7073.81, 38.48 76.98, 43.20 81.75, 51.24 86.51, 60.84 90.48, 69.83 100, 100 0 10 20 30 40 50 60 70 80 90 100 0 10 20 30 40 50 60 70 80 90 100 Ag gr eg at e Ho us eho ld Inc om e fr om Co tto n Pr od uc tio n (C umu la tive % )
Recipient Units (Cumulative %) Diagonal of
Equality
Lorenz Curve
Figure 2- Distribution of cotton household income and its Lorenz curve
Şekil 2- Pamukta hanehalkı gelir dağılımı ve ilgili Lorenz eğrisi
When compared to those ratios of 0.5523 and 0.5093 given in Paksoy (2000) and 0.6043
Table 4- Household income distribution among the sampled cotton farmers
Çizelge 4- İncelenen pamuk işletmelerinde hanehalkı gelir dağılımı Income
Groups (TL)
Cotton farms Cotton household income
Count Cumulative % TL Cumulative (TL) %
1-10000 24 24 19.05 117816.20 117816.20 2.50 10001-20000 30 54 42.86 453798.92 571615.12 12.13 20001-30000 18 72 57.14 431622.45 1003237.57 21.29 30001-40000 13 85 67.46 443088.21 1446325.78 30.70 40001-50000 8 93 73.81 366676.82 1813002.60 38.48 50001-60000 4 97 76.98 222322.35 2035324.94 43.20 60001-70000 6 103 81.75 378961.05 2414285.99 51.24 70001-80000 6 109 86.51 452154.37 2866440.36 60.84 80001-90000 5 114 90.48 423923.28 3290363.64 69.83 90001- + 12 126 100.00 1421405.70 4711769.34 100.00 Gini: 0.49082
Türkiye’de Şanlıurfa İli Harran Ovası Sulama Projelerinin Lokal Pamuk Çiftçileri Refahına Etkileri: Gelir Dağılımı..., Isgın & Kara
calculated in Isgin (2006), the Gini coefficient of 0.49082 calculated in this analysis renders a clear evidence that there has been no progress recorded in terms of income distribution for the last two decades. Similarly there are other studies dealing with income distribution in agriculture, revealing Gini ratios of 0.4152 (Turgut 1991), 0.3648 (Polat 1994), and 0.4105 (Eraktan 1995). Based on these figures we can declare that there is a common problem of income distribution in Turkish agriculture.
3.3. Distributional status before and after Harran Plain (GAP) irrigation projects
A before/after comparison of the distributional impacts of the Harran Plain irrigation projects is demonstrated in Table 5. While the Gini coefficients were G= 0.4956 for the land distribution and G= 0.5523 for the income distribution before Harran Plain irrigation applications started back in 1995, these ratios stayed reletively close at G= 0.4797 and
G= 0.5093, respectively, within the first period of the postirrigation era in 2000. In the second period of the postirrigation era started in 2003, these Gini ratios increased to become G= 0.5173 and G= 0.6043 for the land distribution and income distribution, respectively, whereas finaly sitting back on the levels of G= 0.4804 and G= 0.4908, respectively, within the third period of the postirrigation era in 2012. Thus Table 5 reveals visible evidence of a chronical trend in land and income disparities within the Harran Plain cotton sector during the past two decades. This finding leads to a robust assertion that there is a considerable disparity concern in the distribution of land and therefore household incomes within the Harran Plain cotton sector.
With the irrigation water brought in on the Harran Plain started from 1995, on the other hand, farmer incomes from cotton production have multiplied since then. Table 6 summarizes average
Table 5- Before and after comparisons of the distributional status based on the provision of Harran Plain irrigation projects
Çizelge 5- Harran Ovası sulama projelerine dayalıöncesi ve sonrası gelir dağılım durumu karşılaştırmaları Distributional results Preirrigation
Gini ratios1 1995 Postirrigation Gini ratios1 period 1 2000 Postirrigation Gini ratios2 period 2 2003 Postirrigation Gini ratios3 period 3 2012 Farmland distribution 0.4956 0.4797 0.5173 0.4804 Income distribution 0.5523 0.5093 0.6043 0.4908
1, based on findings in Paksoy (2000); 2, based on findings in Isgin (2006); 3, based on original findings using the survey data in this
analysis
Table 6- Average household incomes from cotton production; before and after the provision of Harran Plain irrigation projects
Çizelge 6- Harran Ovası sulama projeleri öncesi ve sonrası yöre çiftçilerinin ortalama pamuk hane geliri Cotton household
incomes Preirrigation period 19951 Postirrigation period 1 20001 Postirrigation period 2 20032 Postirrigation period 3 20123 In current terms (TL) 105.70 918.01 21197.48 37395.00 In real terms (TL) (2013= 100)4 10881.09 5983.65 49267.04 40197.04 1, income figures for the preirrigation period and postirrigation period 1 are based on the work done by Paksoy (2000); 2, income figures
for the postirrigation period 2 are based on the work done by Isgin (2006); 3, income figures for the postirrigation period 3 are based on
the current work in this analysis; 4, consumer price indexes issued by TUIK (Turkish Statistical Institute) were used to convert current
Impacts of the Harran Plain Irrigation Projects on the Well-being of Local Cotton Farmers Operating in the Sanliurfa..., Isgın & Kara
household incomes for the cotton farmers sampled with the status of preirrigation and postirrigation eras explicitly taken into account. Compared to those cotton household incomes averaging out about 105.7 TL in real terms in 1995, these figures have multiplied over 8, 200, and then 353 times, reaching approximately 918, 21200, and 37400 TL in 2000, 2003, and 2012, respectively. When converted to real terms using appropriate consumer price indexes with 2013 taken as the base year, we can readily see how well local farmers’ household incomes have improved due to irrigation water made possible on the Harran Plain in 1995 by the implementation of the GAP project. Thus compared to that (about 10900 TL) in 1995, these average income figures were almost cut in half by the year 2000 at first, and multiplied over 4 and then over 3 times, reaching approximately 49300 and 40200 TL in real terms in years 2003 and 2012, respectively. These enhancements in household incomes from cotton production clearly are the quantitative impacts of the GAP project, which in fact was not the case at all quality wise when considering the distributional impacts.
4. Conclusions
This paper aimed to investigate the issue of income distribution among farm households that grow cotton under the irrigated conditions of the Harran Plain located in the province of Sanliurfa. We thus capitalized on a brand new data set available based on the outcome of an officially supported (Tubitak) project that was initiated in 2011 and finalized in 2013. Information was gathered using a data collection technique based on farmer registry information and monetary inducement systems, applied to a random sample of cotton farmers operating on the Harran Plain, i.e., 126 participatory cotton farmers, selected using a stratified random sampling process, were supplied farmer diaries to fill out, begining the 2012 production season and later on these diaries were controlled by frequent visits to these farmers throughout the season.
The sampled farmers earned incomes averaging out to about 37395 TL from cotton farming stretching
over a land tract equal to 10.79 hectares on average, which is higher than both the regional and national farm size averages. It is evident that the South Eastern Anatolia (GAP) project had relatively positive impacts on Harran Plain agriculture in terms of nominal income and farm size. The distributional results of household incomes from cotton production as well as land-use by these cotton farmers sampled are shown geometrically by the Lorenz curve and mathematically by the Gini coefficient of concentration. From this analysis it was found that the Gini concentration ratios calculated for cotton household incomes and farmland under cotton are highly comparable to those given/calculated in Paksoy (2000), but slightly lower than those calculated in Isgin (2006). This outcome hence is in support of the conclusion that distributional impacts of the GAP project on farmer incomes and thereby on farmer welfare in general through the provision of irrigation water on the Harran Plain started in 1995 were not all that affirmative resulting from unequal distribution of farmland among these local cotton farmers. In other words, income disparities in Harran Plain agriculture, as such, are attributable to land-use being unequally distributed among farmers. However, thriving Harran Plain cotton sector fueled from the provision of GAP related irrigation projects has been enjoying some income enhancing outcome, which is purely quantitative in nature, but more importantly far from being qualitative when distributional impacts are taken in to account.
The fact that approximately 91% of the irrigable land located on the Harran Plain is allocated to cotton production results in flourishing agro-industries in the region. Although this can be seen as an important indicator in alleviating the effects of unemployment and thereby in advancing economic development in the region, there is still room for making the case better in terms of income distribution. Incomes earned by smallholder farmers suffer more from their dispossession of land and unfortunately the number of such farmers is pronounced, resulting in that better-off farmers from the upper quantile own a chunk of land in total, which in turn leads to a wider disparity in
Türkiye’de Şanlıurfa İli Harran Ovası Sulama Projelerinin Lokal Pamuk Çiftçileri Refahına Etkileri: Gelir Dağılımı..., Isgın & Kara
farmer incomes. To neutralize this vicious circle requires an institutional land reform that should be realized at the local level. Although the province of Sanliurfa comes under the jurisdiction of such a reform, the tribal regime allowing possession of multiple villages still dominates in the region. Such tribes to which villages of diverse sizes belong are as many as about 30. Clearly, this issue calls for radical measures to be taken, e.g., unattended government land tracks are the good ones to begin with that can be allocated to landless farmers upon advice taken from the experts. Land expropriated in Sanliurfa territory during the period 1973-1976 in accordance with the act number 1757 has been reserved for rent on account of the government. Such land under this status can also be allocated to landless farmers following a reasonable program. Relying on such evidence, there is an obvious need to develop local agricultural policy instruments targeting measures that prioritize the acquisition of land within the farm community on the Harran Plain, which in turn will translate into thriving local agricultural economics.
Acknowledgements
We are highly greatful to the Scientific and Technological Research Council of Turkey (TUBITAK) for supporting our project numbered as 110K374. Without their valuable contibutions, this research could never have been completed.
References
Eraktan S (1995). Anamur Muz İşletmelerinin Ekonomik Analizi. Ankara Üniversitesi Ziraat Fakültesi Yayın No: 1432, Bilimsel Araştırma ve İncelemeler No: 794, Ankara
Isgin T, Bilgic A & Ipekcioglu S (2010). An analysis of cotton production technology on the Harran Plain.
Tarım Bilimleri Dergisi – Journal of Agricultural Sciences 16(4): 254-261
Isgin T (2006). Harran Ovası sulu tarım işletmelerinde arazi ve gelir dağılımı. Tarım Ekonomisi Dergisi 12(2): 59-68
Isgin T & Forster D L (2003). A decomposition analysis of farm household income distribution in agriculture: A case study from Ohio. Harran University Journal of
Agricultural Faculty 7(1-2): 11-17
Jayne T S, Yamano T, Weber M T, Tschirley D, Benfica R, Chapoto A & Zulu B (2003). Smallholder income and land distribution in Africa: Implications for poverty reduction strategies. Journal of Food Policy 28: 253-275
Maxwell N L (1990). Income Inequality in the United States, 1947-1985, pp. 1-14, 143-145
Nelson C T (1994). Levels of and Changes in The Distribution of US Income. The Changing Distribution of Income in an Open U.S. Economy. College of Business Administration, University of Notre Dame, Notre Dame, Indiana, pp. 29-63
Paksoy S (2000). An Economic Analysis of Cotton Growing Farms in Harran Plains Under the Irrigated Conditions Provided by the South Eastern Anatolia Project: Land And Income Distribution Aspects (in Turkish). Sanliurfa, Turkey: Ozdal Publishing Co., Sanliurfa
Pen J (1979). Income Distribution. By Praeger Publishers, Inc., pp. 59-75
Polat I (1994). Kırşehir İli Merkez İlçesi Tarım İşletmelerinde Gelir Dağılımı. Yüksek Lisans Tezi, Ankara Üniversitesi Fen Bilimleri Enstitüsü (Basılmamış), Ankara
MFAL (2010). Şanlıurfa İli Pamuk Üretim Durumu (in Turkish). Şanlıurfa Tarım İl Müdürlüğü İstatistikleri Turgut T (1991). Ankara İli Elmadağ İlçesinde Tarım
İşletmelerinde Gelir Dağılımı ve Gelir-Tüketim İlişkisi Üzerine Bir Araştırma. Yüksek Lisans Tezi, Ankara Üniversitesi, Fen Bilimleri Enstitüsü, Tarım Ekonomisi Anabilim Dalı (Basılmamış), Ankara Witzke H V (1984). A model of income distribution in
agriculture: Theory and evidence. European Review
of Agricultural Economics 11(1): 65-83
Yamane T (1967). Elementary Sampling Theory. Printice Hall Inc., Englewood Cliffs NT