Psychological Medicine
cambridge.org/psm
Original Article
†Contributed equally as joint first authors. ‡Co-authors who are members of the Psychosis Endophenotypes International Consortium (PEIC) and the Genetic Risk and Outcome of Psychosis (GROUP) consortium are listed at the end of this paper.
§Members of the Wellcome Trust Case Control Consortium 2 (WTCCC2) are listed in the Supplement.
Cite this article:Blakey R et al (2018). Associations between psychosis endophenotypes across brain functional, structural, and cognitive domains.
Psychological Medicine 48, 1325–1340. https:// doi.org/10.1017/S0033291717002860
Received: 6 December 2016 Revised: 30 August 2017 Accepted: 31 August 2017
First published online: 2 November 2017
Key words:
Lateral ventricular volume; P300; schizophrenia; verbal memory; unaffected relatives; working memory
Author for correspondence:
Dr S. Ranlund, Ph.D., E-mail:siri.ranlund@kcl. [email protected]
© Cambridge University Press 2017
Associations between psychosis
endophenotypes across brain functional,
structural, and cognitive domains
R. Blakey
1,†
, S. Ranlund
1,2,†
, E. Zartaloudi
1,†
, W. Cahn
3, S. Calafato
1, M. Colizzi
2,
B. Crespo-Facorro
4,5, C. Daniel
1, Á. Díez-Revuelta
1,6, M. Di Forti
2, GROUP
‡
,
C. Iyegbe
2, A. Jablensky
7, R. Jones
1, M.-H. Hall
8, R. Kahn
3, L. Kalaydjieva
9,
E. Kravariti
2, K. Lin
2,10, C. McDonald
11, A. M. McIntosh
12,13, PEIC
‡
, M. Picchioni
2,
J. Powell
2, A. Presman
1, D. Rujescu
14,15, K. Schulze
2, M. Shaikh
16,2,
J. H. Thygesen
1, T. Toulopoulou
2,17,18,19, N. Van Haren
3, J. Van Os
20,2,
M. Walshe
1,2, WTCCC2
§
, R. M. Murray
2and E. Bramon
1,2,211
Division of Psychiatry, University College London, London, UK;2Institute of Psychiatry Psychology and Neuroscience at King’s College London and South London and Maudsley NHS Foundation Trust, London, UK;
3
Department of Psychiatry, Brain Centre Rudolf Magnus, University Medical Center Utrecht, Utrecht, The Netherlands;4CIBERSAM, Centro Investigación Biomédica en Red Salud Mental, Madrid, Spain;5Department of Psychiatry, University Hospital Marqués de Valdecilla, School of Medicine, University of Cantabria–IDIVAL, Santander, Spain;6Laboratory of Cognitive and Computational Neuroscience– Centre for Biomedical Technology (CTB), Complutense University and Technical University of Madrid, Madrid, Spain;7Centre for Clinical Research in Neuropsychiatry, The University of Western Australia, Perth, Western Australia, Australia;8Psychology Research Laboratory, Harvard Medical School, McLean Hospital, Belmont, MA, USA;9Harry Perkins Institute of Medical Research and Centre for Medical Research, The University of Western Australia, Perth, Australia;10Nuffield Department of Population Health, University of Oxford, Oxford, UK;11Department of Psychiatry, Clinical Science Institute, National University of Ireland Galway, Ireland;12Division of Psychiatry, University of Edinburgh, Royal Edinburgh Hospital, Edinburgh, UK;13Centre for Cognitive Ageing and Cognitive Epidemiology, University of Edinburgh, UK;14Department of Psychiatry, Ludwig-Maximilians University of Munich, Munich, Germany;
15
Department of Psychiatry, Psychotherapy and Psychosomatics, University of Halle Wittenberg, Halle, Germany;
16
North East London Foundation Trust, London, UK;17Department of Psychology, Bilkent University, Main Campus, Bilkent, Ankara, Turkey;18Department of Psychology, the University of Hong Kong, Pokfulam Rd, Hong Kong SAR, China;19The State Key Laboratory of Brain and Cognitive Sciences, The University of Hong Kong, The Hong Kong Jockey Club Building for Interdisciplinary Research, Hong Kong SAR, China;20Department of Psychiatry and Psychology, Maastricht University Medical Centre, EURON, Maastricht, The Netherlands and
21
Institute of Cognitive Neuroscience, University College London, London, UK
Abstract
Background.
A range of endophenotypes characterise psychosis, however there has been
lim-ited work understanding if and how they are inter-related.
Methods.
This multi-centre study includes 8754 participants: 2212 people with a psychotic
disorder, 1487 unaffected relatives of probands, and 5055 healthy controls. We investigated
cognition [digit span (N = 3127), block design (N = 5491), and the Rey Auditory Verbal
Learning Test (N = 3543)], electrophysiology [P300 amplitude and latency (N = 1102)], and
neuroanatomy [lateral ventricular volume (N = 1721)]. We used linear regression to assess
the interrelationships between endophenotypes.
Results.
The P300 amplitude and latency were not associated (regression coef.
−0.06, 95% CI
−0.12 to 0.01, p = 0.060), and P300 amplitude was positively associated with block design
(coef. 0.19, 95% CI 0.10
–0.28, p < 0.001). There was no evidence of associations between
lat-eral ventricular volume and the other measures (all p > 0.38). All the cognitive
endopheno-types were associated with each other in the expected directions (all p < 0.001). Lastly, the
relationships between pairs of endophenotypes were consistent in all three participant groups,
differing for some of the cognitive pairings only in the strengths of the relationships.
Conclusions.
The P300 amplitude and latency are independent endophenotypes; the former
indexing spatial visualisation and working memory, and the latter is hypothesised to index
basic processing speed. Individuals with psychotic illnesses, their unaffected relatives, and
healthy controls all show similar patterns of associations between endophenotypes, endorsing
the theory of a continuum of psychosis liability across the population.
https://www.cambridge.org/core/terms. https://doi.org/10.1017/S0033291717002860
Introduction
Psychotic disorders, including schizophrenia and bipolar
dis-order, have considerable heritability with estimates ranging
between 60 and 85% (Cardno et al.
1999
; Smoller & Finn,
2003
; Sullivan et al.
2012
), and there is evidence of significant
genetic overlap between these disorders (Lee et al.
2013
).
Psychoses are complex genetic disorders where many common
variants contribute small increments of risk, and rare variants
contribute greater risks (Gratten et al.
2014
; Geschwind & Flint,
2015
). While many common loci and some rare variants have
now been identified (Stefansson et al.
2008
; Stone et al.
2008
;
Walsh et al.
2008
; Xu et al.
2008
; Purcell et al.
2009
; Grozeva
et al.
2011
; Sklar et al.
2011
; Lee et al.
2013
; Ripke et al.
2013
,
2014
; Green et al.
2015
), little is known about their functional
roles and the mechanisms through which they lead to the disease
(Geschwind & Flint,
2015
; Harrison,
2015
).
Endophenotypes could help us gain a better understanding of
the underlying neurobiology (Gottesman & Gould,
2003
; Cannon
& Keller,
2006
; Gur et al.
2007
). These are biological markers
which are heritable, co-segregate with a disorder within families,
are observed in unaffected family members at a higher rate than
in the general population, and are expressed in an individual
whether or not the illness is active (Gottesman & Gould,
2003
).
Endophenotypes could thus be used to better understand the
mechanisms underlying the associations between genetic variants
and the disorder (Hall & Smoller,
2010
; Braff,
2015
).
Although there is an extensive literature identifying and
valid-ating endophenotypes for psychosis, fewer studies have examined
the relationships between different endophenotypes. Studies
con-ducted so far have mainly analysed the associations between
dif-ferent cognitive measures (Toomey et al.
1998
; Dickinson et al.
2002
,
2006
; Sullivan et al.
2003
; Gladsjo et al.
2004
; Sheffield
et al.
2014
; Seidman et al.
2015
), but there is a lack of literature
examining brain structural–cognitive and electrophysiological–
cognitive pairings. Moreover, the inclusion of unaffected relatives
in these studies has been rare, yet examining relatives
– who carry
increased genetic risk but have no illness or treatment
confound-ing factors
– is crucial for establishing the utility of these markers
for genetic research.
This study seeks to investigate the relationships between the
following electrophysiological, neurocognitive, and
neuroanatom-ical endophenotypes for psychosis:
• P300 event-related potential: Reduced amplitude and prolonged
latency of the P300 wave have consistently been found in
patients with psychotic illnesses as well as in unaffected
rela-tives, compared with controls (Blackwood et al.
1991
;
Weisbrod et al.
1999
; Pierson et al.
2000
; Winterer et al.
2003
; Bramon et al.
2005
; Price et al.
2006
; Schulze et al.
2008
; Bestelmeyer et al.
2009
; Díez et al.
2013
; Light et al.
2015
; Turetsky et al.
2015
). The P300 amplitude is thought to
be a correlate of attention and working memory (Näätänen,
1990
; Ford,
2014
). Although the latency has been less precisely
characterized, it is thought to index classification speed (Polich,
2007
,
2011
).
• Cognitive performance: Deficits on cognitive tests such as digit
span (measuring working memory), block design (measuring
working memory and spatial visualisation), and the Rey
Auditory Verbal Learning Task (RAVLT) immediate and
delayed recall (measuring short- and long-term verbal memory,
respectively) are common and persistent across psychotic
disorders (Heinrichs & Zakzanis,
1998
; Gur et al.
2007
; Bora
et al.
2009
; Stone et al.
2011
; Bora & Pantelis,
2015
; Kim
et al.
2015b
; Lee et al.
2015
). Abnormalities are often observed
before the onset of the illness as well as in unaffected relatives
(Glahn et al.
2006
; Saperstein et al.
2006
; Snitz et al.
2006
;
Birkett et al.
2008
; Horan et al.
2008
; Forbes et al.
2009
;
Reichenberg et al.
2010
; Ivleva et al.
2012
; Park & Gooding,
2014
; Gur et al.
2015
).
• Lateral ventricular volume: Increased ventricular volume is a
highly replicated finding in patients with psychosis compared
with controls (Sharma et al.
1998
; Fannon et al.
2000
; Wright
et al.
2000
; Shenton et al.
2001
; McDonald et al.
2002
,
2006
;
Strasser et al.
2005
; Boos et al.
2007
; Crespo-Facorro et al.
2009
; Kempton et al.
2010
; Fusar-Poli et al.
2013
; Haijma
et al.
2013
; Kumra et al.
2014
). This enlargement has been
attributed to neurodevelopmental difficulties, disease
progres-sion,
and/or
the
effects
of
antipsychotic
medications
(Pilowsky et al.
1993
; Gogtay et al.
2003
; McDonald et al.
2006
).
This multi-centre study, seeking to investigate the relationships
between multi-modal endophenotypes, includes the largest
sam-ple yet of individuals with psychosis, their unaffected first-degree
relatives, and controls. The main objective is to facilitate the use of
endophenotypes for genetic research into psychosis, which
requires well defined and characterised measures. The aim of
this study was therefore to examine the relationships between
dif-ferent endophenotype pairs, and in particular, to characterise the
P300 event related potential in the context of well-defined
cogni-tive markers.
Methods and materials
Sample and clinical assessments
The total sample included 8754 participants: 2212 individuals
with a diagnosis of a psychotic disorder (see
Table 1
for a
break-down of diagnoses), 1487 of their unaffected first-degree relatives
(with no personal history of psychosis), and 5055 healthy controls
(with no personal or family history of psychosis). Relatives and
controls were not excluded if they had a personal history of
non-psychotic disorders (such as depression or anxiety), provided they
were well and off psychotropic medication at the time of testing
and for the preceding 12 months.
To confirm or rule out a DSM-IV (APA,
1994
) diagnosis, all
participants underwent a structured clinical interview with either
the Comprehensive Assessment of Symptoms and History
(Andreasen et al.
1992
), the Structured Clinical Interview for
DSM Disorders (Spitzer et al.
1992
), the Schedule for Affective
Disorders and Schizophrenia (Endicott & Spitzer,
1978
) or the
Schedule for Clinical Assessment in Neuropsychiatry, Version
2.0 (Wing et al.
1990
). Participants were excluded if they had a
history of neurologic disease or a loss of consciousness due to a
head injury.
Recruitment took place across 11 locations in Australia and
Europe (Germany, Holland, Spain, and the UK) (see online
Supplementary Table S1 in the supplement). Participants provided
written informed consent, and the study was approved by the
respective ethical committees at each of the 11 participating centres.
The main focus of this paper is an analysis of the associations
between different endophenotype domains, which represents new
and unpublished data. Some centres have previously published
comparisons in endophenotype performance between groups
(patients, relatives, and controls) (Weisbrod et al.
1999
;
Hulshoff Pol et al.
2002
; McDonald et al.
2002
; Steel et al.
2002
;
Bramon et al.
2005
; Johnstone et al.
2005
; Hall et al.
2006b
; Price
et al.
2006
; Schulze et al.
2006
; González-Blanch et al.
2007
;
Crespo-Facorro et al.
2009
; Waters et al.
2009
; Wobrock et al.
2009
; Toulopoulou et al.
2010
; Collip et al.
2013
). Here we also
present results of a mega-analysis of the combined multi-centre
sample.
Neuropsychological assessments
The Wechsler Adult Intelligence Scale,
revised
version
(Wechsler,
1981
) or third edition (Wechsler,
1997
), were
administered to participants. Performance on two subtests was
used for analyses: the combined forward and backward digit
span (measuring attention and working memory) and block
design (measuring spatial visualisation). The Rey Auditory
Verbal Learning Test (Rey,
1964
), including both immediate
and delayed recall (assessing short- and long-term verbal
mem-ory, respectively), was also administered. Higher scores on the
cognitive tasks indicate better performance. Full methodology
for each contributing site is reported elsewhere (Johnstone
et al.
2005
; Crespo-Facorro et al.
2007
; González-Blanch et al.
2007
; Waters et al.
2009
; Toulopoulou et al.
2010
; Walters
et al.
2010
; Korver et al.
2012
).
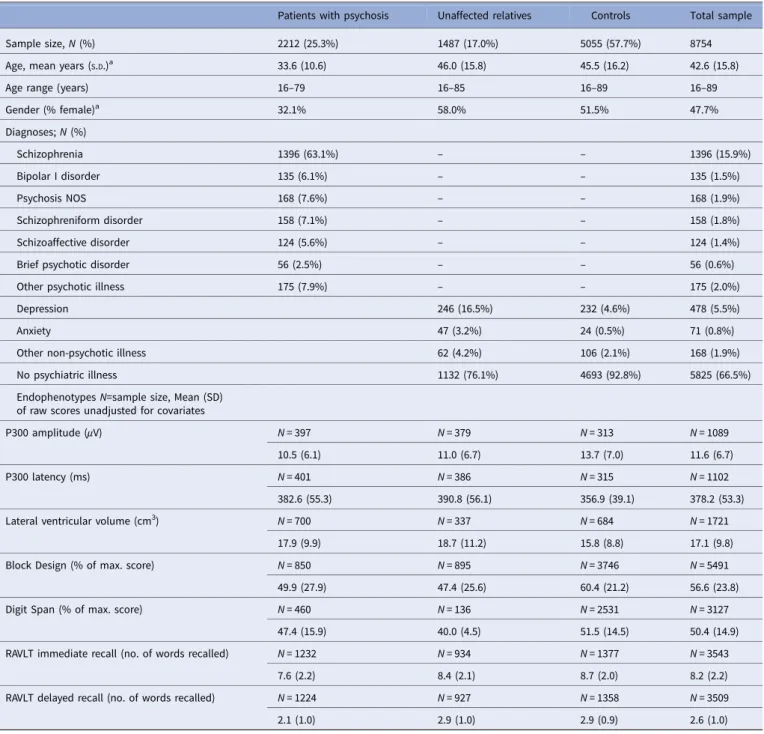
Table 1.Sample characteristics (N = 8754)
Patients with psychosis Unaffected relatives Controls Total sample
Sample size, N (%) 2212 (25.3%) 1487 (17.0%) 5055 (57.7%) 8754
Age, mean years (S.D.)a 33.6 (10.6) 46.0 (15.8) 45.5 (16.2) 42.6 (15.8)
Age range (years) 16–79 16–85 16–89 16–89
Gender (% female)a 32.1% 58.0% 51.5% 47.7% Diagnoses; N (%) Schizophrenia 1396 (63.1%) – – 1396 (15.9%) Bipolar I disorder 135 (6.1%) – – 135 (1.5%) Psychosis NOS 168 (7.6%) – – 168 (1.9%) Schizophreniform disorder 158 (7.1%) – – 158 (1.8%) Schizoaffective disorder 124 (5.6%) – – 124 (1.4%)
Brief psychotic disorder 56 (2.5%) – – 56 (0.6%)
Other psychotic illness 175 (7.9%) – – 175 (2.0%)
Depression 246 (16.5%) 232 (4.6%) 478 (5.5%)
Anxiety 47 (3.2%) 24 (0.5%) 71 (0.8%)
Other non-psychotic illness 62 (4.2%) 106 (2.1%) 168 (1.9%)
No psychiatric illness 1132 (76.1%) 4693 (92.8%) 5825 (66.5%)
Endophenotypes N=sample size, Mean (SD) of raw scores unadjusted for covariates
P300 amplitude (μV) N = 397 N = 379 N = 313 N = 1089
10.5 (6.1) 11.0 (6.7) 13.7 (7.0) 11.6 (6.7)
P300 latency (ms) N = 401 N = 386 N = 315 N = 1102
382.6 (55.3) 390.8 (56.1) 356.9 (39.1) 378.2 (53.3)
Lateral ventricular volume (cm3) N = 700 N = 337 N = 684 N = 1721
17.9 (9.9) 18.7 (11.2) 15.8 (8.8) 17.1 (9.8)
Block Design (% of max. score) N = 850 N = 895 N = 3746 N = 5491
49.9 (27.9) 47.4 (25.6) 60.4 (21.2) 56.6 (23.8)
Digit Span (% of max. score) N = 460 N = 136 N = 2531 N = 3127
47.4 (15.9) 40.0 (4.5) 51.5 (14.5) 50.4 (14.9) RAVLT immediate recall (no. of words recalled) N = 1232 N = 934 N = 1377 N = 3543
7.6 (2.2) 8.4 (2.1) 8.7 (2.0) 8.2 (2.2)
RAVLT delayed recall (no. of words recalled) N = 1224 N = 927 N = 1358 N = 3509
2.1 (1.0) 2.9 (1.0) 2.9 (0.9) 2.6 (1.0)
S.D., standard deviation; NOS, not otherwise specified; RAVLT, Rey auditory verbal learning task.
aMissing data for age (717 subjects) and gender (6 subjects).
The group differences in endophenotype performance adjusted by covariates are reported inTable 2.
Psychological Medicine
1327
https://www.cambridge.org/core/terms. https://doi.org/10.1017/S0033291717002860
EEG data collection and processing
Electrophysiological data were obtained from three sites (online
Supplementary Table S1). EEG data acquisition and processing
methods varied slightly between sites as summarised below. The
full methods for each site are reported elsewhere (Weisbrod
et al.
1999
; Bramon et al.
2005
; Hall et al.
2006b
; Price et al.
2006
; Waters et al.
2009
).
In summary, EEG was collected from 17 to 20 electrodes
placed according to the International 10/20 system (Jasper,
1958
). The P300 event related potential was obtained using a
standard two-tone frequency deviant auditory oddball paradigm,
with standard (
‘non target’) tones of 1000 Hz and rare (‘target’)
tones of 1500 Hz. The number of tones presented varied from
150 to 800, the tones were 80 dB or 97 dB, lasted for 20
–50 ms,
and the inter-stimulus interval was between 1 and 2 s. The
major-ity of participants (93.4%) were asked to press a button in
response to
‘target’ stimuli, but a subset were asked to close
their eyes and count
‘target’ stimuli in their head.
The data were continuously recorded in one of three ways: 500
Hz sampling rate and 0.03
–120 Hz band pass filter; 200 Hz
sam-pling rate and 0.05–30 Hz band pass filter; or 400 Hz samsam-pling
rate and 70 Hz low-pass filter. Linked earlobes or mastoids were
used as reference and vertical, and in most cases also horizontal,
electro-oculographs were recorded at each site and used to correct
for eye-blink artefacts using regression based weighting
coeffi-cients (Semlitsch et al.
1986
). After additional manual checks,
artefact-free epochs were included and baseline corrected before
averaging. The averaged waveforms to correctly detected targets
were then filtered using 0.03 or 0.05 Hz high-pass and 30 or 45
Hz low-pass filters. The peak amplitude and latency of the P300
were measured at electrode location PZ (parietal midline), within
the range of 250
–550 ms post-stimulus.
MRI data collection and processing
MRI data acquisition and image processing varied between sites;
see previous publications and the supplementary materials for an
outline of the methods used for each centre (Barta et al.
1997
;
Frangou et al.
1997
; Hulshoff Pol et al.
2002
; McDonald et al.
2002
,
2006
; McIntosh et al.
2004
,
2005a
,
b
; Schulze et al.
2006
;
Crespo-Facorro et al.
2009
; Dutt et al.
2009
; Mata et al.
2009
;
Wobrock et al.
2009
; Habets et al.
2011
; Collip et al.
2013
).
Field strengths included 1, 1.5 or 3 Tesla. Lateral ventricular
volumes were measured using automatic or semi-automatic
region of interest analyses, and included the body, frontal,
occipi-tal, and temporal horns.
Statistical methods
Mega-analysis of group comparisons
Endophenotype measures were first standardised for each site
separately using the mean and standard deviation within each
site. Linear regression analyses for each measure were used to
establish whether endophenotype performance differed according
to group (patients, relatives, and controls). The outcome in each
regression model was the endophenotype measure and the main
predictor was group. These analyses were adjusted for age, gender,
clinical group, study site and, where significant, group × site
interactions.
Associations between endophenotypes
Linear regression models were used to investigate associations
between each pair of endophenotypes. Potential effect
modifica-tion by group membership was assessed by specifying in the
stat-istical model a term for the interaction between the predictor of
the endophenotype pair and group (patient, relative, control).
Where we found evidence that the relationship between a pair
of endophenotypes differed according to group, associations are
reported separately for patients, relatives, and controls. Where
there was no evidence of effect modification, the interaction
term was dropped from the model, and associations are reported
for the whole sample adjusted for group. These analyses were
adjusted for age, gender, clinical group, and study site.
In all analyses, we accounted for correlations between
indivi-duals within families using robust standard errors. 63% of the
par-ticipants had no other family member taking part, but the study
also included 1056 families of 2
–11 members each (85% of the
families had only two members included in the sample). This
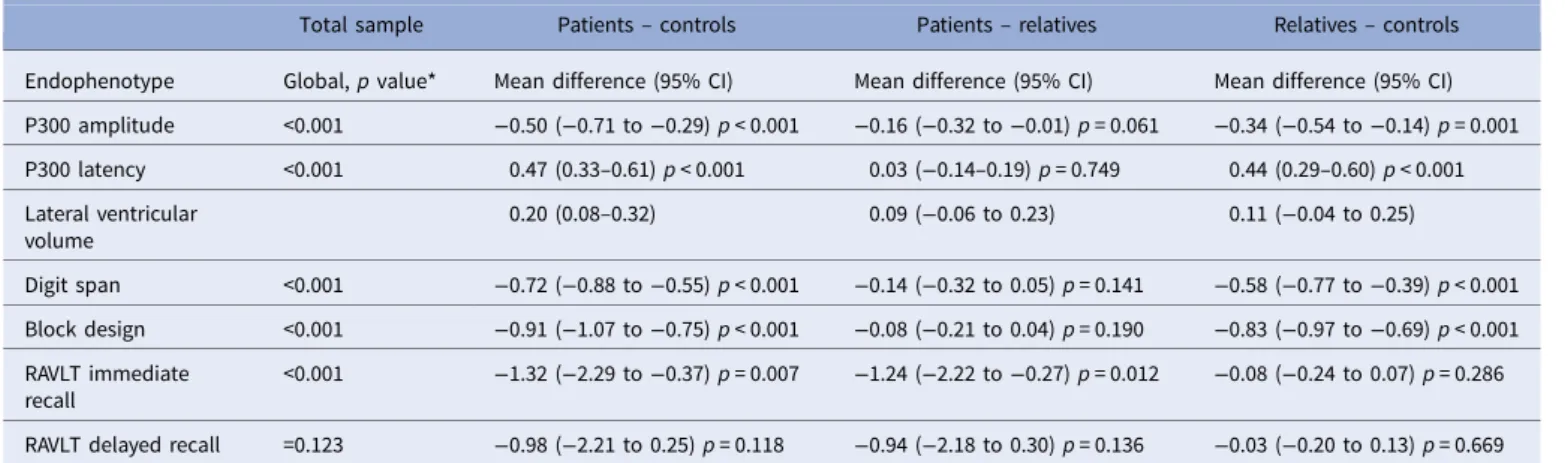
Table 2.Endophenptype performance comparison across clinical groups
Total sample Patients– controls Patients– relatives Relatives– controls Endophenotype Global, p value* Mean difference (95% CI) Mean difference (95% CI) Mean difference (95% CI) P300 amplitude <0.001 −0.50 (−0.71 to −0.29) p < 0.001 −0.16 (−0.32 to −0.01) p = 0.061 −0.34 (−0.54 to −0.14) p = 0.001 P300 latency <0.001 0.47 (0.33–0.61) p < 0.001 0.03 (−0.14–0.19) p = 0.749 0.44 (0.29–0.60) p < 0.001 Lateral ventricular volume 0.20 (0.08–0.32) 0.09 (−0.06 to 0.23) 0.11 (−0.04 to 0.25) Digit span <0.001 −0.72 (−0.88 to −0.55) p < 0.001 −0.14 (−0.32 to 0.05) p = 0.141 −0.58 (−0.77 to −0.39) p < 0.001 Block design <0.001 −0.91 (−1.07 to −0.75) p < 0.001 −0.08 (−0.21 to 0.04) p = 0.190 −0.83 (−0.97 to −0.69) p < 0.001 RAVLT immediate recall <0.001 −1.32 (−2.29 to −0.37) p = 0.007 −1.24 (−2.22 to −0.27) p = 0.012 −0.08 (−0.24 to 0.07) p = 0.286 RAVLT delayed recall =0.123 −0.98 (−2.21 to 0.25) p = 0.118 −0.94 (−2.18 to 0.30) p = 0.136 −0.03 (−0.20 to 0.13) p = 0.669 Linear regression models investigating group differences on endophenotype performance. Endophenotype data were standardised for each site using the mean and standard deviation within each site. The main predictor was clinical group (patients, relatives, and controls). All models included age, gender, study site and, where significant, group × centre interactions. We used robust standard errors to account for correlations within families in all models.
*P value for the overall test of a group effect; Note that p values were not produced for the models that include lateral ventricular volume since we used bootstrapping, which is a percentile-based method; therefore we looked at the bias-corrected confidence intervals to check for significance.
family clustering violates the independence of observations
assumption in linear regression. To account for this clustered
structure in the dataset we created a new variable
‘family ID’
that was shared by all individuals in each family. Then we used
the variance estimator with the robust cluster option in all the
lin-ear regression models. This allowed us to account for the
within-family correlations and maintain correct type-1 error rates. This is
a standard approach in family studies (Shaikh et al.
2013
; Bramon
et al.
2014
; Ranlund et al.
2014
).
We examined the distribution of residuals and plots of
resi-duals v. fitted values for all models and were able to rule out
departures from normality and heteroscedasticity. Lateral
ven-tricular volume showed a positively skewed distribution and to
account for this we used bootstrap methods for analyses where
this is the outcome variable. Heteroscedasticity was not found
to be a concern for ventricular volumes. P values are not
pre-sented for the models which used bootstrapping; instead, we
examined the 95% bias-corrected confidence intervals to check
for statistical significance at the 5% level ( p = 0.05).
Although we tested seven endophenotypes, we expect
mea-surements within domains to be correlated and thus a correction
of p values by seven tests through Bonferroni or other methods
was deemed too stringent for a hypothesis-driven study such as
this (Rothman,
1990
; Savitz & Olshan,
1995
; Perneger,
1998
).
We therefore corrected for associations between three domains
(EEG, MRI, cognition), with a corrected significance threshold
of 0.05/3 = 0.0167, that we rounded to the slightly more stringent
cut-off of p < 0.01. Statistical analyses were conducted using
STATA version 13.
Results
Sample characteristics
The sample characteristics are summarised in
Table 1
. Patients
were on average 12.4 years younger than relatives (95% CI:
11.4
–13.4; p < 0.001) and 11.9 years younger than controls (95%
CI: 11.1
–12.7; p < 0.001). There was no evidence of any age
differ-ence between relatives and controls. There was a lower proportion
of females than males among patients than among relatives and
controls (32.1%, 58.0%, and 51.5% respectively; global p < 0.001).
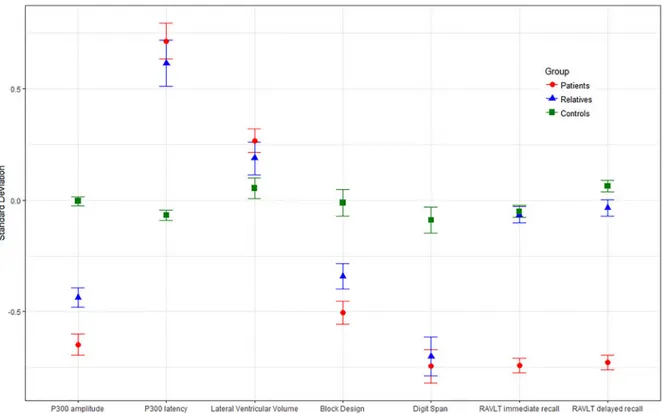
Group comparisons on endophenotype performance
As shown in
Fig. 1
and
Table 2
, differences between the three
par-ticipant groups on the endophenotypes followed the expected
pat-tern with performance improving from patients through to
relatives and controls. We found evidence that patients’ scores
dif-fered significantly from those of controls with smaller P300
amplitudes, delayed P300 latency, larger lateral ventricular
volumes and deficits in digit span, block design and RVLT
imme-diate recall. When compared with controls, the unaffected
rela-tives showed reduced P300 amplitude, delayed P300 latency and
poorer performance in digit span and block design.
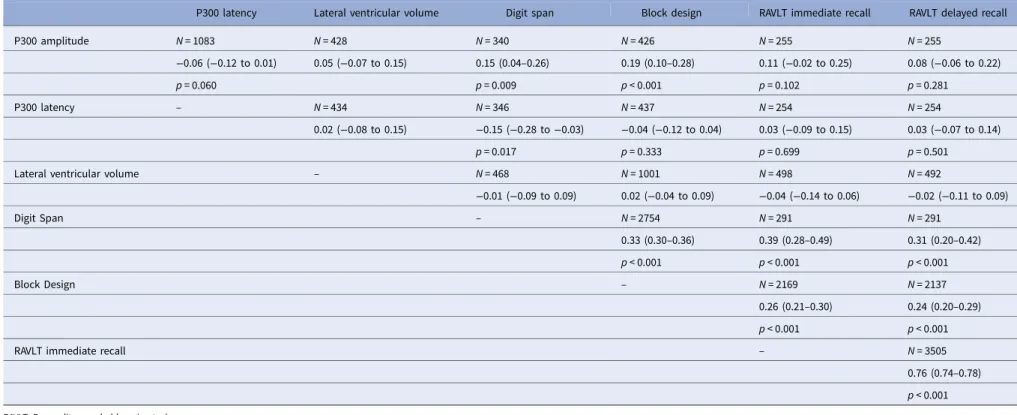
Associations between endophenotype pairs
Associations which do not differ according to clinical group
Associations between endophenotype pairs where there was no
evidence of effect modification by group are reported in
Table 3
. There was no evidence of an association between the
P300 amplitude and latency at the 1% level of statistical
significance (coef.
−0.06, 95% CI −0.12 to 0.01, p = 0.06). The
P300 amplitude was positively associated with digit span (coef.
0.15, 95% CI 0.04
–0.26, p = 0.009) and block design (coef. 0.19,
95% CI 0.10
–0.28, p < 0.001) performances, but not with either
of the RAVLT measures. The P300 latency showed weak evidence
of a negative association with digit span (coef.
−0.15, 95& CI
−0.28 to −0.03, p = 0.017). Lateral ventricular volume showed
no evidence of an association with any of the other measures.
All cognitive pairings were significantly positively associated (all
p < 0.001).
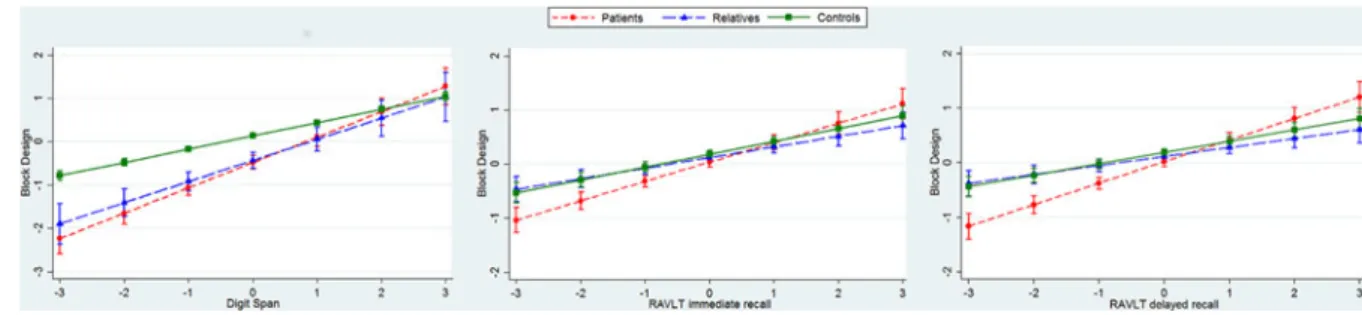
Associations which differ according to clinical group
For three pairs of cognitive endophenotypes, we found evidence
of an interaction with group. This indicates that the association
between these endophenotype pairs differs between patients,
relatives, and controls, as reported in
Fig. 2
(and online
Supplementary Table S3 in the Supplement). In all three cases,
the relationship between endophenotype pairs was in the same
direction for the three groups, differing only in magnitude.
There was strong evidence that digit span and RAVLT
imme-diate and delayed recall were positively associated with scores on
the block design task in all three groups (patients, relatives, and
controls). The magnitude of each association was greater among
patients than controls (all p < 0.01), but there was no evidence
that the strength of the relationship among relatives was different
from that among controls (all p > 0.03). See online supplementary
Table S3 for full results.
Discussion
This study examined the relationships between different
multi-modal psychosis endophenotypes in a large multi-centre sample
of patients, their unaffected first-degree relatives, and controls.
Our mega-analysis confirms that both patients and relatives
showed reduced amplitudes and prolonged latencies of the
P300, compared with controls, replicating past findings and
pro-viding further evidence that these are endophenotypes for
psych-osis (Turetsky et al.
2000
; Bramon et al.
2005
; Price et al.
2006
;
Schulze et al.
2008
; Thaker,
2008
; Bestelmeyer et al.
2009
; Díez
et al.
2013
). We found no evidence of association between the
P300 amplitude and latency, indicating that these are independent
measures. To examine whether variability on P300 amplitude and
latency could potentially affect the correlations between these, we
tested for heteroscedasticity between clinical groups. The standard
deviations between the patient, relative, and control groups did
not vary significantly and are thus unlikely to explain the lack
of correlation between P300 amplitude and latency performance.
In contrast to our results, Hall et al. (Hall et al.
2006a
) and Polich
et al. (Polich,
1992
; Polich et al.
1997
) found a negative correlation
between the amplitude and latency. Notably however, these past
studies included only small samples (up to 128 participants)
com-pared with our study (N = 1083), and they did not take into
account covariates such as age and gender that are known to
influence both P300 parameters (Goodin et al.
1978
; Polich
et al.
1985
; Conroy & Polich,
2007
; Chen et al.
2013
).
Furthermore, in the studies by Polich et al. (Polich,
1992
; Polich
et al.
1997
) the amplitude
– latency correlation was strongest
over frontal electrodes, and not parietal as investigated in our
cur-rent study. More recently, Hall et al. (
2014
) found a negative
cor-relation between the amplitude and latency in a sample of 274
patients with psychosis and controls after controlling for age
and gender effects. Further research is thus needed to clarify the
Psychological Medicine
1329
https://www.cambridge.org/core/terms. https://doi.org/10.1017/S0033291717002860
relationship between the P300 amplitude and latency. However,
our findings in this large sample suggest that the measures are
independent, indexing separate brain functions.
We found associations between the P300 amplitude and both
digit span and block design, as in previous smaller studies (Souza
et al.
1995
; Polich et al.
1997
; Fjell & Walhovd,
2001
; Hermens
et al.
2010
; Kaur et al.
2011
; Dong et al.
2015b
). According to
the context-updating theory (Heslenfeld,
2003
; Kujala &
Naatanen,
2003
), the P300 amplitude is an attention-driven,
context-updating mechanism, which subsequently feeds into
memory stores (Polich,
2007
,
2011
). Hence, one would expect
the amplitude to be associated with cognitive tasks that require
attention and working memory, such as digit span and block
design (Näätänen,
1990
; Baddeley,
1992
; Ford,
2014
). The
context-updating theory provides a possible explanation for the
association between P300 amplitude and block design, since this
task requires a constant update of the mental representation of
the blocks, in order to complete the target pattern (Polich,
2007
,
2011
). The lack of evidence for associations between P300
amplitude and the RAVLT tests support the idea that the
neuro-biology of verbal memory is distinct from the attentional and
working memory processes linked to the P300 amplitude
(Polich,
2011
).
The P300 latency showed evidence of a trend-level association
with digit span, and no evidence of an association with the other
measures. Previous studies have provided conflicting results, with
some reporting associations with attention and working memory
(Polich et al.
1983
), while others have not (Fjell & Walhovd,
2001
;
Walhovd & Fjell,
2003
; Dong et al.
2015b
). The P300 latency has
been conceptualised as a measure of classification speed (Polich,
2011
; van Dinteren et al.
2014
). Investigating the relationship
between behavioural reaction times (i.e. the speed of button
press in the task) and the P300 latency, some have found
associa-tions (Bashore et al.
2014
) while others have not (Ramchurn et al.
2014
). Furthermore, there is a substantial body of research
show-ing that the P300 latency as well as reaction times increase (that is
they slow down) with ageing in healthy participants (Polich,
1996
;
Chen et al.
2013
). Based on our findings we hypothesise that the
P300 latency is a specific measure of processing speed at a basic
neuronal level. In contrast, block design and the RAVLT task
–
while influenced by processing speed
– reflect wider cognition
including spatial abilities and verbal memory. The more complex
elements to these tasks may therefore obscure effects of a simple
processing speed, and hence explain the lack of association with
P300 latency. The trend-level association with digit span
perform-ance
– a task dependent on attention and short-term working
memory
– is in line with this interpretation too.
In terms of lateral ventricular volume, there was no evidence of
a relationship with any other endophenotype investigated.
Enlargement of cerebral ventricles remains the best replicated
bio-logical marker in schizophrenia and bipolar disorder, according to
several meta-analyses (Kempton et al.
2010
; Olabi et al.
2011
; De
Peri et al.
2012
; Fusar-Poli et al.
2013
; Fraguas et al.
2016
; van Erp
et al.
2016
; Huhtaniska et al.
2017
; Moberget et al.
2017
). Our
hypothesis that ventricular volumes would correlate with other
endophenotypes of a functional nature was not confirmed by
our data. Of course for such analyses our sample size was modest
ranging 428
–1001 and lack of statistical power could be a
poten-tial reason. Keilp et al. (Keilp et al.
1988
) found an association
with verbal memory and others have found enlarged lateral
ven-tricles to be associated with poorer motor speed (Antonova et al.
2004
; Hartberg et al.
2011
; Dong et al.
2015a
). A limitation of our
study is the heterogeneity of the MRI methodology between study
sites, which might have obscured any true associations. We
Fig. 1.Estimated marginal means (adjusted for average age, gender, and study site) of standardised endophenotype scores by group (patients, relatives, andTable 3.Adjusted associations between endophenotypes in the whole sample
P300 latency Lateral ventricular volume Digit span Block design RAVLT immediate recall RAVLT delayed recall
P300 amplitude N = 1083 N = 428 N = 340 N = 426 N = 255 N = 255 −0.06 (−0.12 to 0.01) 0.05 (−0.07 to 0.15) 0.15 (0.04–0.26) 0.19 (0.10–0.28) 0.11 (−0.02 to 0.25) 0.08 (−0.06 to 0.22) p = 0.060 p = 0.009 p < 0.001 p = 0.102 p = 0.281 P300 latency – N = 434 N = 346 N = 437 N = 254 N = 254 0.02 (−0.08 to 0.15) −0.15 (−0.28 to −0.03) −0.04 (−0.12 to 0.04) 0.03 (−0.09 to 0.15) 0.03 (−0.07 to 0.14) p = 0.017 p = 0.333 p = 0.699 p = 0.501
Lateral ventricular volume – N = 468 N = 1001 N = 498 N = 492
−0.01 (−0.09 to 0.09) 0.02 (−0.04 to 0.09) −0.04 (−0.14 to 0.06) −0.02 (−0.11 to 0.09) Digit Span – N = 2754 N = 291 N = 291 0.33 (0.30–0.36) 0.39 (0.28–0.49) 0.31 (0.20–0.42) p < 0.001 p < 0.001 p < 0.001 Block Design – N = 2169 N = 2137 0.26 (0.21–0.30) 0.24 (0.20–0.29) p < 0.001 p < 0.001
RAVLT immediate recall – N = 3505
0.76 (0.74–0.78) p < 0.001
RAVLT, Rey auditory verbal learning task.
Regression models using standardised scores, adjusted for age, gender, study site and group using robust standard errors to account for correlations within families and, where significant, group × by centre interactions.
Statistics reported are sample sizes, regression coefficients (95% confidence intervals), and p values. Note that p values were not produced for the models that include lateral ventricular volume since we used bootstrapping, which is a percentile-based method; therefore we looked at the bias-corrected confidence intervals to check for significance.
Ps
ychological
Medicine
1331
https://www.cambridge.org/core/terms . https://doi.org/10.1017/S0033291717002860 Downloaded from https://www.cambridge.org/core. Bilkent University Library
, on
25 Feb 2019 at 13:28:11
conclude that ventricular volumes do not seem to exert a
detect-able influence on brain function in terms of cognition or cortical
neurophysiology, however association studies of
structural-functional biomarkers in larger samples are needed.
With regard to group comparisons, although patients showed
enlarged lateral ventricles compared with controls, a very well
supported finding (Wright et al.
2000
; Steen et al.
2006
; Cahn
et al.
2009
; Kempton et al.
2010
), having adjusted by age and
sex we observed no volume differences between relatives and
con-trols. This is consistent with the latest meta-analysis of brain
structure in relatives of patients with schizophrenia (Boos et al.
2007
), and suggests that enlarged ventricles in patients are less
heritable than previously thought. Instead, they might be related
to illness progression, or to environmental effects or antipsychotic
medication, as seen in both animal models of antipsychotic
exposure (Dorph-Petersen et al.
2005
; Konopaske et al.
2007
),
and in human studies (Ho et al.
2011
; Fusar-Poli et al.
2013
;
Van Haren et al.
2013
).
For all cognitive measures, patients performed less well than
controls, consistent with extensive literature (Ayres et al.
2007
;
Horan et al.
2008
; Bora et al.
2010
,
2014
; Fusar-Poli et al.
2012
;
Bora & Murray,
2014
; Fatouros-Bergman et al.
2014
; Stone
et al.
2015
). For the digit span and block design, there were
also statistically significant differences between relatives and
con-trols, suggesting a possible effect of increased genetic risk for
psychosis. However, this was not seen for the immediate or
delayed recall of the RAVLT task, where controls and relatives
had similar performance. While some have reported verbal
mem-ory impairments in relatives of patients (Sitskoorn et al.
2004
;
Wittorf et al.
2004
; Massuda et al.
2013
), other studies have not
(Üçok et al.
2013
; Kim et al.
2015a
). These findings suggest
that working memory and spatial visualisation might represent
more promising endophenotypes for genetic research into
psych-osis than verbal memory.
The associations between pairs of cognitive measures were
strong and in the expected directions, as per previous findings
(Dickinson et al.
2002
; Sullivan et al.
2003
; Gladsjo et al.
2004
;
Sheffield et al.
2014
; Seidman et al.
2015
). It is interesting to
note that for some cognitive measures, the relationships interacted
with group; however, the direction of the effect remained the same
across patients, relatives, and controls. The interaction effects with
group were found exclusively amongst the cognitive measures,
and not in any of the other domains. This is possibly due to
the larger sample sizes for the cognitive measures, yielding greater
statistical power and enabling the detection of subtle interaction
effects.
Both the lack of interaction effects for most associations
inves-tigated, and the gradient effects identified (where there was an
interaction), are consistent with the notion that endophenotype
impairments characterising psychosis represent a continuum
that includes both relatives and the general population.
Ultimately this continuum reflects the underlying variation in
genetic liability of developing the disease (Johns & van Os,
2001
; Wiles et al.
2006
; Allardyce et al.
2007
; Esterberg &
Compton,
2009
; Ian et al.
2010
; DeRosse & Karlsgodt,
2015
).
This study has several limitations: Firstly, association analyses
could only be done for those participants with data available for
pairs of endophenotypes and this led to relatively smaller samples
for some of the associations. Secondly, there was a mismatch in
age and gender between patients and relatives. The group of
rela-tives has older individuals and more females compared with the
group of patients who are younger and include more males.
This is a common occurrence in psychosis family studies because
the onset of psychosis in typically in youth. Most of the families
who participated in the study include unaffected parents (with
greater participation of mothers) and their affected and unaffected
offspring. Family studies in psychosis are less likely to recruit
affected parents. Because of this, we recruited a control group
with a wider age range than either the other groups and with a
balanced gender distribution so as to improve the age and sex
matching across the two key comparisons (controls v. patients,
controls v. relatives). Furthermore, since age and sex remains a
potential confounder, we included age and sex as co-variates in
the models throughout the study. As shown in online
Supplementary Table S4 in the supplement, there was no evidence
of model instability based on the estimates and confidence
inter-val width between the models with and without age and sex.
Another limitation of this study is that we were unable to
account for potential moderators such as tobacco, other drug
use and medication. Also, information about participants
’
socio-economic status was not available. These clinical and
demo-graphic variables could have a potentially important influence
on how the three clinical groups perform on endophenotypes.
However, the main analyses, which was to investigate associations
between endophenotypes are all done within-individuals and are
thus less likely to be influenced by exposure to drugs and
medi-cation. As for clinical variables such as depression, the sample
included 5.5% of individuals with a history of depression.
Depression did not constitute an exclusion criterion for our
study because it is such a prevalent disorder that if excluded it
would probably make our findings hard to generalize. We have
re-analysed the group comparisons excluding all participants
with a history of depression and the overall findings are
unchanged.
A further potential limitation was the heterogeneity of
meth-ods between study sites; differences in cognitive test versions
Fig. 2.Interactions between group (patient, relative, and control) and endophenotype pairs (standardised scores). Graphs are adjusted for covariates (age, gender,and variation on the EEG and MRI protocols all introduced
greater variability into the data. All measures were standardised
within centres to minimise this variability. Despite this challenge,
it is precisely through this multi-centre effort that we were able to
achieve a very large sample, the key strength of this study. As the
Psychiatric Genomics Consortium
’s work shows, large
inter-national collaborations are essential in genetic studies of common
diseases and traits (Sklar et al.
2011
; Lee et al.
2013
; Smoller et al.
2013
; Ripke et al.
2014
). A further strength of this study is the use
of regression models as opposed to the correlation approach
fre-quently seen in the literature (Brewer et al.
1970
; Polich et al.
1983
,
1997
; Breteler et al.
1994
; Brillinger,
2001
; Kim et al.
2003
), which allowed us to account for somme important
con-founding factors, such as ageing effects. Not only did this
approach reduce vulnerability to spurious correlations, but it
allowed the examination of interesting interaction effects across
groups.
In summary, this study has investigated the relationships
between endophenotypes for psychosis, including measures of
cognition, electrophysiology, and brain structure. We have
shown that cognitive measures are associated with each other as
expected, and we have provided support for the notion that the
amplitude and latency of the P300 are independent
endopheno-types. The P300 amplitude is an index of spatial visualisation
and working memory, while the latency is hypothesised to be a
correlate of basic speed of processing. Individuals with psychotic
illnesses, their unaffected relatives, and healthy controls all have
similar patterns of associations between all pairs of
endopheno-types, endorsing the theory of a continuum of liability of
develop-ing psychosis across the population.
Co-authors who are members of the Psychosis Endophenotypes
International Consortium (PEIC):
Maria J. Arranz
1,2, Steven Bakker
3, Stephan Bender
4,5, Elvira
Bramon
6,2, David Collier
7,2, Benedicto Crespo-Facorro
8,9, Marta
Di Forti
2, Jeremy Hall
10, Mei-Hua Hall
11, Conrad Iyegbe
2,
Assen Jablensky
12, René S. Kahn
3, Luba Kalaydjieva
13, Eugenia
Kravariti
2, Stephen M Lawrie
10, Cathryn M. Lewis
2, Kuang
Lin
2,14, Don H. Linszen
15, Ignacio Mata
16,9, Colm McDonald
17,
Andrew M McIntosh
10,18, Robin M. Murray
2, Roel A. Ophoff
19,
Marco Picchioni
2, John Powell
2, Dan Rujescu
20,21, Timothea
Toulopoulou
2,22,23, Jim Van Os
24,2, Muriel Walshe
6,2, Matthias
Weisbrod
25,5, and Durk Wiersma
26.
PEIC affiliations:
1
Fundació de Docència i Recerca Mútua de Terrassa,
Universitat de Barcelona, Catalonia, Spain.
2
Institute of Psychiatry, Psychology and Neuroscience, King
’s
College London, De Crespigny Park, London SE5 8AF, UK.
3
University
Medical
Center
Utrecht,
Department
of
Psychiatry, Rudolf Magnus Institute of Neuroscience, The
Netherlands.
4
Child and Adolescent Psychiatry, University of Technology
Dresden, Fetscherstrasse 74, 01307 Dresden, Germany.
5
General
Psychiatry,
Vossstraße
4,
69115
Heidelberg,
Germany.
6
Division of Psychiatry & Institute of Cognitive Neuroscience,
University College London, UK.
7
Discovery Neuroscience Research, Lilly, UK.
8
University
Hospital
Marqués
de
Valdecilla,
IDIVAL,
Department of Psychiatry, School of Medicine, University of
Cantabria, Santander, Spain.
9
CIBERSAM, Centro Investigación Biomédica en Red Salud
Mental, Madrid, Spain.
10
College of Biomedical and Life Sciences, Cardiff University,
CF24 4HQ Cardiff, UK.
11
Mclean Hospital, Harvard Medical School, Belmont MA,
USA.
12
Centre for Clinical Research in Neuropsychiatry, The
University of Western Australia, Perth, Australia.
13
Western Australian Institute for Medical Research and
Centre for Medical Research, The University of Western
Australia, Perth, Australia.
14
Nuffield Department of Population Health, University of
Oxford, Ocford, UK.
15
Academic Medical Centre University of Amsterdam,
Department of Psychiatry, Amsterdam The Netherlands.
16
Fundacion Argibide, Pamplona, Spain.
17The Centre for Neuroimaging &Cognitive Genomics
(NICOG) and NCBES Galway Neuroscience Centre, National
University of Ireland Galway, Galway Ireland.
18
Centre for Cognitive Ageing and Cognitive Epidemiology,
University of Edinburgh, UK.
19
UCLA Center for Neurobehavioral Genetics, 695 Charles
E. Young Drive South, Los Angeles CA 90095, USA.
20
University of Munich, Dept. of Psychiatry, Munich,
Germany.
21
University of Halle, Dept. of Psychiatry, Halle, Germany.
22Department of Psychology, Bilkent University, Main
Campus, Bilkent, Ankara, Turkey.
23
The State Key Laboratory of Brain and Cognitive Sciences
and the Department of Psychology, The University of Hong
Kong, Hong Kong, China.
24
Maastricht University Medical Centre, South Limburg
Mental Health Research and Teaching Network, EURON,
Maastricht, The Netherlands.
25
General Psychiatry and Psychotherapy, SRH Klinikum
Karlsbad-Langensteinbach, Guttmannstrasse 1, 76307 Karlsbad,
Germany.
26
University Medical Center Groningen, Department of
Psychiatry, University of Groningen, The Netherlands.
Co-authors who are members of the Genetic Risk and Outcome
of Psychosis (GROUP) consortium:
Richard Bruggeman, MD, PhD, Department of Psychiatry,
University Medical Center Groningen, University of Groningen;
Wiepke Cahn, MD, PhD, Department of Psychiatry, Rudolf
Magnus Institute of Neuroscience, University Medical Center
Utrecht; Lieuwe de Haan, MD, PhD, Department of Psychiatry,
Academic Medical Center, University of Amsterdam; René
S. Kahn, MD, PhD, Department of Psychiatry, Rudolf Magnus
Institute of Neuroscience, University Medical Center Utrecht,
Utrecht, the Netherlands; Carin Meijer, PhD, Department of
Psychiatry, Academic Medical Center, University of Amsterdam;
Inez Myin-Germeys, PhD, South Limburg Mental Health
Research
and
Teaching
Network,
EURON,
Maastricht
University Medical Center; Jim van Os, MD, PhD, South
Limburg Mental Health Research and Teaching Network,
EURON, Maastricht University Medical Center, Maastricht, the
Netherlands, and King
’s College London, King’s Health
Partners,
Department
of
Psychosis
Studies,
Institute
of
Psychiatry,
London,
England;
and
Agna
Bartels,
PhD,
Department
of
Psychiatry,
University
Medical
Center
Groningen, University.
Supplementary material. The supplementary material for this article can be found athttps://doi.org/10.1017/S0033291717002860.
Psychological Medicine
1333
https://www.cambridge.org/core/terms. https://doi.org/10.1017/S0033291717002860
Acknowledgements. We would like to thank all the patients, relatives, and controls who took part in this research, as well as the clinical staff who facili-tated their involvement. This work was supported by the Medical Research Council (G0901310) and the Wellcome Trust (grants 085475/B/08/Z, 085475/Z/08/Z). We thank the UCL Computer Science Cluster team for their excellent support. This study was supported by the NIHR Biomedical Research Centre at University College London (mental health theme) and by the NIHR Biomedical Research Centre for Mental Health at the South London and Maudsley NHS Foundation Trust and Institute of Psychiatry Kings College London.
E. Bramon thanks the following funders: BMA Margaret Temple grants 2016 and 2006, MRC- Korean Health Industry Development Institute Partnering Award (MC_PC_16014), MRC New Investigator Award and a MRC Centenary Award (G0901310), National Institute of Health Research UK post-doctoral fellowship, the Psychiatry Research Trust, the Schizophrenia Research Fund, the Brain and Behaviour Research foundation’s NARSAD Young Investigator Awards 2005, 2008, Wellcome Trust Research Training Fellowship.
Further support: The Brain and Behaviour Research foundation’s (NARSAD’s) Young Investigator Award (Grant 22604, awarded to C. Iyegbe). The BMA Margaret Temple grant 2016 to Johan Thygesen. European Research Council Marie Curie award to A Díez-Revuelta.
The infrastructure for the GROUP consortium is funded through the Geestkracht programme of the Dutch Health Research Council (ZON-MW, grant number 10-000-1001), and matching funds from partici-pating pharmaceutical companies (Lundbeck, AstraZeneca, Eli Lilly, Janssen Cilag) and universities and mental health care organizations (Amsterdam: Academic Psychiatric Centre of the Academic Medical Center and the men-tal health institutions: GGZ Ingeest, Arkin, Dijk en Duin, GGZ Rivierduinen, Erasmus Medical Centre, GGZ Noord Holland Noord. Maastricht: Maastricht University Medical Centre and the mental health institutions: GGZ Eindhoven en de kempen, GGZ Breburg, GGZ Oost-Brabant, Vincent van Gogh voor Geestelijke Gezondheid, Mondriaan Zorggroep, Prins Clauscentrum Sittard, RIAGG Roermond, Universitair Centrum Sint-Jozef Kortenberg, CAPRI University of Antwerp, PC Ziekeren Sint-Truiden, PZ Sancta Maria Sint-Truiden, GGZ Overpelt, OPZ Rekem. Groningen: University Medical Center Groningen and the mental health institutions: Lentis, GGZ Friesland, GGZ Drenthe, Dimence, Mediant, GGNet Warnsveld, Yulius Dordrecht and Parnassia psycho-medical center (The Hague). Utrecht: University Medical Center Utrecht and the mental health institutions Altrecht, GGZ Centraal, Riagg Amersfoort and Delta.).
The sample from Spain was collected at the Hospital Universitario Marqués de Valdecilla, University of Cantabria, Santander, Spain, under the following grant support: Carlos III Health Institute PI020499, PI050427, PI060507, Plan Nacional de Drugs Research Grant 2005-Orden sco/3246/2004, SENY Fundació Research Grant CI 2005-0308007 and Fundación Marqués de Valdecilla API07/011. We wish to acknowledge Biobanco HUMV-IDIVAL for hosting and managing blood samples and IDIVAL Neuroimaging Unit for imaging acquirement and analysis.
All authors declare that they have no financial interests or potential con-flicts of interest.
References
Allardyce J, Suppes T, van Os J(2007) Dimensions and the psychosis pheno-type. International Journal of Methods in Psychiatric Research 16, S34–S40. Andreasen NC, Flaum M, Arndt S(1992) The Comprehensive Assessment of Symptoms and History (CASH) An instrument for assessing diagnosis and psychopathology. Archives of General Psychiatry 49, 615.
Antonova E, Sharma T, Morris R, Kumari V (2004) The relationship between brain structure and neurocognition in schizophrenia: a selective review. Schizophrenia Research 70, 117–145.
APA(1994) Diagnostic and Statistical Manual of Mental Disorders, 4th edn. American Psychiatric Association: Washington.
Ayres AM, Busatto GF, Menezes PR, Schaufelberger MS, Coutinho L, Murray RM, McGuire PK, Rushe T, Scazufca M(2007) Cognitive deficits
in first-episode psychosis: a population-based study in São Paulo, Brazil. Schizophrenia Research 90, 338–343.
Baddeley A(1992) Working memory. Science (New York, N.Y.) 255, 556–559. Barta PE, Dhingra L, Royall R, Schwartz E(1997) Improving sterological estimates for the volume of structures identified in three-dimensional arrays of spatial data. Journal of Neuroscience Methods 75, 111–118.
Bashore TR, Wylie SA, Ridderinkhof KR, Martinerie JM (2014) Response-specific slowing in older age revealed through differential stimu-lus and response effects on P300 latency and reaction time. Neuropsychology, Development, and Cognition. Section B, Aging, Neuropsychology and Cognition 21, 633–673.
Bestelmeyer PEG, Phillips LH, Crombie C, Benson P, Clair DS(2009) The P300 as a possible endophenotype for schizophrenia and bipolar disorder: evidence from twin and patient studies. Elsevier Ireland Ltd. Psychiatry Research 169, 212–219.
Birkett P, Sigmundsson T, Sharma T, Toulopoulou T, Griffiths TD, Reveley A, Murray R(2008) Executive function and genetic predisposition to schizophrenia– the Maudsley family study. American Journal of Medical Genetics Part B: Neuropsychiatric Genetics 147B, 285–293.
Blackwood DH, St Clair DM, Muir WJ, Duffy JC(1991) Auditory P300 and eye tracking dysfunction in schizophrenic pedigrees. Archives of General Psychiatry 48, 899–909.
Boos HBM, Aleman A, Cahn W, Hulshoff Pol H, Kahn RS(2007) Brain volumes in relatives of patients with schizophrenia: a meta-analysis. Archives of General Psychiatry 64, 297–304.
Bora E, Lin A, Wood SJ, Yung AR, McGorry PD, Pantelis C(2014) Cognitive deficits in youth with familial and clinical high risk to psychosis: a systematic review and meta-analysis. Acta Psychiatrica Scandinavica 130, 1–15. Bora E, Murray RM(2014) Meta-analysis of cognitive deficits in ultra-high risk
to psychosis and first-episode psychosis: do the cognitive deficits progress over, or after, the onset of psychosis? Schizophrenia Bulletin 40, 744–755. Bora E, Pantelis C (2015) Meta-analysis of cognitive impairment in
first-episode bipolar disorder: comparison with first-first-episode schizophrenia and healthy controls. Schizophrenia Bulletin 41, 1095–1104.
Bora E, Yucel M, Pantelis C(2009) Cognitive functioning in schizophrenia, schizoaffective disorder and affective psychoses: meta-analytic study. The British Journal of Psychiatry : The Journal of Mental Science 195, 475–482. Bora E, Yücel M, Pantelis C(2010) Cognitive impairment in affective
psych-oses: a meta-analysis. Schizophrenia Bulletin 36, 112–125.
Braff DL (2015) The importance of endophenotypes in schizophrenia research. Elsevier B.V. Schizophrenia Research 163, 1–8.
Bramon E, McDonald C, Croft RJ, Landau S, Filbey F, Gruzelier JH, Sham PC, Frangou S, Murray RM(2005) Is the P300 wave an endopheno-type for schizophrenia? A meta-analysis and a family study. NeuroImage 27, 960–968.
Breteler MM, van Amerongen NM, van Swieten JC, Claus JJ, Grobbee DE, van Gijn J, Hofman A, van Harskamp F(1994) Cognitive correlates of ventricular enlargement and cerebral white matter lesions on magnetic res-onance imaging. The Rotterdam Study. Stroke; A Journal of Cerebral Circulation 25, 1109–1115.
Brewer MB, Campbell DT, Crano WD(1970) Testing a single-factor model as an alternative to the misuse of partial correlations in hypothesis-testing research. Sociometry 33, 1.
Brillinger DR(2001) Does anyone know when the correlation coefficient is useful? A study of the times of extreme river flows. Technometrics 43, 266–273.
Cahn W, Rais M, Stigter FP, van Haren NEM, Caspers E, Hulshoff Pol HE, Xu Z, Schnack HG, Kahn RS(2009) Psychosis and brain volume changes during the first five years of schizophrenia. European Neuropsychopharmacology: The Journal of the European College of Neuropsychopharmacology 19, 147–151.
Cannon TD, Keller MC(2006) Endophenotypes in the genetic analyses of mental disorders. Annual Review of Clinical Psychology 2, 267–290. Cardno AG, Marshall EJ, Coid B, Macdonald AM, Ribchester TR,
Davies NJ, Venturi P, Jones LA, Lewis SW, Sham PC, Gottesman II, Farmer AE, McGuffin P, Reveley AM, Murray RM (1999) Heritability estimates for psychotic disorders: the Maudsley Twin psychosis series. Archives of General Psychiatry 56, 162–168.