CYCLODEXTRIN FUNCTIONALIZED NANOFIBERS VIA
ELECTROSPINNING
A DISSERTATION SUBMITTED TO
MATERIALS SCIENCE AND NANOTECHNOLOGY PROGRAM OF THE GRADUATE SCHOOL OF ENGINEERING AND SCIENCE
OF BILKENT UNIVERSITY
IN PARTIAL FULFILLMENT OF THE REQUIREMENTS FOR THE DEGREE OF
DOCTOR OF PHILOSOPHY
By
ASLI ÇELEBİOĞLU
ii
I certify that I have read this thesis and that in my opinion it is fully adequate, in scope and in quality, as a thesis of the degree of Doctor of Philosophy.
……….
Assoc. Prof. Dr. Tamer Uyar (Principal Advisor)
I certify that I have read this thesis and that in my opinion it is fully adequate, in scope and in quality, as a thesis of the degree of Doctor of Philosophy.
………. Prof. Dr. Jale Hacaloğlu
I certify that I have read this thesis and that in my opinion it is fully adequate, in scope and in quality, as a thesis of the degree of Doctor of Philosophy.
………. Assist. Prof. Dr. Bülend Ortaç
iii
I certify that I have read this thesis and that in my opinion it is fully adequate, in scope and in quality, as a thesis of the degree of Doctor of Philosophy.
………. Assist. Prof. Dr. Ferdi Karadaş
I certify that I have read this thesis and that in my opinion it is fully adequate, in scope and in quality, as a thesis of the degree of Doctor of Philosophy.
………. Assist. Prof. Dr. Engin Durgun
Approved for the Graduate School of Engineering and Science:
………. Prof. Dr. Levent Onural
iv
ABSTRACT
CYCLODEXTRIN FUNCTIONALIZED NANOFIBERS via
ELECTROSPINNING
Aslı Çelebioğlu
PhD in Materials Science and Nanotechnology Supervisor: Assoc. Prof. Dr. Tamer Uyar
August, 2014
Electrospinning is a commonly studied and widely applied technique for generating nanofibers, with a diameter ranging from several tens of nanometers to a few
micrometers. The low-cost, simple set-up, relatively high production rate and
reproducibility increase the interests on this method in both academia and industry. Electrospun nanofibers are produced from a broad range of materials with extremely high surface area, very light-weight, nano-porous features and distinct physical/mechanical properties. The general talk in this technique focuses on the
production of nanofibers from polymer base materials.However, very recent studies
demonstrated that, it is also possible to obtain nanofibers from non-polymeric
systems.For this novel development in electrospinning researches, we have achieved
to generate nanofibers from cyclodextrins (CD) without using a polymeric template. CD are cyclic oligosaccharides consisting of α-(1,4)-linked glucopyranose units. The truncated cone shape structure of CD provides a favorable place for various kinds of organic molecules to form non-covalent host-guest inclusion complexes (IC). The enhancements and progressing at the guest molecules property and situation, creating with the inclusion complexation, make CD applicable in variety of areas including filtration, pharmaceuticals, cosmetics, functional foods, textiles, analytic chemistry etc.
In this thesis, we report on the electrospinning of CD nanofibers, represent their functionalization and potential applications. Firstly, we produced CD nanofibers from three different chemically modified CD types (hydroxypropyl-β-cyclodextrin (HPβCD), hydroxypropyl-γ-cyclodextrin (HPγCD) and methyl-β-cyclodextrin (MβCD)). Afterwards, the electrospinning of native CD (α-CD, β-CD and γ-CD) nanofibers was achieved. The molecular entrapment capability of CD nanofibers was shown by capturing toxic volatile organic compounds (VOCs) from the surrounding. As the next step, the polymer-free nanofibers were obtained from the cyclodextrin inclusion complexes (CD-IC) with antibacterial agent, vanillin and essential oils. Here, we have also indicated applicability of CD-IC nanofibers as a result of antibacterial test. The functionalization of the CD nanofibers was continued with the green and one-step synthesis of metal nanoparticles (Ag-NP, Au-NP and Pd-NP)
v
incorporated nanofibers, in which CD were used as reducing, stabilizing agent and fiber template. Even, the antibacterial, SERS and catalyst potential of these CD based nanofibers were demonstrated for the related nanoparticles. Our research is expanded
to a new stage by the production of insoluble poly-CD nanofibers.We have worked
on different crosslinking agents to attain insoluble poly-CD nanofibers with uniform morphology. After the optimization of CD nanofibers, the most durable poly-CD nanowebs were selected for further analysis and evaluation of the filtration performance in liquid environment. Within poly-CD nanofibers, we have eliminated the solubility challenge of CD nanofibers that restrict their usage. So, we assume that, poly-CD nanofibers will lead-up to generation of new advances for practices of
CD nanofibers. All studies showed that, the self-assembly and self-aggregation
property of CD are the prior requirements for the electrospinnability of these small molecules. To conclude, very intriguing materials were obtained by integrating large surface area of nanofibers with specific host-guest inclusion complexation capability and non-toxic, biocompatible nature of the CD. Moreover, CD molecules, which are generally used in the powder form, were rendered into more applicable nanofibers form that will represent ease during their usage.
Keywords: electrospinning, cyclodextrin, nanofibers, inclusion complex,
antibacterial agent, vanillin, essential oils, nanoparticles, silver, gold, palladium, molecular encapsulation, antibacterial activity, SERS, catalyst, crosslinking.
vi
ÖZET
ELEKTROEĞİRME YÖNTEMİ İLE SİKLODEKSTRİN
FONKSİYONLU NANOLİFLER
Aslı Çelebioğlu
Malzeme Bilimi ve Nanoteknoloji, Doktora Tez Yöneticisi: Doç. Dr. Tamer Uyar
Ağustos, 2014
Elektroeğirme, nanometre düzeyinden birkaç mikrometreye kadar değişen aralıkta çapa sahip nanoliflerin üretilmesi için, yaygın olarak çalışılan ve uygulanan bir tekniktir. Düşük maliyeti, basit düzeneği, göreceli olarak yüksek üretim hızı ve tekrarlanabilirliği, bu yöntemin hem akademide hem de endüstride ilgi çekmesini sağlamaktadır. Elektroeğrilmiş nanolifler, oldukça yüksek yüzey alanları, çok düşük ağırlıkları, nano-boyuttaki gözeneklilikleri ve belirgin fiziksel/mekanik özellikleri ile çok geniş malzeme aralığında üretilebilmektedirler. Bu yöntemde nanolif üretimi, genel olarak polimerik tabanlı malzemelere odaklanmıştır. Fakat, yeni çalışmalar göstermiştir ki, polimerik olmayan sistemlerden de nanolif elde etmek mümkündür. Elektroeğirme araştırmalarındaki bu yeni gelişmeye bizim katkımız ise, polimerik malzeme kullanmayarak ürettiğimiz siklodekstrin (CD) nanolifleri ile olmuştur. CD'ler α-(1,4)-glikozidik bağlarıyla birbirine bağlanmış glukopiranoz yapılarından oluşan siklik oligosakkaridlerdir. Kesik koni şeklindeki yapıları, CD'lere, çok farklı organik moleküller ile kovalent olmayan ev sahibi-misafir tipi inklüzyon kompleks (IC) yapacağı ortamı sunmaktadır. IC oluşumu ile, misafir moleküllerin özelliklerinde ve konumunda meydana gelen iyileşme ve gelişmeler, CD'lerin, filtrasyon, tıbbi ilaçlar, kozmetik, fonksiyonel gıda, tekstil ve analitik kimya gibi birçok farklı alanda kullanımını sağlamaktadır.
Bu tezde, CD nanoliflerinin elektroeğrilmesini rapor etmekte ve
fonksiyonlaştırılmaları ile uygulama potansiyellerini sunmaktayız. Öncelikle, üç farklı modifiye CD (hidroksipropil-β-siklodekstrin (HPβCD), hidroksipropil-γ- siklodekstrin (HPγCD) and metil-β-siklodekstrin (MβCD)) çeşidinden nanolifler elde edilmiştir. Daha sonra, doğal CD (α-CD, β-CD and γ-CD) nanoliflerinin elektroeğrilmesi başarılmıştır. Bu nanoliflerin, moleküler tutuklama kapasiteleri, hava ortamındaki toksik uçucu organik bileşiklerin (VOCs) enkapsülasyonu ile gösterilmiştir. Bir sonraki aşama olarak, polimersiz nanolifler, CD'lerin antibakteriyel ajanlar (triklosan) ve esansiyel yağlar ile yaptığı IC'lerden elde edilmiştir. Burada, IC nanoliflerinin uygulanabilirliği de yapılan antibakteriyel test sonuçları ile gösterilmiştir. CD nanoliflerinin fonksiyonlaştırılmaları, yeşil ve tek adımda metal nanoparçacıkların (Ag-NP, Au-NP ve Pd-NP) sentezinin ve nanoliflerin katkılandırılmasını içeren; CD'lerin indirgeyici, stabilize edici ve lif
vii
kalıbı olarak kullanıldığı, çalışmalar ile devam etmiştir. Hatta, ilgili nanoparçacığı içeren CD nanolifler için, antibakteriyel, SERS ve kataliz olarak kullanım potansiyelleri gösterilmiştir. Çalışmalarımız, çözünmeyen poli-CD nanoliflerinin üretimi ile genişletilmiş ve yeni bir boyut kazanmıştır. Çözünmeyen ve homojen lif yapısına sahip olan nanoliflerin üretimi için birçok farklı çapraz bağlayıcı ajanlar denemiştir, bütün ajanlar için şartlar optimize edildikten sonra, en dayanıklı olan nanoağ yapısı, ilerleyen analizler ve sulu ortamdaki filtrasyon performansını değerlendirmek için seçilmiştir. Poli-CD nanoliflerinin üretimi ile, CD nanoliflerinin kullanımını kısıtlayan suda çözünme problemi ortadan kaldırılmıştır. Bu nedenle, poli-CD nanoliflerinin, CD nanoliflerinin kullanımında yeni gelişmeler sağlayacağını ummaktayız. Bütün bu çalışmalar göstermiştir ki, CD'lerin kendiliğinden topaklanma ve kümelenme özellikleri, bu moleküllerin elektroeğrilmesi için öncelikli gerekliliklerdendir. Sonuç olarak, nanoliflerin yüksek yüzey alanı; toksik olmayan ve biyouyumlu CD'lerin ev sahibi-misafir tipi kompleks yapabilme özellikleri ile entegre edilerek çok ilginç yapıda malzemeler elde edilmiştir. Ayrıca, genellikle toz halinde kullanılan CD'ler, uygulamaları sırasında kolaylık sağlayacak olan nanolif formuna getirilmiştir.
Anahtar kelimeler: elektroeğirme, siklodekstrin, nanolifler, inklüzyon kompleks, antibakteriyel ajan, vanilya, esansiyel yağlar, nanoparçacık, gümüş, altın, paladyum, moleküler enkapsülasyon, antibakteriyel aktivite, SERS, kataliz, çapraz bağlama.
viii
ix
ACKNOWLEDGEMENTS
Firstly, I would like to express my sincere gratitude to my supervisor Assoc. Prof. Dr. Tamer Uyar for his valuable guidance, continuous support, motivation and patience during the course of this research. I am also grateful to him for encouraging me to work in this interesting project which I learned many. The members of my thesis committee, Prof. Dr. Jale Hacaloğlu, Assist. Prof. Dr. Bülend Ortaç, Assist. Prof. Dr. Ferdi Karadaş and Assist. Prof. Dr. Engin Durgun, are gratefully acknowledged for their insightful comments.
I consider myself very lucky to be a member of Uyar Research Group so I owe a special thanks to Fatma Kayacı, Yelda Ertaş, Zeynep Aytaç, Ömer Faruk Sarıoğlu, Dr. Sesha Vempati, Dr. Anitha Senthamizhan, Dr. Oya San Keskin, as well as to our former member Şefika Eroğlu Özcan, Ali Ekrem Deniz and visiting scientist Assist. Prof. Dr. Serkan Demirci for their help, support and valuable friendship.
I would like to thank our collaborators, Assoc. Prof. Dr. Turgay Tekinay, and his student Ozgun C. O. Umu for their efforts in antibacterial test studies. Gratitude extends to Assoc. Prof. Dr. Aykutlu Dȃna for his collaboration with SERS measurements.
This dissertation studies were performed owing to the UNAM facilities. I would like to thank to everyone contributed to the making and working of UNAM and I am especially thankful to Zeynep Erdoğan and Mustafa Güler for their contributions.
Finally, I would like to express my special gratitude to my family, Nüferiye Çelebioğlu, Atakan Çelebioğlu and Nazlı Çelebioğlu for their love, support, understanding and patience.
Financial support from TÜBİTAK BİDEB 2228 Ph.D. Fellowship Program
and TÜBİTAK project # 213M185, # 111M459 and # 113Y348 are gratefully acknowledged.
x
TABLE OF CONTENT
TABLE OF CONTENT ... X LIST OF ABBREVIATIONS ... XIV LIST OF FIGURES ... XVI LIST OF TABLES ... XXIX
INTRODUCTION ... 1
1.1. Electrospinning ... 1
1.2. Cyclodextrins ... 6
1.3. Electrospinning of non-polymeric systems ... 10
EXPERIMENTAL DETAILS ... 14
2.1. Materials ... 14
2.2. Preparation of Solutions and Electrospinning of Nanofibers ... 15
2.2.1. Preparation of modified CD solutions ... 15
2.2.2. Preparation of native CD solutions ... 15
2.2.3. Preparation of triclosan/CD-IC suspension ... 16
2.2.4. Preparation of vanillin/CD-IC solutions ... 16
2.2.5. Preparation of essential oils/CD-IC solutions ... 16
2.2.6. Preparation of PVA, PVA/HPβCD and PVA/HPβCD/Ag-NP systems ... 17
2.2.7. Preparation of HPβCD/metal nanoparticles solutions ... 17
2.2.8. Preparation of crosslinked poly-CD solutions ... 18
2.2.9. Electrospinning ... 19
2.3. Characterizations and Measurements ... 20
2.3.1. Instrumentation ... 20
2.3.2. Molecular entrapment of volatile organic compounds (VOCs) by modified CD nanofibrous web ... 23
2.3.3. Molecular entrapment of VOCs by γ-CD nanofibrous web ... 24
2.3.4. Antibacterial tests of triclosan/CD-IC nanofibers ... 25
2.3.5. Water solubility of vanillin/CD-IC nanofibers ... 26
2.3.6. Antibacterial tests of PVA/Ag-NP and PVA/HPβCD/Ag-NP nanofibers 26 2.3.7. Catalytic activity of HPβCD/Pd-NP nanofibers ... 27
xi
2.3.8. Molecular entrapment of organic molecules from liquid environment by
poly-CD nanofibers ... 27
RESULTS AND DISCUSSION ... 29
CHAPTER-1: ELECTROSPINNING OF CYCLODEXTRIN NANOFIBERS 29 3. Electrospinning of Polymer-free Nanofibers from Cyclodextrin Derivatives ... 30
3.1. Electrospinning of HPβCD nanofibers ... 31
3.2. Electrospinning of HPγCD fibers ... 36
3.3. Electrospinning of MβCD nanofibers ... 40
3.4. The effect of urea on the electrospinning of CD nanofibers ... 44
3.5. Characterization of the electrospun CD nanowebs ... 46
4. Molecular Entrapment of Volatile Organic Compounds (VOCs) by Electrospun Modified Cyclodextrin Nanofibers ... 51
4.1. Structural characterization of CD nanofibers ... 53
4.2. VOCs entrapment capability of CD nanofibers and CD powder ... 55
5. Electrospinning of Polymer-free Nanofibers from Native Cyclodextrins (α-CD, β-CD and γ-β-CD) ... 64
5.1. Electrospinning of nanofibers from native CD (α-CD, β-CD and γ-CD) ... 65
5.2. CD aggregation and rheology of CD solutions ... 70
5.3. Structural characterization of the electrospun native CD nanofibers ... 76
5.4. Entrapment of organic vapors by γ-CD nanofibrous web ... 78
CHAPTER-2: ELECTROSPINNING OF CYCLODEXTRIN/INCLUSION COMPLEX NANOFIBERS ... 82
6. Electrospinning of Polymer-free Nanofibers from Antibacterial (Triclosan)/Cyclodextrin Inclusion Complexes ... 83
6.1. Electrospinning and structural characterization of HPβCD nanofibers and triclosan/HPβCD-IC nanofibers ... 85
6.2. Electrospinning and structural characterization of triclosan/HPβCD-IC and triclosan/HPγCD-IC nanofibers ... 92
6.3. Antibacterial activity of triclosan/HPβCD-IC nanofibers and triclosan/HPγCD-IC nanofibers ... 99
7. Electrospinning of Polymer-free Nanofibers from Vanillin/Cyclodextrin Inclusion Complexes ... 102
xii
7.1. Electrospinning of vanillin/CD-IC nanofibers ... 103 7.2. Structural characterizations and solubility investigation of vanillin/CD-IC nanofibers ... 105 8. Electrospinning of Polymer-free Nanofibers from Essential Oils/Cyclodextrin Inclusion Complexes ... 111
8.1. Electrospinning of EOs/CD-IC nanofibers ... 112 8.2. Structural and thermal characterizations of EOs/CD-IC nanofibers ... 114 CHAPTER-3: CYCLODEXTRIN NANOFIBERS INCORPORATING METAL NANOPARTICLES ... 121 9. One-step Synthesis of Size-Tunable Silver Nanoparticles (Ag-NP) Incorporated in Electrospun PVA/Cyclodextrin Nanofibers ... 122
9.1. Electrospinning and morphological characterizations of PVA/Ag-NP and PVA/HPβCD/Ag-NP composite nanofibers ... 124 9.2. Structural characterizations of PVA/Ag-NP and PVA/HPβCD/Ag-NP
composite nanofibers ... 128 9.3. Surface enhanced Raman scattering (SERS) properties of PVA/Ag-NP and PVA/HPβCD/Ag-NP composite nanofibers ... 131 9.4. Antibacterial properties of PVA/Ag-NP and PVA/HPβCD/Ag-NP composite nanofibers ... 132 10. Green and One-step Synthesis of Metal Nanoparticles Incorporated in
Electrospun Cyclodextrin Nanofibers ... 136 10.1. Electrospinning and characterization of the Ag-NP including HPβCD
nanofibers ... 137 10.2. Electrospinning and characterization of the Au-NP including HPβCD
nanofibers ... 145 10.3. Electrospinning and characterization of the Pd-NP including HPβCD
nanofibers ... 154 CHAPTER-4: ELECTROSPINNING OF INSOLUBLE
POLY-CYCLODEXTRIN NANOFIBERS ... 161 11. Electrospinning of Insoluble Poly-cyclodextrin Nanofibers for the Removal of Waste Molecules from Aqueous Environment ... 162
xiii
11.2. Structural characterization of poly-CD nanofibers ... 170
11.3. Filtration performance of poly-CD nanofibers ... 171
CONCLUSIONS AND FUTURE PROSPECTS ... 177
LIST OF PUBLICATIONS ... 182
xiv
LIST OF ABBREVIATIONS
AFD : Average fiber diameter
AFM : Atomic force microscope
APS : The average particle sizes
BET : Brunauer–Emmett–Teller surface area analyzer
BTCA : 1,2,3,4-Butaneteracarboxylic acid
CA : Citric acid
CD : Cyclodextrin
α-CD : α-cyclodextrin
β-CD : β-cyclodextrin
γ-CD : γ -cyclodextrin
DSC : Differential scanning calorimeter
DMAc : Dimethylacetamide
DMF : N,N Dimethylformamide
DLS : Dynamic light scattering
ECH : Epichlorohydrin
E. coli : Escherichia coli
EOs : Essential oils
FTIR : Fourier transform infrared spectrometer
HMDI : Hexamethylene diisocyanate
HPLC : High performance liquid chromatography
HR-TEM : High resolution transmission electron microscope HPβCD : Hydroxypropyl-β-cyclodextrin
HPγCD : Hydroxypropyl-γ-cyclodextrin
IC : Inclusion complex
ITC : Isothermal titration calorimeter
MβCD : Methyl-β-cyclodextrin
NF : Nanofibers
NP : Nanoparticle
xv
PEGDE : Poly(ethylene glycol) diglycidyl ether
PVA : Polyvinyl alcohol
1
H NMR : Proton magnetic resonance
SEM : Scanning electron microscope
SAED : Selected area electron diffraction
S. aureus : Staphylococcus aureus
SERS : Surface enhanced Raman scattering
SPR : Surface plasmonic resonance
TEM : Transmission electron microscope
TGA : Thermogravimetric analyzer
XRD : X-ray diffraction
xvi
LIST OF FIGURES
Figure 1. Schematic view of the electrospinning set-up. ... 2
Figure 2. Electrospinning set-up at UNAM. ... 2
Figure 3. The representative SEM images of PC nanofibers obtained at (a) 16% (w/v), (b) 20% (w/v) and (c) 25% (w/v) polymers concentrations. ... 3
Figure 4. The SEM image of electropsun porous CA ultrathin fibers. ... 4
Figure 5. Application areas of electrospun nanofibers. ... 5
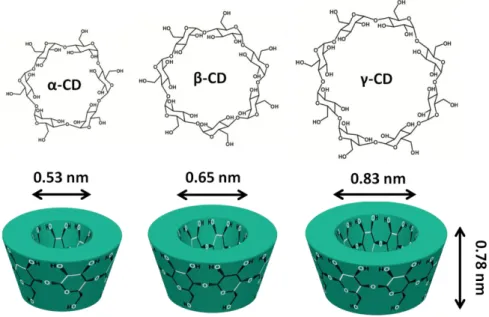
Figure 6. Chemical structure and schematic view of α-CD, β-CD and γ-CD. ... 6
Figure 7. (a) Chemical structure and the schematic view of the modified HPβCD or MβCD. (b) Chemical structure of glucopyranose unit and schematic representation of the primary, secondary side of CD molecules. ... 8
Figure 8. Schematic view of IC formation between CD and guest molecule. ... 9
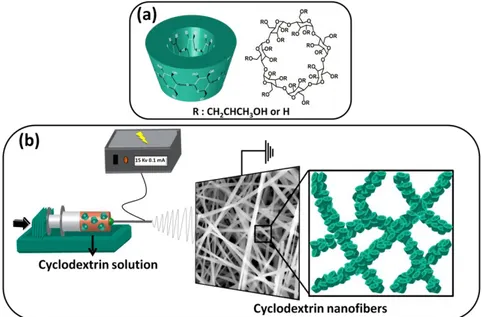
Figure 9. (a) Schematic view and chemical structure of modified CD. (b) Schematic representation of the electrospinning of the modified CD nanofibers. ... 31
Figure 10. The representative SEM images of the electrospun HPβCD nanofibers obtained from water, DMF and DMAc solutions having different HPβCD concentrations. (a) 100% (w/v), (b) 120% (w/v), (c) 140% (w/v) and (d) 160% (w/v) HPβCD in water; (e) 100% (w/v) and (f) 120% (w/v) HPβCD in DMF; and (g) 100% (w/v) and (h) 120% (w/v) HPβCD in DMAc. (Copyright © 2012, Royal Society of Chemistry. Reprinted with permission from Ref.[130]) ... 32
Figure 11. Size distribution of HPβCD aggregates for (a) 100%, 120%, 140%, 160% (w/v) HPβCD and 160% (w/v) HPβCD containing 20% (w/w) urea in water; (b) 100%, 120% (w/v) HPβCD and 120% (w/v) HPβCD containing 20% (w/w) urea in DMF; and (c) 100% and 120% (w/v) HPβCD in DMAc. (Copyright © 2012, Royal Society of Chemistry. Reproduced with permission from Ref.[130]) ... 34
xvii
Figure 12. The representative SEM images of the electrospun HPγCD nanofibers obtained from water, DMF and DMAc solutions having different HPγCD concentrations. (a) 100% (w/v), (b) 120% (w/v), (c) 140% (w/v) and (d) 160% (w/v) HPγCD in water; (e) 100% (w/v), (f) 120% (w/v) and (g) 125% (w/v) HPγCD in DMF; (h) 100% (w/v), (i) 120% (w/v) and (j) 125% (w/v) HPγCD in DMAc. (Copyright © 2012, Royal Society of Chemistry. Reprinted with permission from Ref.[130]) ... 37
Figure 13. Size distributions of MβCD aggregates for (a) 100%, 120%, 140%, 160% (w/v) MβCD and 160% (w/v) MβCD containing 20% (w/w) urea in water; and (b) 100%, 120%, 140%, 160% (w/v) MβCD and 160% (w/v) MβCD containing 20% (w/w) urea in DMF. (Copyright © 2012, Royal Society of Chemistry. Reprinted with permission from Ref.[130]) ... 40
Figure 14. The representative SEM images of the electrospun MβCD nanofibers obtained from water, DMF and DMAc solutions having different MβCD concentrations. (a) 100% (w/v), (b) 120% (w/v), (c) 140% (w/v) and (d) 160% (w/v)MβCD in water; (e) 100% (w/v), (f) 120% (w/v), (g) 140% (w/v), and (h) 160% (w/v) MβCD in DMF; and (i) 100% (w/v), (j) 120% (w/v), (k) 140% (w/v) and (l) 160% (w/v) MβCD in DMAc. (Copyright © 2012, Royal Society of Chemistry. Reprinted with permission from Ref.[130]) ... 43
Figure 15. (a) AFM image and (b) fiber axis cross-section profile of the nanofiber obtained from 160% (w/v) MβCD in water. (c) AFM image and (d) fiber axis cross-section profile of the nanofiber obtained from 160% (w/v) MβCD in DMF. (Copyright © 2010, Royal Society of Chemistry. Reprinted with permission from Ref.[129]) ... 44
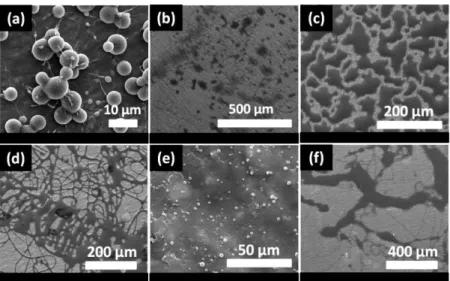
Figure 16. The representative SEM images of the splashed area that were obtained as a result of adding 20% (w/w) urea to CD solutions. (a) 160% (w/v) HPβCD containing 20% (w/w) urea in water, (b) 120% (w/v) HPβCD containing 20% (w/w) urea in DMF, (c) 160% (w/v) HPγCD containing 20% (w/w) urea in water, (d) 125% (w/v) HPγCD containing 20% (w/w) urea in DMF, (e) 160% (w/v) MβCD containing 20% (w/w) urea in water, and (f) 160% (w/v) MβCD containing 20% (w/w) urea in
xviii
DMF. (Copyright © 2012, Royal Society of Chemistry. Reprinted with permission from Ref.[130]) ... 45
Figure 17. Schematic views of the aggregation situations of CD molecules in lowest and highest concentrated CD solution, as well in the urea added one. ... 46
Figure 18. XRD patterns of (a) the HPβCD nanoweb produced from (i) water, (ii) DMF, (iii) DMAc solution and (iv) as-received HPβCD powder; (b) the HPγCD web produced from (i) water, (ii) DMF, (iii) DMAc solution and (iv) as-received HPγCD powder; and (c) the MβCD nanoweb produced from (i) water, (ii) DMF, (iii) DMAc solution and (iv) as-received MβCD powder. (Copyright © 2012, Royal Society of Chemistry. Reprinted with permission from Ref.[130]) ... 47
Figure 19. TGA thermograms of (a) the HPβCD nanoweb produced from water (black line), DMF (red line), DMAc (blue line) and the as-received powder form of HPβCD (green line); (b) the HPγCD web produced from water (black line), DMF (red line), DMAc (blue line) and the as-received powder form of HPγCD (green line); and (c) MβCD nanoweb produced from water (black line), DMF (red line), DMAc (blue line) and the as-received powder form of MβCD (green line). (Copyright © 2012, Royal Society of Chemistry. Reprinted with permission from Ref.[130]) ... 48
Figure 20. Nanowebs obtained from (a-I and II) 160% (w/v) HPβCD in water; (b-I and II) 120% (w/v) HPβCD in DMF; (c-I and II) 120% (w/v) HPβCD in DMAc; (d-I and II) 160% (w/v) HPγCD in water; (e) 125% (w/v) HPγCD in DMF; (f) 125% (w/v) HPγCD in DMAc; (g-I and II) 160% (w/v)MβCD in water; (h-I and II) 160% (w/v) MβCD in DMF; and (i-I and II) 160% (w/v) MβCD in DMAc. (Copyright © 2012, Royal Society of Chemistry. Reprinted with permission from Ref.[130]) ... 49
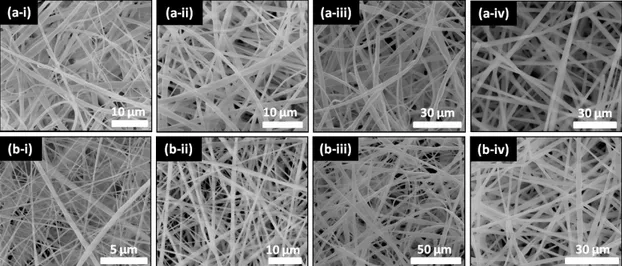
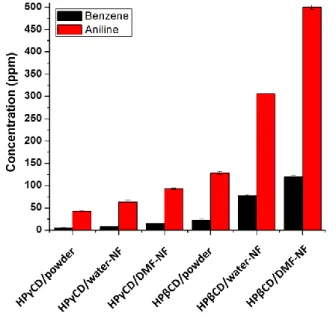
Figure 21. The representative SEM images of (a-i) HPβCD/powder, (a-ii) HPβCD/water-NF, (a-iii) HPβCD/DMF-NF, (b-i) HPγCD/powder, (b-ii) HPγCD/water-NF and (b-iii) HPγCD/DMF-NF. ... 54 Figure 22. The photograph of HPβCD nanofibrous web and the schematic view of the molecular entrapment test. ... 56
xix
Figure 23. The representative SEM images of (a) aniline and (b) benzene exposed (i) HPβCD/water-NF, (ii) HPβCD/DMF-NF, (iii) HPγCD/water-NF, (iv) HPγCD/DMF-NF after entrapment test. ... 56
Figure 24. Representative 1H NMR spectra of (a) aniline and (b) benzene exposed
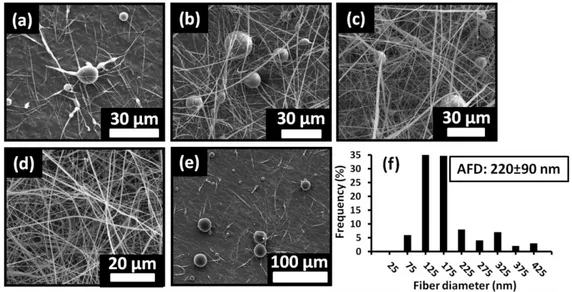
HPβCD/DMF-NF which were taken in d6-DMSO. ... 58 Figure 25. The summary of HPLC results showing the amount of aniline and benzene entrapped by HPβCD/powder, HPβCD/water-NF, HPβCD/DMF-NF, HPγCD/powder, HPγCD/water-NF and HPγCD/DMF-NF. ... 59 Figure 26. The TGA thermograms of (a-i) (i) pure aniline, (ii) HPβCD/powder, (iii) aniline exposed HPβCD/powder; (a-ii) (i) pure aniline, (ii) HPβCD/water-NF, (iii) aniline exposed HPβCD/water-NF; (a-iii) (i) pure aniline, (ii) HPβCD/DMF-NF, (iii) aniline exposed HPβCD/DMF-NF; (b-i) (i) pure aniline, (ii) HPγCD/powder, (iii) aniline exposed HPγCD/powder; (b-ii) (i) pure aniline, (ii) HPγCD/water-NF, (iii) aniline exposed HPγCD/water-NF; (b-iii) (i) pure aniline, (ii) HPγCD/DMF-NF, (iii) aniline exposed HPγCD/DMF-NF; (c-i) (i) HPβCD/powder, (ii) benzene exposed HPβCD/powder; (c-ii) (i) NF, (ii) benzene exposed HPβCD/water-NF; (c-iii) (i) HPβCD/DMF-NF, (ii) benzene exposed HPβCD/DMF-HPβCD/water-NF; (d-i) (i) HPγCD/powder, (ii) benzene exposed HPγCD/powder; (d-ii) (i) HPγCD/water-NF, (ii) benzene exposed HPγCD/water-NF; (d-iii) (i) HPγCD/DMF-NF, (ii) benzene exposed HPγCD/DMF-NF. ... 62 Figure 27. The representative SEM images of α-CD nanofibers obtained from 10% (w/v) NaOH aqueous solution at (a) 120% (w/v), (b) 130% (w/v), (c) 140% (w/v), (d) 150% (w/v), (e) 160% (w/v) α-CD concentrations and (f) the SEM image of bead structures with few fiber formation as a results of adding 20% (w/w) urea to the 160% (w/v) α-CD solution. (g) Fiber diameter distribution of electrospun nanofibers produced from 160% (w/v) α-CD concentration. (Copyright © 2013, Elsevier. Reprinted with permission from Ref.[131]) ... 68
Figure 28. The representative SEM images of β-CD nanofibers obtained from 10% (w/v) NaOH aqueous solution at (a) 120% (w/v), (b) 130% (w/v), (c) 140% (w/v), (d) 150% (w/v) β-CD concentrations and (e) the SEM image of bead structures as a
xx
results of adding 20% (w/w) urea to the 150% (w/v) β-CD solution. (f) Fiber diameter distribution of electrospun nanofibers produced from 150% (w/v) β-CD concentration. (Copyright © 2013, Elsevier. Reprinted with permission from Ref.[131]) ... 69
Figure 29. The representative SEM images of γ-CD nanofibers obtained from DMSO/water (50/50 ratio, v/v) solvent mixture at (a) 120% (w/v), (b) 130% (w/v), (c) 140% (w/v) γ-CD concentrations and (d) the representative SEM image of splashed area as a results of adding 20% (w/w) urea to the 140% (w/v) γ-CD solution. (e) Fiber diameter distribution of electrospun nanofibers produced from 140% (w/v) γ-CD concentration. (Copyright © 2013, Elsevier. Reprinted with permission from Ref.[131]) ... 70
Figure 30. Size distribution of (a) α-CD aggregates for 120%, 130%, 140%, 150%, 160% (w/v) α-CD and 20% (w/w) urea-added 160% (w/v) α-CD in 10% (w/v) NaOH aqueous solution; (b) 120%, 130%, 140%, 150% (w/v) β-CD and 20% (w/w) urea-added 150% (w/v) β-CD in 10% (w/v) NaOH aqueous solution. (Copyright © 2013, Elsevier. Reprinted with permission from Ref.[131]) ... 71
Figure 31. Viscosity versus shear rate graphs of (a) 120% (), 130% (), 140% (), 150% (), 160% () and 20% (w/w) urea-added 160% (w/v) () α-CD solutions; (b) 120% (), 130% (), 140% (), 150% () and 20% (w/w) urea-added 150% (w/v) () β-CD solutions; (c) 120% (), 130% (), 140% (), and 20% (w/w) urea-added 140% (w/v) () γ-CD solutions. (Copyright © 2013, Elsevier. Reproduced with permission from Ref.[131] and Copyright © 2013, Royal Society of Chemistry. Reproduced with permission from Ref.[132]) ... 73
Figure 32. Frequency depended storage modulus G’ (filled symbols) and loss modulus G’’ (open symbols) graphs of , (a)120% , 130%, 140%, 150%, 160% and 20% (w/w) urea-added 160% (w/v) α-CD solutions; (b) 120% , 130%, 140%, 150% and 20% (w/w) urea-added 150% (w/v) β-CD solutions; (c) 120% , 130%, 140%, and 20% (w/w) urea-added 140% (w/v) γ-CD solutions. (Copyright © 2013, Elsevier. Reproduced with permission from Ref.[131] and Copyright © 2013, Royal Society of Chemistry. Reproduced with permission from Ref.[132]) ... 75
xxi
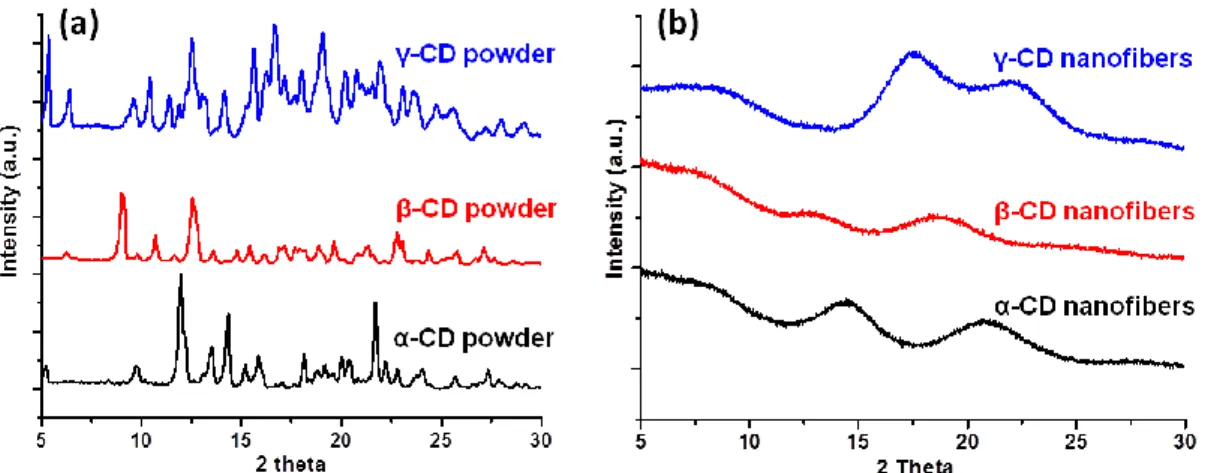
Figure 33. XRD patterns of as-received (a) α-CD, β-CD, γ-CD powder and (b) α-CD, β-CD, γ-CD nanofibers. (Copyright © 2013, Elsevier. Reproduced with permission from Ref.[131] and Copyright © 2013, Royal Society of Chemistry. Reproduced with permission from Ref.[132]) ... 77
Figure 34. TEM and HR-TEM images of electrospun (a-i,ii) α-CD, (b-i,ii) β-CD and (c-i,ii) γ-CD nanofiber. (Copyright © 2013, Elsevier. Reproduced with permission from Ref.[131] and Copyright © 2013, Royal Society of Chemistry. Reproduced with permission from Ref.[132]) ... 77
Figure 35. 1H NMR spectra of (a-i) aniline exposed γ-CD powder and (ii) aniline
exposed γ-CD nanofibers in D2O; (b-i) toluene exposed γ-CD powder and (ii)
toluene exposed γ-CD nanofibers in d6-DMSO. (Copyright © 2013, Royal Society of Chemistry. Reprinted with permission from Ref.[132]) ... 80
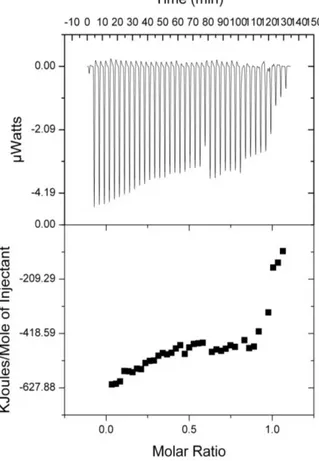
Figure 36. Isothermal calorimetric titration of triclosan with HPβCD in water at 25
oC: (upper) raw data for 40 injections of HPβCD solution into triclosan solution;
(lower) titration curve obtained from the integration of the calorimetric traces. (Copyright © 2011, American Chemical Society. Reprinted with permission from Ref.[133]) ... 86
Figure 37. (a) Visual observation of a triclosan/HPβCD-IC (1:1 molar ratio) solution after mixing of the two components for (i) 1, (ii) 3, (iii) 6, (iv) 9, (v) 12, and (vi) 15 h. (b) UV-vis spectrum of the same triclosan/HPβCD (1:1 molar ratio) solution after (i) 1, (ii) 3, (iii) 6, (iv) 9, (v) 12, and (vi) 15 h. (Copyright © 2011, American Chemical Society. Reprinted with permission from Ref.[133]) ... 88
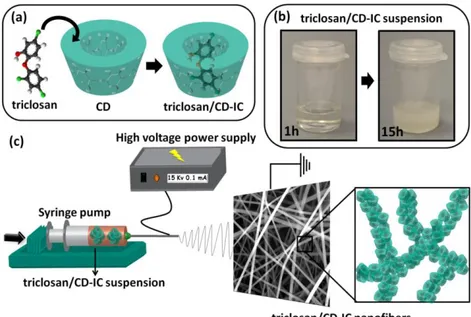
Figure 38. Schematic representation of (a) IC formation between CD and triclosan. (b) The photograph of triclosan/HPβCD-IC suspension for 1h and 15h periods. (c) Illustration of electrospinning of triclosan/HPβCD-IC nanofibers. (Copyright © 2014, Elsevier. Reprinted with permission from Ref.[134])... 88
Figure 39. FTIR spectra of HPβCD nanofibers, pure triclosan, triclosan/HPβCD physical mixture, and triclosan/HPβCD-IC nanofibers. ... 90
xxii
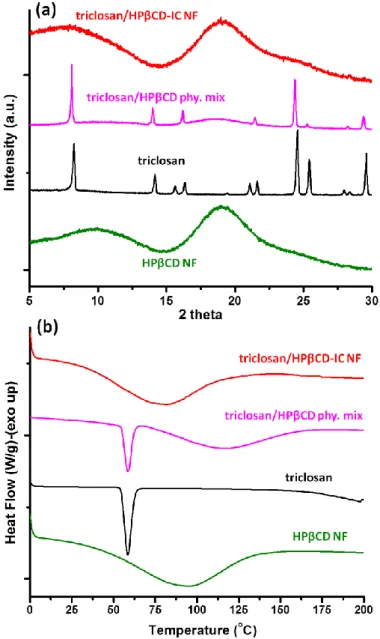
Figure 40. (a) XRD patterns and (b) DSC thermograms of HPβCD nanofibers, pure triclosan, triclosan/HPβCD physical mixture and triclosan/HPβCD-IC nanofibers. . 91 Figure 41. Representative SEM image of electrospun nanofibers obtained from (a) HPβCD, (b) HPγCD solutions, (c) triclosan/HPβCD-IC, and (d) triclosan/HPγCD-IC suspensions. The photographs of nanofibrous webs which can be easily handled and folded; (e) HPβCD nanofibers, (f) HPγCD nanofibers, (g) triclosan/HPβCD-IC nanofibers, and (h) triclosan/HPγCD-IC nanofibers. (Copyright © 2014, Elsevier. Reprinted with permission from Ref.[134]) ... 93
Figure 42. FTIR spectra of pure triclosan, triclosan/HPβCD-IC nanofibers and triclosan/HPγCD-IC nanofibers. (Copyright © 2014, Elsevier. Reprinted with permission from Ref.[134]) ... 95
Figure 43. 1H NMR spectra of (a) triclosan/HPβCD-IC nanofibers and (b)
triclosan/HPγCD-IC nanofibers dissolved in d6-DMSO (red and blue stars are assigned for the calculated peak of triclosan and CD, respectively.) (Copyright © 2014, Elsevier. Reprinted with permission from Ref.[134])... 96
Figure 44. TGA thermograms of pure triclosan, triclosan/HPβCD-IC nanofibers and triclosan/HPγCD-IC nanofibers. (Copyright © 2014, Elsevier. Reprinted with permission from Ref.[134]) ... 98
Figure 45. (a) XRD patterns and (b) DSC thermograms of pure triclosan, triclosan/HPβCD-IC nanofibers and triclosan/HPγCD-IC nanofibers. (Copyright © 2014, Elsevier. Reprinted with permission from Ref.[134])... 99
Figure 46. The representative photographs of antibacterial test plates with the average inhibition zone (IZ) and standard deviation calculations for E. coli and S.
aureus treated with pure triclosan, triclosan/HPβCD-IC nanofibers and
triclosan/HPγCD-IC nanofibers. (Copyright © 2014, Elsevier. Reprinted with permission from Ref.[134]) ... 100
Figure 47. Representative SEM images of electrospun (a) vanillin/HPβCD-IC, (b) vanillin/HPγCD-IC and (c) vanillin/MβCD-IC nanofibers obtained in (i) water, (ii) DMF and (iii) DMAc. ... 105
xxiii
Figure 48. FTIR spectra of pure vanillin and vanillin/CD-IC nanofibers obtained in water. ... 106
Figure 49. (a) XRD patterns and (b) DSC thermograms of pure vanillin and vanillin/CD-IC nanofibers obtained in water. ... 107
Figure 50. TGA thermograms of pure vanillin and vanillin/CD-IC nanofibers obtained in water. ... 109
Figure 51. Representative SEM image of electrospun nanofibers obtained from IC of (a) thymol, (b) eugenol and (c) citral with (i) HPβCD, (ii) HPγCD and (iii) MβCD. ... 113
Figure 52. Representative SEM image of electrospun nanofibers obtained from IC of (a) camphor, (b) cineole and (c) cymene with (i) HPβCD and (ii) HPγCD. ... 114
Figure 53. FTIR spectra of pure EOs and the EOs/CD-IC nanofibers of (a) thymol, (b) eugenol, (c) citral, (d) camphor, (e) cineole and (f) cymene with HPβCD, HPγCD and MβCD. ... 116 Figure 54. TGA thermograms of pure EOs and EOs/CD-IC nanofibers of (a) thymol, (b) eugenol, (c) citral, (d) camphor, (e) cineole and (f) cymene with HPβCD, HPγCD and MβCD. ... 117 Figure 55. XRD patterns of pure thymol, camphor and their IC nanofibers. ... 119
Figure 56. Schematic representation and the photographs of PVA/AgNO3,
PVA/Ag-NP, PVA/HPβCD-25%/AgNO3 and PVA/HPβCD-25%/Ag-NP solutions. Schematic
representation of the electrospinning and the photograph of PVA/HPβCD-25%/Ag-NP nanofibrous mat with the representative SEM and TEM images. (Copyright © 2014, Elsevier. Reprinted with permission from Ref.[253])... 125
Figure 57. The representative SEM images of electrospun (a) PVA, (b) PVA/HPβCD-25%, (c) PVA/Ag-NP, (d) PVA/HPβCD-7.5%/Ag-NP, (e) PVA/HPβCD-15%/Ag-NP and (f) PVA/HPβCD-25%/Ag-NP nanofibers. (Copyright © 2014, Elsevier. Reprinted with permission from Ref.[253]) ... 126
xxiv
Figure 58. The representative TEM images of electrospun (a) PVA/Ag-NP, (b) 7.5%/Ag-NP, (c) 15%/Ag-NP and (d) PVA/HPβCD-25%/Ag-NP nanofibers. The HR-TEM image of a single Ag-NP indicating the d-spacing between Ag (111) planes as inset figure. (Copyright © 2014, Elsevier. Reprinted with permission from Ref.[253]). ... 128
Figure 59. (a) XRD spectra of PVA, PVA/HPβCD-25%, PVA/Ag-NP, PVA/HPβCD-7.5%/Ag-NP, PVA/HPβCD-15%/Ag-NP and PVA/HPβCD-25%/Ag-NP nanofibrous mats. (Copyright © 2014, Elsevier. Reprinted with permission from Ref.[253]) ... 129
Figure 60. UV-vis spectra taken from the dissolved PVA/Ag-NP, PVA/HPβCD-7.5%/Ag-NP, PVA/HPβCD-15%/Ag-NP and PVA/HPβCD-25%/Ag-NP nanofibers in water. (Copyright © 2014, Elsevier. Reprinted with permission from Ref.[253]) ... 130
Figure 61. The high resolution XPS of electrospun PVA/Ag-NP, PVA/HPβCD-7.5%/Ag-NP, PVA/HPβCD-15%/Ag-NP and PVA/HPβCD-25%/Ag-NP nanofibers. (Copyright © 2014, Elsevier. Reprinted with permission from Ref.[253]) ... 131
Figure 62. (a) Raman spectra of PVA and PVA/HPβCD-25% nanofibers when illuminated with 532 nm, 10 mW power, 20x objective. (b) Time dependent Raman spectra of pristine PVA nanofibers. (c) Time dependent Raman spectra of PVA/HPβCD-25% nanofibers. When Ag-NP are present in (d) PVA/Ag-NP and (e) PVA/HPβCD-7.5%/Ag-NP nanofibers, time dependent Raman spectra show fluctuations even at low powers (532 nm, 0.5 mW, 20x objective), typical indication of high surface enhancement Raman scattering (SERS). Due to high absorption coefficient and high thermal insulation of free standing fibers, absorption causes thermal damage to sample at high powers (e.g. 10 mW). (Copyright © 2014, Elsevier. Reprinted with permission from Ref.[253]) ... 132
Figure 63. The photographs of antibacterial testing of nanofibrous mats which were performed against (a) E. coli and (b) S. aureus. (Copyright © 2014, Elsevier. Reprinted with permission from Ref.[253]) ... 134
xxv
Figure 64. The photographs and the schematic view of (a) the electrospinning solution and (b) the nanofibrous mat which include Ag-NP and having the characteristic color of NP. ... 138
Figure 65. The representative SEM images of electrospun composite nanofibers that were produced in DMF and water at the 1 wt% and 2 wt% Ag-NP concentrations.139
Figure 66. The histograms of fiber diameter distributions and average AFD of HPβCD/Ag-NP-NF. ... 139 Figure 67. The representative TEM images of electrospun composite nanofibers that were produced in DMF and water at the 1% and 2% Ag-NP concentrations. ... 140
Figure 68. The representative STEM images of electrospun composite nanofibers that were produced in DMF and water at the 1 wt% and 2 wt% Ag-NP concentrations. ... 141
Figure 69. The histograms of APS and their distributions of Ag-NP present in HPβCD/Ag-NP-NF. ... 141 Figure 70. The representative TEM and HR-TEM images of Ag-NP obtained at DMF (2 wt% NP loading) and water (1 wt% NP loading) based system of HPβCD solutions. ... 142
Figure 71. The XRD spectra of electrospun HPβCD/Ag-NP-NF produced from two solvent systems (DMF and water) at two different NP loading (1 wt % and 2 wt %). ... 143
Figure 72. The solid UV-vis spectra of electrospun HPβCD/Ag-NP-NF produced from two solvent systems (DMF and water) at two different NP loading (1 wt % and 2 wt %). ... 144
Figure 73. The FTIR spectra of HPβCD-NF and HPβCD/Ag-NP-NF obtained in
water and DMF. The zoom out region between 3800-3000 cm-1 at the –OH stretching
xxvi
Figure 74. The high resolution XPS of electrospun HPβCD/Ag-NP-NF produced from two solvent systems (DMF and water) at two different NP loading (1 wt% and 2 wt%). ... 145
Figure 75. The photographs and the schematic view of (a) the electrospinning solution and (b) the nanofibrous mat which include Au-NP and having the characteristic color of NP. (Copyright © 2013, Royal Society of Chemistry. Reproduced with permission from Ref.[136]) ... 146
Figure 76. The representative SEM images of electrospun composite nanofibers that were produced in DMF and water at the 1 wt% and 2 wt% Au-NP concentrations. (Copyright © 2013, Royal Society of Chemistry. Reprinted with permission from Ref.[136]) ... 147
Figure 77. The histograms of average fiber diameter distributions and AFD values of HPβCD/Au-NP-NF. (Copyright © 2013, Royal Society of Chemistry. Reprinted with permission from Ref.[136]) ... 147
Figure 78. The representative TEM images of electrospun composite nanofibers that were produced in DMF and water at the 1% and 2% Au-NP concentrations. (Copyright © 2013, Royal Society of Chemistry. Reprinted with permission from Ref.[136]) ... 148
Figure 79. The representative STEM images of electrospun composite nanofibers that were produced in DMF and water at the 1 wt% and 2 wt% Au-NP concentrations. (Copyright © 2013, Royal Society of Chemistry. Reprinted with permission from Ref.[136]) ... 149
Figure 80. The histograms of APS and their PDS of Au-NP present in HPβCD/Au-NP-NF. (Copyright © 2013, Royal Society of Chemistry. Reprinted with permission from Ref.[136]) ... 149
Figure 81. The representative TEM and HR-TEM images of Au-NP obtained at DMF (2 wt% NP loading) and water (1 wt% NP loading) based system of HPβCD solutions. (Copyright © 2013, Royal Society of Chemistry. Reprinted with permission from Ref.[136]) ... 150
xxvii
Figure 82. The XRD spectra of electrospun HPβCD/Au-NP-NF produced from two solvent systems (DMF and water) at two different NP loading (1 wt% and 2 wt%). (Copyright © 2013, Royal Society of Chemistry. Reprinted with permission from Ref.[136]) ... 151
Figure 83. The solid UV-vis spectra of electrospun HPβCD/Au-NP-NF produced from two solvent systems (DMF and water) at two different NP loading (1 wt% and 2 wt%). (Copyright © 2013, Royal Society of Chemistry. Reprinted with permission from Ref.[136]) ... 152
Figure 84. The FTIR spectra of HPβCD nanofibers and HPβCD/Au-NP-NF obtained
in water and DMF. The zoom out region between 3800-3000 cm-1 at the –OH
stretching mode range of HPβCD molecule. (Copyright © 2013, Royal Society of Chemistry. Reprinted with permission from Ref.[136]) ... 153
Figure 85. The high resolution XPS of electrospun HPβCD/Au-NP-NF produced from two solvent systems (DMF and water) at two different NP loading (1 wt% and 2 wt%). (Copyright © 2013, Royal Society of Chemistry. Reprinted with permission from Ref.[136]) ... 154
Figure 86. The photograph and the schematic observation of the Pd-NP including (a) solution and (b) nanofibers. ... 155
Figure 87. The representative SEM images of electrospun composite nanofibers that were produced in DMF and water at the 1 wt% and 2 wt% Pd-NP concentrations. 155
Figure 88. The representative TEM images of electrospun composite nanofibers that were produced in DMF and water at the 1% and 2% Pd-NP concentrations. ... 156
Figure 89. (a) HRTEM image and (b) SAED pattern of Pd-NP. ... 157
Figure 90. The high resolution XPS of electrospun HPβCD/Pd-NP nanofibers produced from two solvent systems (DMF and water) at two different NP loading (1 wt% and 2 wt%). ... 157
Figure 91. The UV-vis spectra taken during the catalytic activity test of (a-i) HPβCD/DMF nanofibers, (a-ii) HPβCD/water nanofibers, (b-i)
HPβCD/Pd-NP-1%-xxviii
DMF , (b-ii) HPβCD/Pd-NP-2%-DMF, (c-i) HPβCD/Pd-NP-1%-water and (c-ii)
HPβCD/Pd-NP-2%-water nanofibers. (d) The reduction of PNP to PAP by NABH4
and Pd-NP system along with the decolarization visualization. ... 159
Figure 92. Photograph of the insoluble poly-CD nanowebs obtained with ECH; the SEM image and the schematic representation of the fiber structure... 164
Figure 93. The schematic view of the constitution of the ether linkage between CD molecules in the case of ECH usage. ... 165
Figure 94. The SEM images of poly-CD nanofibers, produced with (a) ECH, (b) CA, (c) BTCA, (d) HMDI and (e) PEGDE, (i) before and (ii) after immersing in water for 24 h. ... 167
Figure 95. The SEM images of ECH based poly-CD nanofibers after soaking these nanowebs in acetonitrile, ethanol, methanol, chloroform, DMF and DMSO for 24 hours. ... 168
Figure 96. Time sweep (a) viscosity and (b) modulus measurement results taken at
process temperature 50 oC. (c) Viscosity measurement of ultimate poly-CD and
HPβCD solutions before the electrospinning. ... 170 Figure 97. (a) FTIR, (b) TGA and (c) XRD spectra of poly-CD nanofibers, HPβCD nanofibers and HPβCD powders. ... 171
Figure 98. (i) The UV-vis spectra and (ii) the rate (C/C0) of phenolphthalein
removing in the progressing time intervals belong to (a) poly-CD nanofibers (b) poly-CD granules. ... 173
Figure 99. The time dependent decrease of phenanthrene concentration in aqueous
solution for 1st and 2nd cycles. ... 174
Figure 100. The SEM images of poly-CD nanofibers after phenolphthalein and phenanthrene removing test. ... 175
xxix
LIST OF TABLES
Table 1. General properties of native CD. ... 7
Table 2. The characteristics of HPβCD solutions, fiber morphology, average fiber diameter and fiber diameter range of the electrospun HPβCD fibers. (DLS
measurements of CD solutions at 25 oC (Equilibrium at 25 oC for 2 minutes prior to
measurement) summarizing the average diameter (nm) and polydispersity index (PDI) of HPβCD aggregates). (Copyright © 2012, Royal Society of Chemistry. Reprinted with permission from Ref. [130]) ... 33
Table 3. The characteristics of HPγCD solutions, fiber morphology, average fiber diameter and fiber diameter range of the electrospun HPγCD fibers. (Copyright © 2012, Royal Society of Chemistry. Reprinted with permission from Ref.[130]) ... 38
Table 4. The characteristics of MβCD solutions, fiber morphology, average fiber diameter and fiber diameter range of the electrospun MβCD fibers.(DLS
measurements of CD solutions at 25 oC (Equilibrium at 25 oC for 2 minutes prior to
measurement) summarizing the average diameter (nm) and polydispersity index (PDI) of HPβCD aggregates). (Copyright © 2012, Royal Society of Chemistry. Reprinted with permission from Ref.[130]) ... 41
Table 5. The characteristics of CD solutions, average fiber diameter, fiber diameter range and surface area of CD nanofibers and CD powder. ... 54
Table 6. The molar ratio values of VOC:CD calculated from 1H NMR measurements.
(n:3, std dev: ±0.00). ... 58
Table 7. The molar ratio values of VOC:CD calculated from HPLC measurements. (n:3, std dev: ±0.00). ... 60
Table 8. The characteristics of CD solutions (DLS measurements of α-CD and β-CD
solutions at 25 oC summarizing the average diameter (nm) and polydispersity index
(PDI) of CD aggregates), average fiber diameter, fiber diameter range and fiber morphology of the electrospun CD nanofibers. (Copyright © 2013, Elsevier.
xxx
Reproduced with permission from Ref.[131] and Copyright © 2013, Royal Society of Chemistry. Reproduced with permission from Ref.[132]) ... 66
Table 9. Thermodynamic Parameters Obtained from ITC Measurements.
Stoichiometry (N), complex stability constants (Ks/M-1), standard enthalpy changes
(ΔHo
/ kJ mol-1), and entropy changes (TΔSo, kJ mol-1) for inclusion complexation of
the triclosan with HPβCD in water at 298 K. (Copyright © 2011, American Chemical Society. Reprinted with permission from Ref.[133]) ... 86
Table 10. The characteristics of HPβCD, HPγCD solutions, triclosan/HPβCD-IC and triclosan/HPγCD-IC suspensions and the properties of resulting electrospun nanofibers. (Copyright © 2014, Elsevier. Reprinted with permission from Ref.[134]) ... 94
Table 11. Properties of the vanillin/CD-IC solutions and the resulting nanofibers. 104
Table 12. The molar ratio values and the percentage conversions (%, (w/w)) of
EOs:CD calculated from 1H NMR measurements. ... 118
Table 13. The properties of the electrospinning solutions and the AFD and the APS of Ag-NP present in the electrospun nanofibers. (Copyright © 2014, Elsevier. Reprinted with permission from Ref.[253]) ... 127
Table 14. The inhibition zone results taken after 24 h for PVA, PVA/HPβCD-25%,
PVA/Ag-NP, PVA/HPβCD-7.5%/Ag-NP, PVA/HPβCD-15%/Ag-NP and
PVA/HPβCD-25%/Ag-NP nanofibers against E. coli and S. aureus. (Copyright © 2014, Elsevier. Reprinted with permission from Ref.[253])... 134
1
INTRODUCTION
1.1. Electrospinning
Electrospinning is the most prominent nanofiber fabrication technique, which left one's mark in the last two decades. Although, there are several methods for the production of nanofibers (melt drawing, melt fibrilation, phase separation, self-assembly, island-in-sea, gas jet etc.), electrospinning is distinguished among other methods with its comparative low-cost, simplicity of set-up, relatively high production rate and reproducibility [1, 2]. Electrospinning has also another exceptional advantage over conventional fiber production techniques since nanofibers can be readily produced from a variety of polymers, polymer blends, sol-gels, suspensions, emulsions and composite structures [1-9]. Electrospun nanofibers can be obtained by having diameters ranging from tens of nanometers to few microns with uniform morphology that leads up to numerous remarkable and unique characteristics including, extremely high surface area, very light-weight, nano-porous features and distinct physical/mechanical properties along with design flexibility for specific physical and chemical functionalization [1, 4, 10, 11].
The basic set-up of electrospinning consists of three main components; high voltage power supply, syringe pump (spinneret) and grounded collector (Figure 1). The electrospinning apparatus that we use in our laboratory at UNAM is depicted in Figure 2. In this technique, the polymer solution or melt, which are loaded into syringe, are pumped through the spinneret with the use of a syringe pump at a controllable rate. In the meanwhile, high voltage (in the range of 1 to 30 kV) is applied to spinneret; the drop at the tip of the nozzle is highly electrified; finally the formed charges on the surface create electrostatic forces and interactions which cause cone-shaped deformation at the drop, by the name of Taylor cone. When the electrical field is high enough, the electrostatic forces able to overcome the surface tension of the electrospinning solution and thereby a liquid jet forms that goes towards to grounded collector. While this consisted jet is moving through the collector, it is exposed to stretching and whipping process which provides thin and
2
long fiber formation in company with the solvent evaporation. Finally, the ultimate nanofibers are deposited randomly (or aligned) on the collector as a non-woven mat [1, 4, 12].
Figure 1. Schematic view of the electrospinning set-up.
Figure 2. Electrospinning set-up at UNAM.
The morphology and the thickness of the electrospun nanofibers are highly depend on the various parameters which are summarized under three main titles; i) polymer solution parameters; polymer type, molecular weight of polymer, concentration, viscosity, surface tension, conductivity, fluid elasticity, dielectric constant and volatility of solutions; ii) operational conditions; applied voltage, distance between spinneret and collector, feed rate, type of the collector and diameter
3
of the needle; iii) ambient conditions; temperature, humidity and pressure/vacuum [1, 13-23]. To obtain uniform nanofibers, all these factors should be taken into consideration and applied or fixed at the optimum level. Among all mentioned parameters, the intrinsic properties of the electrospinning solutions are the most crucial and influential ones for the determination of nanofiber morphology. The molecular weight of polymer and concentration can be considered as the most important factors which affect the viscosity of the electrospinning solutions [1]. The sufficient viscosity of the system is provided by the sufficient molecular weight and concentration of the polymer that determine the amount of chain entanglement within the solution. The required level of entanglement and overlapping are essential to sustain the continuity of the jet during the electrospinning, otherwise the driven jets break up and electrospraying occurs which yields beads instead of fibers [1]. Figure 3 indicates the effect of increasing concentration on the morphology of polycarbonate (PC) nanofibers. From SEM images, the morphology alteration from beaded to bead-free uniform nanofibers can be easily detected by the increasing of PC concentration from 16% (w/v) to 25% (w/v). Since, the viscosity of solution reached to adequate level by the 25% (w/v) that stabilize the electrospinning jet during the process. The conductivity of solution is another effective factor for the electrospinning. The higher conductivity of the electrospinning system, increase the charges potential in the solution and jet is being exposed higher stretching during process thus, nanofibers having smaller diameters are yielded [1, 19].
Figure 3. The representative SEM images of PC nanofibers obtained at (a) 16% (w/v), (b) 20% (w/v) and (c) 25% (w/v) polymers concentrations.
By varying the electrospinning parameters or set-up, it is easy to obtain nanofibers having different morphology or arrangements. Beside the basic and
4
smooth nanofiber structure, it is also possible to produce porous, hollow, core-shell or aligned fibers by applying some modifications to electrospinning systems [1, 4, 12]. As it is mentioned, electrospun nanowebs already have high porosity, however porous structures can be also created on the fiber exterior, and the surface area of the nanofibers can be extremely increased [24]. Porous nanofibers are being obtained by using different approaches and one of them involves the use of solvent blend system which composes of solvent types having different volatility [25]. Figure 4 indicates the SEM images of porous cellulose acetate (CA) ultrathin fibers which were produced in dichloromethane (DCM)/acetone blend system by electrospinning. Here, the fast evaporation of solvent gives rise to local phase separation, and the solvent-rich regions transform into pores during the electrospinning process [25]. In the case of basic electrospinning settling, nanofibers are generally obtained in random arrangements on the fixed collector type. On the other hand, ordered and aligned nanofibers can be also produced through the manipulation of the collector as a cylindrical rotating drum or split plate [26]. The nozzle system can be also modified so as to obtain different featured nanofibers. For instance, it is possible to produce core-shell systems in which two concentrically aligned nozzles are used for electrospinning and same voltage is applied to both nozzles [27]. This configuration generally carried out when one of the components is too low to be spun into fibers (drugs, biomolecules, enzyme, bacteria, viruses etc.) and so get involved as core of the system [28]. Hollow nanofibers are another structure which can be easily obtained by the selectively removing of the inner part of the core-shell system [29, 30].
Figure 4. The SEM image of electropsun porous CA ultrathin fibers. (Copyright © 2011, Elsevier. Reproduced with permission from Ref.[25])
5
In addition to above mentioned manipulations, it is also possible to enhance the functionalities of electrospun nanofibers by integrating them with metal nanoparticles, nanowires, inorganic precursors, drugs, dyes, bioactive agents (cell, enzyme, DNA, peptide, bacteria etc.), food additives (flavor/fragrance, essential oils) etc. [31-43]. Furthermore, their surface can be easily modified by applying various kinds of chemical reactions [10, 44, 45]. Due to all these functionalization, electrospun nanofibers are being gained intriguing electronic, magnetic, optical and biological features. In summary, the unique properties and the multi-functional nature of electrospun nanofibers make them applicable in numerous are [4, 11, 12, 46] including; textile [4], filter/membrane (separation and affinity membrane, molecular filtration, liquid and gas filtration) [47-57], biotechnology (delivery of drug and bioactive agents, tissue engineering, wound healing dress) [32, 58-66], catalyst/enzyme (chemical reactions and biological process) [37, 67-73], sensors (thermal, piezoelectric, biochemical) [74-79], energy/electronics (solar cells, fuel cells, hydrogen storage, batteries, transistor, supercapacitors) [80-84] and food/agriculture (Figure 5) [31, 40-42, 85-88].
6
1.2. Cyclodextrins
Cyclodextrins (CD) are cyclic oligosaccharides consisting of α-(1,4)-linked glucopyranose sub-units. CD are produced as a result of starch degradation by the help of glucosyl transferase enzyme (CGTase) which are obtained from various microorganisms [89-91]. The most abundant and common CD types are α-CD, β-CD and γ-CD having six, seven and eight glucopyranose units in their cyclic system, respectively (Figure 6). These three CD are commonly considered as first generation or parent CD and they are generally names as “native” CD [90-92]. The characteristic physical and chemical properties of native CD are summarized in Table 1. In the ring structure of CD, the C-2-OH group of one glucopyranose unit can form a H-bond with the C-3-OH group of the neighboring glucopyranose unit. This intramolecular H-bonding determines the solubility of native CD in water [90, 91, 93]. In the case of β-CD, a complete secondary belt is formed by these H-bonds, so β-CD has quite rigid structure and lowest water solubility among other native CD. For α-CD, the H-bond belt is not complete, because one of the glucopyranose units is in a disordered position and it is able form four H-bonds instead of six H-bonds. On the other hand, γ-CD is more flexible with its non-coplanar structure; therefore, it has the highest aqueous solubility in three CD types (Table 1) [90].
7
Table 1. General properties of native CD.
Properties α-CD β-CD γ-CD
Number of glucopyranose units 6 7 8
Molecular weight (g/mol) 972 1135 1297
Outer diameter (Å) 14.6 15.4 17.5
Cavity diameter (Å) 4.7-5.3 6.0-6.5 7.5-8.3
Height of torus (Å) 7.8 7.8 7.8
Approximate cavity volume (Å3) 174 262 472
Solubility in water at 25 oC (g/100 mL) 14.5 1.85 23.2
Apart from these three natural CD types, there are also many different CD derivatives which are obtained by chemical or enzymatic modifications. For this reason, the OH (or H) of CD molecules are generally modified by the substitution of different groups such as; alkly, hyroxylalkyl, carboxyalkyl, amino, thio, tosyl, ether, ester etc.[90, 91, 94, 95]. As it is known, β-CD is the most widely consumed native CD for numerous reasons (price, availability, approval status, etc.) [95]. However it has very limited solubility, so the main aim of these modifications is generally based on the solubility enhancement of native CD (especially β-CD) which is rather restricted in aqueous medium. In addition, different cavity volume and stability against light and oxygen can be provided with CD derivatization [95]. On the other hand, availability is an important issue in the case of modified CD, since after multistep reactions and purifications, the acquired CD amount and the prices should be at acceptable level for the practical usage. From this point, when we look through the market, the highly water soluble hydroxypropyl-β-cyclodextrin (HPβCD), hydroxypropyl-γ-cyclodextrin (HPγCD) and methyl-β-cyclodextrin (MβCD) come into prominence with their industrially production scale, standardization and superior availability (Figure 7(a)) [90, 94, 95].
8
Figure 7. (a) Chemical structure and the schematic view of the modified HPβCD or MβCD. (b) Chemical structure of glucopyranose unit and schematic representation of the primary, secondary side of CD molecules.
CD molecules are composed of 4C1 conformation of the glucopyranose units,
so all secondary hydroxyl groups (C2 and C3) are located on one edge of the ring, while all the primary hydroxyl groups (C6) are situated on the other edge. The primary hydroxyl groups have free rotation ability whereas the secondary ones are more strict and stable. Hence, the diameters of two edges are different from each other with narrower (primary hydroxyl) and wider (secondary hydroxyl) rims and so CD have truncated cone shape structure (Figure 7(b)) [90-92]. Additionally, the apolar C3 and C5 hydrogen and glycosidic oxygen bridges are placed at the inside of the CD molecule which provides a relatively hydrophobic (apolar) cavity and hydrophilic outside [90]. Due to their unique molecular structure, CD can form intriguing supramolecular assemblies by forming non-covalent host-guest inclusion complexes (IC) with a variety of small molecules as well as macromolecules (drugs, antibacterial, food additives, textile auxiliaries, and so forth) (Figure 8) [89-91, 94, 96, 97].
9
Figure 8. Schematic view of IC formation between CD and guest molecule.
The inclusion complexation of CD (host) with different compounds (guest) mainly depends on two factors; dimensional fit and specific local interaction between host and guest molecules [90, 91, 96]. On the other hand, the energetic factors, that encourage and contribute to the inclusion complexation, can be generalized under three main issue; (1) the apolar CD cavity is occupied slightly by the polar water molecules so, the displacement of water molecules with the more proper apolar compound is favorable, (2) depending on this, the repulsive interaction between guest molecules and aqueous environment is decreased and the H-bond in the pool is increased by release of water molecules from CD cavity, (3) finally the apolar-apolar association is provided by insertion of guest molecules into CD which results in conformational change and strain release of the CD rings [90, 91]. In other respects, inclusion complexation is a dynamic process in which van der Waals and hydrophobic interactions largely occur between host and guest molecules, besides, H-bonding can also take place [92, 96]. There are several ways to form CD IC including; co-precipitation, slurry, paste, dry mixing etc., and they are differentiated from each other according to employed water amount. For laboratory scale, co-precipitation is the most suitable method in which required level of water is used for the dissolution of CD and dispersion\emulsion of guest molecules, hence more favorable conditions are provided for the IC formation compared to other methods.
The inclusion complexation phenomena reach significance by providing beneficial modifications to physicochemical properties of guest molecules. By the inclusion complexation, the solubility of insoluble compound is enhanced, the stability against oxidation, visible/UV-light and heat are improved, volatility and sublimation of the molecules are controlled, the unpleasant odors and flavors are
10
masked off, chromatographic separations are achieved and drugs/flavors are release in controlled manner [89-91, 94].
Due to non-covalent host-guest complexation ability and non-toxic nature,
CD are particularly applicable in many areas including;
filtration/separation/purification systems,pharmaceuticals, cosmetics, home/personal
care, functional foods, textiles, analytic chemistry, adhesive and coatings system, as well as advanced functional systems such as smart materials, sustained/controlled delivery systems, sensors, molecular switches, diagnostic system and devices [96, 98-111]. To enhance the application potential of CD molecules, especially in liquid environment, insoluble CD polymers are also being produced by using various kinds of crosslinking agents and by applying different polymerization techniques [112-117].
1.3. Electrospinning of non-polymeric systems
In principle, electrospinning of nanofibers involves high molecular weight polymers and high solution concentrations since entanglements and overlapping between the polymers chains play an important role for the continuous stretching of electrified jet for uniform fiber formation otherwise, electrospraying occurs which yields beads instead of fibers [1, 17, 18, 118-121]. For the electrospinnability of solutions, the importance of elasticity and relaxation time rather than molecular entanglements has also been reported [20, 122]. So, the electrospinning of non-polymeric systems (low molecular weight molecules) is much more challenging than the polymeric systems. However, very recent studies have indicated that high molecular weight polymers are not vital for the uniform fiber formation. Correspondingly, there are notably reports in the literature regarding to electrospinning of non-polymeric systems.
The preliminary study about this subject was firstly reported by Long and his group members. They achieved to obtain polymer-free ultrathin fibers (1 to 5 micrometers) from lecithin, which is a natural mixture of phospholipids and neutral lipids, by using electrospinning. It was shown that, the cylindrical micelles are form in the high concentrated solution of lecithin and they are able to overlap and entangle
11
in a similar way to polymer chains in solutions [123]. In another study of the same group, the electrospinning of ammonium gemini surfactant
(N,N`-didodecyl-N,N,N`,N`-tetramethyl-N,N`-ethanediyldiammonium di-bromide (12-2-12)) was
reported without using polymeric matrix. Here, it was demonstrated that, supramolecular assemblies were formed in the gemini surfactant solutions, which provide stabilization of electrospinning jet for continuous fiber formation [124]. In the study of Kern et al. polymer-free nanofibers were obtained from diphenylalanine (Phe-Phe) which is a well-known amino-acid type. The self-assembly property of this amino-acid enabled the production of both micron and nanosized fibers [125].
In another related study, Huang et al. benefitted from the non-covalent interaction between benzo-21-crown-7 (B21C7) and dialkylammonium salt for the production of nanofibers. Here, B21C7 bind to secondary ammonium salt and form linear supramolecular polymers which are based on low-molecular-weight monomers. Then, by the self-organization of these supramolecular structures, the nanofibers production became possible via electrospinning [126]. The similar concept was also adapted in the study of Yang et al. This time, pillar[5]arene based receptors were used to form stimuli-responsive supramolecular polymers in the high concentrated solutions and finally nanofibers from their assemblies [127]. One of the associated study, Schmidt et al. reported the production of polymer-free nanofibers from supramolecular structures of self-assembling cyclo-hexane- and 1,3,5-benzenetrisamides by melt-electrospinning process, since the liquid phases of
mentioned compounds are so viscous to be electrospun [128].
We have contributed this novel research area, related to electrospinning of non-polymeric systems, by producing nanofibers from cyclodextrins (CD) molecules. It is worth mentioning that at the time we started these studies, there were only few publications reporting on polymer-free nanofibers formation and we have also firstly reported the electrospinning of nanofibers from very small molecules [123-125]. Initially, we obtained CD nanofibers from three different chemically modified CD types ((hydroxypropyl-β-cyclodextrin (HPβCD), hydroxypropyl-γ-cyclodextrin (HPγCD) and methyl-β-hydroxypropyl-γ-cyclodextrin (MβCD)) [129, 130]. Then we