Abstract. Breast cancer (BC) is the most frequently diagnosed cancer that affects women worldwide. Early detection of BC is important to improve survival rates and decrease mortality. The aim of the present study was to investigate serum biomarkers using surface-enhanced laser desorption ionization time-of-flight mass spectrometry (SELDI-TOF-MS) to distinguish patients with BC from the healthy population and patients with benign breast diseases (BBDs). A total of 62 patients with invasive ductal carcinoma, as confirmed by histopa-thology, and 47 non-cancerous individuals (NCIs) [16 healthy controls (HCs) and 31 patients with BBD] were enrolled in the present study. Serum protein profiles were determined by SELDI‑TOF‑MS using an immobilized metal affinity capture array. Serum from patients with BC were compared with that from the HC group using univariate and multivariate statis-tical analyses. A total of 118 clusters were generated from the individual serum. Univariate analysis revealed that 5 peaks were significantly downregulated (m/z 1,452, 2,670, 3,972, 5,354 and 5,523; P<0.001) and 4 were upregulated (m/z 6,850, 7,926, 8,115 and 8,143; P<0.001) in patients with BC compared with the HC group. A comparison of patients with BC and patients with BBD revealed an additional 9 protein peaks. Among these, 3 peaks (m/z 3,972, 5,336 and 11,185) were significantly downregulated and 6 peaks (m/z 4,062, 4,071,
4,609, 6,850, 8,115 and 8,133) were significantly upregulated. A total of 3 peaks [mass‑to‑change ratio (m/z) 3,972, 6,850 and 8,115 (BC2)] were common in both sets. The results of the present study suggest that a 4 protein peak set [m/z 3,972, 6,850 and 8,115 (BC2) and 8,949 (BC3)] could be used to distinguish patients with BC from NCI.
Introduction
Breast cancer (BC) is among the most frequent cancers in women in worldwide, and is the second leading cause of cancer-related mortality in women (1). Breast cancer may generally spread to distant locations, which affects curability of the cancer (2). Therefore, accurate and early detection of BC, particularly when pre-symptomatic, is a crucial factor in attaining a higher survival rate and improved prognosis for patients (3). Mammography is a generally preferred method in the detection of BC; however, in young women and women with dense breast tissue, mammographic screening may be less sensitive (4). In these cases, magnetic resonance imaging, an alternative screening approach, may be more sensitive than mammography (5). Blood-based screening tests would be cost‑effective and efficient as an application for large‑scale screenings. Studies on the specific molecular targets (oncogenes, tumor suppressor genes, growth factors, tumor antigens or other gene products) in BC make possible the application of blood-based screening approaches for BC. Further improvements in protein expression analysis and proteomics methods have led to the development of serum based diagnostics and prognostics for many types of cancer (6). One of these methods, surface-enhanced laser desorption ionization (SELDI), enables the identification of biomarkers in physiological fluid samples to distinguish patients with patients from healthy individuals (7). Although certain biomarkers may be used to identify BC, few of them have been validated for clinical use. Previous studies have reported a number of potential serum biomarkers that may be used to diagnose BC; BC1 (4.3 kDa), BC2 (8.1 kDa) and BC3 (8.9 kDa) (8,9). The structural definitions of these biomarkers
An efficient biomarker panel for diagnosis of breast
cancer using surface-enhanced laser desorption
ionization time-of-flight mass spectrometry
TURKAN YİGİTBASİ1*, GİZEM CALİBASİ‑KOCAL2*, NİHAL BUYUKUSLU3, MURAT KEMAL ATAHAN4, HAKAN KUPELİ4, SEYRAN YİGİT5, ERCUMENT TARCAN4 and YASEMİN BASKİN2
1Department of Biochemistry, School of Medicine, Istanbul Medipol University, Istanbul 34810; 2Department of Basic Oncology, Institute of Oncology, Dokuz Eylul University, Izmir 35340; 3Department of Nutrition and Dietetics,
School of Health Sciences, Istanbul Medipol University, Istanbul 34810; Departments of 4General Surgery and 5Pathology, Ataturk Training and Research Hospital, Katip Celebi University, Izmir 35360, Turkey
Received June 21, 2017; Accepted December 11, 2017 DOI: 10.3892/br.2018.1042
Correspondence to: Dr Turkan Yigitbasi, Department of Biochemistry, School of Medicine, Istanbul Medipol University, Istanbul 34810, Turkey
E-mail: [email protected]
*Contributed equally
Key words: breast cancer, early diagnosis, biomarker, proteomics, surface-enhanced laser desorption ionization time-of-flight mass spectrometry
are as follows: BC1, inter-α-trypsin inhibitor heavy chain H4; BC2, C3a des-arginine-C terminal truncated peptide; and BC3, C3a des-arginine (10). A number of other potential biomarkers have been identified and demonstrated to have high diagnostic accuracy (7,11,12). However, validating these proteins is difficult due to different protocols for sample handling, patient populations and tumor characteristics.
The aim of the present study was to investigate and deve-lop an efficient biomarker panel to distinguish patients with BC from healthy individuals and patients with benign breast disease (BBD) using SELDI time‑of‑flight mass spectrom-etry (SELDI-TOF-MS).
Materials and methods
Patient characteristics. This prospective study included
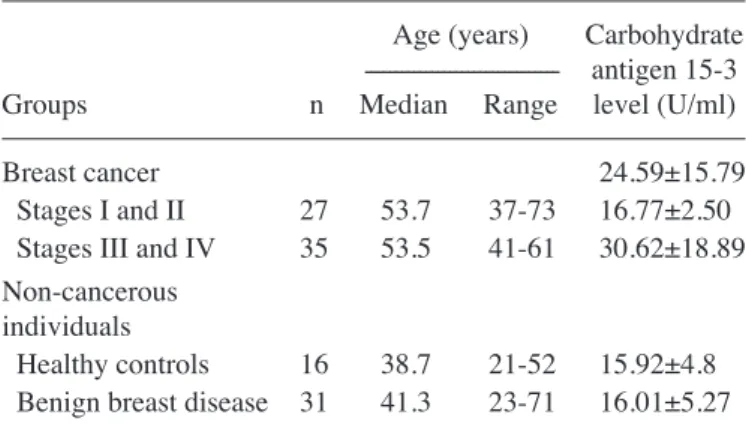
62 patients with histopathologically confirmed BC with invasive ductal carcinoma and 47 non-cancerous individuals (NCIs). The study was approved by the Ataturk Training and Research Hospital Ethics Committee of Katip Celebi University (Izmir, Turkey) and performed in accordance with the Declaration of Helsinki. Among the patients with BC, 27 were in the early stages of disease (stages I and II) and 35 patients were in the advanced stages (stages III and IV). All patients were staged using the American Joint Committee on Cancer (AJCC) 6th edition staging manual (13). In the NCI group, 16 subjects were healthy controls (HCs) and 31 were patients with BBD. Patients with carcinoma in situ were not enrolled in the present study. Informed consent was obtained from all patients and control subjects. Demographic and clinical characteristics of the participants are presented in Table I. Patients did not receive radiotherapy or chemotherapy prior to surgery. Patients with BC had no evidence of chronic obstructive pulmonary disease, diabetes mellitus or malignancy at other sites. For women in the HC group who had breast examinations, the mammography and ultrasound results were normal.
Laboratory analysis. A standardized protocol was used
for sample collection and processing. Blood samples were collected in a BD Vacutainer P100 v1.1 Tube (8.5 ml; BD Biosciences, Franklin Lakes, NJ, USA) and centrifuged at 3,000 x g and 4˚C for 15 min. Samples were subsequently aliquoted and stored at ‑80˚C for further analysis. An automatic electrochemistry luminescence immunoassay system (ECLIA, Elecsys 2010 system; Roche Diagnostics GmbH, Basel, Switzerland) was used to determine the serum carbohydrate antigen 15-3 (CA15-3 level), according to the manufacturer's instructions. The cut‑off value of CA15‑3 was 25 U/ml, with values >25 U/ml considered to be positive.
Serum protein profiling. Serum protein profiles were
deter-mined using immobilized metal affinity capture arrays (IMAC30; Bio-Rad Laboratories, Inc., Hercules, CA, USA). Samples were incubated with 50 µl of 100 mM CuSO4 solution for 5 min, rinsed with distilled water and washed three times for 10 min with binding solution (200 µl; comprising 500 mM NaCl and 100 mM NaH2PO4/NaOH; pH 7.0). Samples were subsequently diluted with dilution solution (9 M urea, 50 mM Tris/HCl, pH 9.0, 2% w/v CHAPS (Sigma‑Aldrich; Merck KGaA, Darmstadt, Germany) at a ratio of 5:1 and
vortexed at medium mixing mode for 30 min at 4˚C. A total of 100 µl binding buffer was added into 10 µl of this mixture. From this, 100 µl was applied to each spot on IMAC30 chips. The chips were incubated at room temperature for 60 min on the horizontal shaker (900 rpm) and subsequently washed 4 times with 200 µl binding solution for 10 min on the hori-zontal shaker. Chips were washed with 1 mM HEPES, pH 7.0 and stored at room temperature until dry. Matrix solution (1 µl) including 50% saturated solution of sinapinic acid (Fluka Chemie AG, Buchs, Switzerland) in 50% acetonitrile and 0.5% trifluoroacetic acid (both from Sigma‑Aldrich; Merck KGaA), was added to each well and stored at room temperature until dry. Chips were analyzed by using the Protein Biological System IIc SELDI-TOF (Bio-Rad Laboratories, Inc., Hercules, CA, USA). The generation of TOF spectra was achieved by 192 laser shots with laser intensity of 220 eV and a detector sensitivity of 9. Peaks between 3,000 and 50,000 Da were recorded, with a maximum peak of 200,000 Da. The external calibration of the instrument was achieved using the all-in-one peptide molecular mass standard (Bio-Rad Laboratories, Inc.) as presented in Fig. 1. The mass accuracy was 0.08% with this system. All mass spectra were calibrated internally. Peak intensities were normalized to total ion flow.
Bioinformatics analysis. The Epi Info-7 program was
used to calculate sample size Spectral data were collected using Protein Chip Data Manager 3.0 software (Bio-Rad Laboratories, Inc.), which was also used for data processing and univariate statistical analysis. Internal mass calibration and normalization of peak intensities were performed based on total ion flow. Automatic baseline correction was used. For peak selection, the very low mass region (0-1,500 Da) overlap-ping with single-photon absorptiometry peaks was excluded. The default average filter with a setting of x0.2 expected peak width was used for data filtering. Eligible mass peaks were with signal/noise >5. Mass window for peak clustering was 0.3% of the peak mass. Inter‑group comparison of each peak cluster was performed using the one-way Mann-Whitney U test. Areas under the receiver operating characteristic (ROC) curve (AUC) were calculated for each peak cluster. A total of 118 clusters were obtained; the cluster mass was 0.5% and the signal-to-noise ratio for the second pass was 1 for the settings used for cluster completion.
Table I. Demographics of patients and control subjects enrolled in the present study.
Age (years) Carbohydrate
--- antigen 15-3
Groups n Median Range level (U/ml)
Breast cancer 24.59±15.79
Stages I and II 27 53.7 37-73 16.77±2.50
Stages III and IV 35 53.5 41-61 30.62±18.89
Non-cancerous individuals
Healthy controls 16 38.7 21-52 15.92±4.8
Statistical analysis. All continuous variables are presented as
the mean ± standard deviation. Comparisons between groups were achieved by two-sample t-tests and Pearson's χ2 tests. Relative peak intensity levels were compared using the Student's t-test. Univariate analysis using the Mann-Whitney U test was used to compare sera from patients with BC with the NCI group. ROC analysis was achieved by the calculation of AUC. SPSS 21.0 (IBM Corp., Armonk, NY, USA) was used for all statistical analysis. P<0.05 was considered to indicate a statistically significant difference.
Results
Reproducibility. Each serum sample was spotted on eight
locations on one chip, to attain a reliable analysis technique. The coefficient variations of m/z values were 0.03‑0.07 and the protein intensity was 0.34-0.79 for randomly selected peaks. The reproducibility of SELDI ProteinChip assays was assessed by running 16 pooled normal human serum samples. The mean variance coefficient based on pooled sera was lower <12%. Variation in day‑to‑day sampling and instrumen-tation or chip variations were negligible.
Serum protein profiling of the BC group compared with the HC group. For the study group, 118 peaks per spectrum were
obtained, with masses ranging from 2 to 20 kDa. Of these, no single peak could be used to distinguish BC from HC serum.
From the 118 peaks, 9 protein peaks at m/z 1,452, 2,670, 3,972, 5,354, 5,523, 6,850, 7,926, 8,143 and 8,115 (BC2) were automat-ically selected as splitters. A total of 5 peaks were decreased (m/z 1,452, 2,670, 3,972, 5,354 and 5,523; P<0.001; Table II) and 4 were significantly increased (m/z 6,850, 7,926, 8,115 and 8,143; P<0.001; Table II) in patients with BC compared with the HC group.
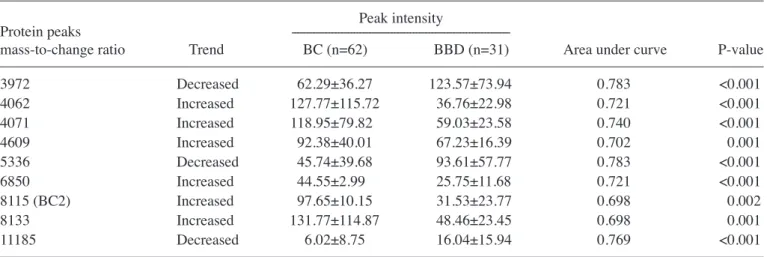
Serum protein profiling of the BC group compared with the BBD group. The SELDI-TOF-MS results for the BC and
BBD groups revealed that 3 protein peaks (m/z 3,972, 5,336, and 11,185) were significantly decreased and 6 (m/z 4,062, 4,071, 4,609, 6,850, 8,115, and 8,133) were significantly incre‑ ased in the BC group compared with the BBD group (P<0.01; Table III). Of these, the protein peak at 8,115 Da (BC2) was one of the previously defined biomarkers of BC (8,9).
Serum protein profiling of the BC group compared with the NCI group. SELDI‑TOF‑MS results revealed peaks at m/z 3,972,
6,850, 8,115 (BC2) and 8,949 Da (BC3) for patients with BC compared with NCI (Table IV). ROC analysis of each candi-date tumor marker as a biomarker to distinguish between the BC and NCI groups is presented in Fig. 2. The AUC values for peaks are as follows: 0.799 for m/z 3,972, 0.752 for m/z 6,850, 0.732 for m/z 8,115 (BC2), 0.603 for m/z 8,949 (BC3), and 0.762 for CA15-3. The ROC data revealed that the protein peaks at 3,972 and 6,850 in patients with BC were novel biomarkers
Figure 1. All-in-one peptide molecular mass standard for six peptides, including 1084.247-[arginine 8]-vasopressin, 1637.903-somatostatin, 2147.500-dynor-phin A, 2933.500-adrenocorticotropic hormone [1-24] human, 3495.941-insulin B-chain (bovine) and 7033.614-hirudin.
Table II. Surface‑enhanced laser desorption ionization time‑of‑flight mass spectrometry results for BC and HC groups. Peak intensity
Protein peaks
---mass-to-change ratio Trend BC (n=62) HC (n=16) Area under curve P-value
1452 Decreased 154.74±88.02 262.18±124.99 0.775 <0.001 2670 Decreased 19.88±17.01 42.80±20.85 0.796 <0.001 3972 Decreased 62.29±36.27 104.06±45.17 0.781 <0.001 5354 Decreased 20.69±18.48 50±28.64 0.805 <0.001 5523 Decreased 8.94±0.68 17±0.76 0.806 <0.001 6850 Increased 44.55±2.99 21.95±1.6 0.781 <0.001 7926 Increased 70.86±36.19 37.56±17.54 0.796 <0.001 8115 (BC2) Increased 97.65±10.15 22.76± 13.85 0.751 <0.001 8143 Increased 138.37±80.33 62.19±35.95 0.781 <0.001
suitable for diagnosis. The sensitivity rates of 3,972, 6,850, 8,115 (BC2) and 8,949 Da (BC3) peaks were 63.0, 83.87, 66.13 and 77.0%, respectively (P<0.05). Sensitivity and specificity values of CA15‑3 were determined as 25.81 and 97.87%, respectively, whereas the sensitivity and specificity of the serum protein profiling test (4 peak pattern tests and CA15‑3) were 98.39 and 100%, respectively (data not shown).
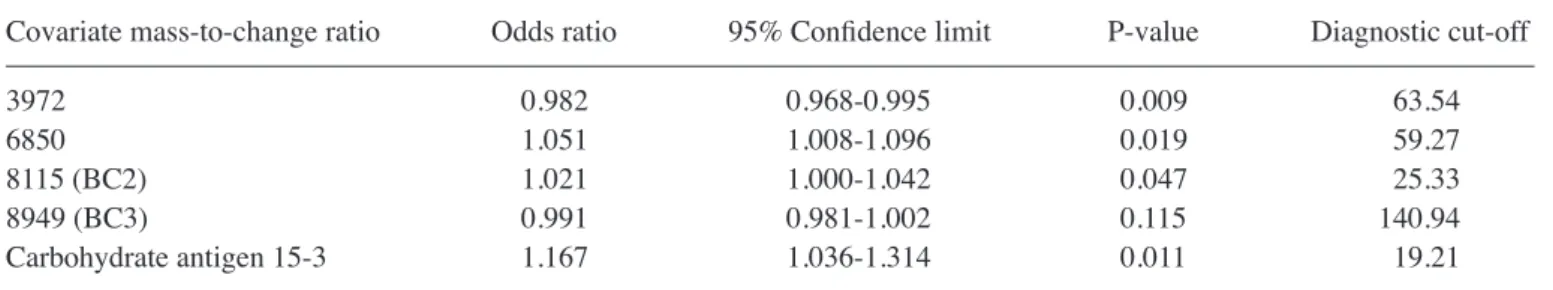
Bioinformatics analysis. A logistic regression curve was
calculated using the equation [y = 2.438 + 0.020(m/z 397) + 0.033(m/z 6850) + 0.011(m/z 8115) + 0.154(CA15‑3)]. As prese‑ nted in Table V, the minimum increase was 0.98-fold [odds ratio (OR) 0.982] at 3,972 Da, and the maximum increase was 1.17-fold (OR 1.167) at CA15-3. Considering the results of multi-variable logistic regression, a set of 4 protein peaks was selected to diagnose BC. The 4 peaks were 3,972, 6,850, 8,115 (BC2) and 8,949 (BC3), as well as CA15-3. Of these, 8,115 (BC2),
8,949 (BC3) and CA15-3 have been previously reported as biomarkers (8,9). The peaks at m/z 3,972 and 6,850 may there-fore be novel candidate markers for distinguishing patients with BC from NCI.
Discussion
Proteomics are widely used in BC studies to identify diagnostic markers; however, the numbers of validated clinical markers for BC is limited (13). Several genes have previously been reported to be upregulated in BC compared with control tissues (14,15). In addition, proteomic methods are easy to apply in the clinic to diagnose patients (16,17). Serum SELDI-TOF-MS protein profiling is a powerful method used for biomarker discovery and can be used to distinguish patients with BC from NCI with high sensitivity and specificity (18). It has previously been reported that monitoring protein-based markers in blood and urine samples may be used for cancer staging (19). In the past decade, a number of studies have utilized SELDI-TOF to iden-tify proteomic patterns in biological fluids, including serum, urine and nipple aspirates (20-22).
In the present study, serum samples of 62 patients with BC and 47 NCI were analyzed using SELDI-TOF-MS. Among the 118 examined peaks, multivariate analysis revealed 9 peaks in SELDI-TOF-MS results for patients with BC compared with those with BBD, as well as 9 peaks for patients with BC compared with HC subjects. By using the common peaks in both sets, 4 protein peaks were predicted as biomarkers to distinguish patients with BC from NCI. Several mutations are known to increase susceptibility to BC; the majority of inher-ited cases of BC are associated with two abnormal genes, BC1 and BC2 (23). It has been identified that the protein expression of BC1/2 is associated with increased susceptibility to BC by 40‑80% (24). Although several biomarker panels have been reported for various diseases using SELDI and ProteinChip arrays (25), there are few validated markers. The first valida-tion study by Li et al (8) proposed the use of BC2 and BC3 as biomarkers for BC. Decreases in BC1 and increased expres-sion of BC2 and BC3 in patients with BC have been reported in several studies (22,26,27). BC2 and BC3 have also been Table III. Surface‑enhanced laser desorption ionization time‑of‑flight mass spectrometry results for BC and BBD groups.
Peak intensity
Protein peaks
---mass-to-change ratio Trend BC (n=62) BBD (n=31) Area under curve P-value
3972 Decreased 62.29±36.27 123.57±73.94 0.783 <0.001 4062 Increased 127.77±115.72 36.76±22.98 0.721 <0.001 4071 Increased 118.95±79.82 59.03±23.58 0.740 <0.001 4609 Increased 92.38±40.01 67.23±16.39 0.702 0.001 5336 Decreased 45.74±39.68 93.61±57.77 0.783 <0.001 6850 Increased 44.55±2.99 25.75±11.68 0.721 <0.001 8115 (BC2) Increased 97.65±10.15 31.53±23.77 0.698 0.002 8133 Increased 131.77±114.87 48.46±23.45 0.698 0.001 11185 Decreased 6.02±8.75 16.04±15.94 0.769 <0.001
BC, breast cancer; BBD, benign breast disease.
Figure 2. ROC curve for each protein peak identified using SELDI‑TOF‑MS in patients with breast cancer compared with non-cancerous individuals. Area under curve values were as follows: m/z 3,972, 0.700; m/z 6,850, 0.752; m/z 8,115, 0.732; m/z 8,949, 0.603; CA15‑3, 0.762. ROC, receiver operating characteristic; SELDI-TOF-MS, surface-enhanced laser desorption ioniza-tion time‑of‑flight mass spectrometry; CA15‑3, carbohydrate antigen 15‑3.
reported to possess independent diagnostic merit to distin-guish between malignant disease, benign disease and control groups (9). BC3 was therefore included in the protein panel for analysis.
CA15-3 is the most widely used serum marker in patients with BC (22). Serum CA15-3 has been extensively studied, mainly to monitor the response of BC to treatment or to detect early relapse in BC follow‑up (28). A study by Gautam et al (29) reported that elevated concentrations of CA15-3 may be a useful and reliable diagnostic and prognostic indicator, as well as an indicator of treatment efficacy (29). The number of metastatic sites has been demonstrated to affect levels of CA15-3 (30). As CA15-3 is the most widely used serum tumor marker, it was included in the diagnostic panel in the present study.
Two peaks, at m/z values 3,972 and 6,850 Da, were identified for the first time as potential biomarkers of BC using SELDI-TOF-MS. These peaks were demonstrated to be able to distinguish patients with BC from HC subjects and patients with BBD. The peak at 3,972 Da was signifi-cantly decreased and the peak at 6,850 Da was signifisignifi-cantly increased. Previous studies have reported 4.3, 8.1 and 8.9 kDa proteins as biomarkers of BC; however, these results differ to those of the present study (8,11,22,26). A 3.8 kDa protein, close to m/z 3,972, was reported to be highly sensitive for the diagnosis of BC by Chung et al (12). A number of serum-based candidate biomarkers have been identified in different studies (8,10,22,31). Studies may have some differences in terms of inclusion/exclusion criteria, biologic samples, preparation protocols, arrays and analytical settings, which will affect the reproducibility and robustness of results. SELDI‑TOF‑MS proteomic profiling has been proposed as a
promising high-throughput technology with potential applica-tions in BC screening, detection and prognostication. In some studies, detected ion peaks were identified as different due to variations in population demographics, stage of disease, collection and storage conditions of samples, and analytical procedures (11,32,33). Aside from the most common proteins (BC1, BC2, BC3 and CA15-3), many of the studied peaks had poor sensitivities and specificities and alone were insufficient to diagnose BC. Furthermore, discrepancies in the peaks have been reported for several studies. For example, peaks at m/z 4,276 and 4,292 were reported by Winden et al (11) to be decreased in patients with BC, which was consistent with other studies; however, the peak at m/z 8,941 was reported to be decreased, whereas it was increased in previous studies (8,22,26). A review by Muthu et al (34), which summa-rized the features of SELDI-TOF-MS and its application in cancer biomarker discovery, reported that the technique has not yet been sufficiently investigated in different types of cancer and other diseases (34).
In present study, the resultant 4 peaks panel together with CA15-3 was demonstrated to have good sensitivity and specificity for the diagnosis of BC. These results indicate that protein peaks at 3,972 and 6,850 Da may be the novel candidate biomarkers for the diagnosis of BC. In conclu-sion, 4 peak clusters which are significantly different in patients with BC compared with NCI were identified using SELDI‑TOF‑MS, The identified peaks: 3,972, 6,850, 8,115 (BC2) and 8,949 Da (BC3) combined with CA15-3 expression may be used as a protein‑profiling test to diagnose BC. However, further investigation using a larger sample size should be performed to verify these results.
Table IV. Biomarkers used to determine patients with BC compared with NCI. Peak intensity
Protein peak
---mass-to-change ratio Trend BC (n=62) NCI (n=47) Area under curve P-value
3972 Decreased 62.29±36.27 116.93±65.71 0.799 <0.001 6850 Increased 44.55±2.99 24.45±13.52 0.752 <0.001 8115 (BC2) Increased 97.65±10.15 28.54±21.19 0.732 <0.001 8949 (BC3) Increased 185.28±95.47 148.26±62.16 0.603 0.016 Carbohydrate Increased 24.59 ±15.79 15.72±4.72 0.762 <0.001 antigen 15-3
BC, breast cancer; NCIs, non-cancerous individuals.
Table V. Results of multivariable logistic regression of risk factors for breast cancer.
Covariate mass‑to‑change ratio Odds ratio 95% Confidence limit P‑value Diagnostic cut‑off
3972 0.982 0.968-0.995 0.009 63.54
6850 1.051 1.008-1.096 0.019 59.27
8115 (BC2) 1.021 1.000-1.042 0.047 25.33
8949 (BC3) 0.991 0.981-1.002 0.115 140.94
References
1. Sun YS, Zhao Z, Yang ZN, Xu F, Lu HJ, Zhu ZY, Shi W, Jiang J, Yao PP and Zhu HP: Risk factors and preventions of breast cancer. Int J Biol Sci 13: 1387-1397, 2017.
2. Rahman M and Mohammed S: Breast cancer metastasis and the lymphatic system. Oncol Lett 10: 1233-1239, 2015.
3. Niell BL, Freer PE, Weinfurtner RJ, Arleo EK and Drukteinis JS: Screening for breast cancer. Radiol Clin North Am 55: 1145-1162, 2017.
4. Nothacker M, Duda V, Hahn M, Warm M, Degenhardt F, Madjar H, Weinbrenner S and Albert US: Early detection of breast cancer: Benefits and risks of supplemental breast ultrasound in asymptomatic women with mammographically dense breast tissue. A systematic review. BMC Cancer 9: 335, 2009.
5. Drukteinis JS, Mooney BP, Flowers CI and Gatenby RA: Beyond mammography: New frontiers in breast cancer screening. Am J Med 126: 472-479, 2013.
6. Baskın Y and Yiğitbaşı T: Clinical proteomics of breast cancer. Curr Genomics 11: 528‑536, 2010.
7. Liu C: The application of SELDI-TOF-MS in clinical diagnosis of cancers. J Biomed Biotechnol 2011: 245821, 2011.
8. Li J, Orlandi R, White CN, Rosenzweig J, Zhao J, Seregni E, Morelli D, Yu Y, Meng XY, Zhang Z, et al: Independent vali-dation of candidate breast cancer serum biomarkers identified by mass spectrometry. Clin Chem 51: 2229-2235, 2005.
9. Atahan K, Küpeli H, Gür S, Yiğitbaşı T, Baskın Y, Yiğit S, Deniz M, Cökmez A and Tarcan E: The value of serum biomarkers (Bc1, Bc2, Bc3) in the diagnosis of early breast cancer. Int J Med Sci 8: 148-155, 2011.
10. Belluco C, Petricoin EF, Mammano E, Facchiano F, Ross-Rucker S, Nitti D, Di Maggio C, Liu C, Lise M, Liotta LA, et al: Serum proteomic analysis identifies a highly sensitive and specific discriminatory pattern in stage 1 breast cancer. Ann Surg Oncol 14: 2470-2476, 2007.
11. van Winden AW, Gast MC, Beijnen JH, Rutgers EJT, Grobbee DE, Peeters PH and van Gils CH: Validation of previously identified serum biomarkers for breast cancer with SELDI-TOF MS: A case control study. BMC Med Genomics 2: 4, 2009.
12. Chung L, Moore K, Phillips L, Boyle FM, Marsh DJ and Baxter RC: Novel serum protein biomarker panel revealed by mass spectrometry and its prognostic value in breast cancer. Breast Cancer Res 16: R63, 2014.
13. Singletary SE and Connolly JL: Breast cancer staging: working with the sixth edition of the AJCC Cancer Staging Manual. CA Cancer J Clin 56: 37-47, 2006.
14. Harris L, Fritsche H, Mennel R, Norton L, Ravdin P, Taube S, Somerfield MR, Hayes DF and Bast RC Jr; American Society of Clinical Oncology: American Society of Clinical Oncology 2007 update of recommendations for the use of tumor markers in breast cancer. J Clin Oncol 25: 5287-5312, 2007.
15. Paweletz CP, Gillespie JW, Ornstein DK, Simone NL, Brown MR, Cole KA, Wang QH, Huang J, Hu N, Yip TT, et al: Rapid protein display profiling of cancer progression directly from human tissue using a protein biochip. Drug Dev Res 49: 34-42, 2000. 16. Nakanishi T, Shimizu A, Okamoto N, Ingendoh A and Kanai M:
Analysis of serum protein precipitated with antiserum by matrix‑assisted laser desorption ionization/time‑of‑flight and electrospray ionization mass spectrometry as a clinical labo-ratory test. J Am Soc Mass Spectrom 6: 854-859, 1995.
17. Lacey JM, Bergen HR, Magera MJ, Naylor S and O'Brien JF: Rapid determination of transferrin isoforms by immunoaffinity liquid chromatography and electrospray mass spectrometry. Clin Chem 47: 513-518, 2001.
18. Vlahou A, Laronga C, Wilson L, Gregory B, Fournier K, McGaughey D, Perry RR, Wright GL Jr and Semmes OJ: A novel approach toward development of a rapid blood test for breast cancer. Clin Breast Cancer 4: 203-209, 2003.
19. Yao F, Zhang C, Du W, Liu C and Xu Y: Identification of gene-expression signatures and protein markers for breast cancer grading and staging. PLoS One 10: e0138213, 2015.
20. Diamandis EP: Point: Proteomic patterns in biological fluids: Do they represent the future of cancer diagnostics? Clin Chem 49: 1272-1275, 2003.
21. Higgins SA, Matloff ET, Rimm DL, Dziura J, Haffty BG and King BL: Patterns of reduced nipple aspirate fluid production and ductal lavage cellularity in women at high risk for breast cancer. Breast Cancer Res 7: R1017-R1022, 2005.
22. Li J, Zhang Z, Rosenzweig J, Wang YY and Chan DW: Proteomics and bioinformatics approaches for identification of serum biomarkers to detect breast cancer. Clin Chem 48: 1296-1304, 2002.
23. Ford D, Easton DF, Stratton M, Narod S, Goldgar D, Devilee P, Bishop DT, Weber B, Lenoir G, Chang‑Claude J, et al; The Breast Cancer Linkage Consortium: Genetic heterogeneity and penetrance analysis of the BRCA1 and BRCA2 genes in breast cancer families. Am J Hum Genet 62: 676‑689, 1998.
24. Vos S, Moelans CB and van Diest PJ: BRCA promoter meth-ylation in sporadic versus BRCA germline mutation-related breast cancers. Breast Cancer Res 19: 64, 2017.
25. Neagu M, Constantin C, Tanase C and Boda D: Patented biomarker panels in early detection of cancer. Recent Pat Biomark 1: 10-24, 2011.
26. Mathelin C, Cromer A, Wendling C, Tomasetto C and Rio MC: Serum biomarkers for detection of breast cancers: A prospective study. Breast Cancer Res Treat 96: 83-90, 2006.
27. Atalay C and Kubilay D: The results of screening with SELDI-TOF-MS method in breast cancer diagnosis. J Breast Health 7: 106-108, 2011.
28. Stearns V, Yamauchi H and Hayes DF: Circulating tumor markers in breast cancer: Accepted utilities and novel prospects. Breast Cancer Res Treat 52: 239-259, 1998.
29. Gautam A, Verma S, Pantola C and Verma S: Utility of CA 15-3 as diagnostic and prognostic marker in breast cancer. IOSR-JDMS 14: 17-20, 2015.
30. Geng B, Liang MM, Ye XB and Zhao WY: Association of CA 15-3 and CEA with clinicopathological parameters in patients with metastatic breast cancer. Mol Clin Oncol 3: 232-236, 2015. 31. Zeidan BA, Cutress RI, Hastie C, Mirnezami AH, Packham G
and Townsend PA: SELDI-TOF-MS proteomics in breast cancer. Clin Proteomics 5: 133-147, 2009.
32. Yin P, Lehmann R and Xu G: Effects of pre‑analytical processes on blood samples used in metabolomics studies. Anal Bioanal Chem 407: 4879-4892, 2015.
33. Chandramouli K and Qian PY: Proteomics: Challenges, techniques and possibilities to overcome biological sample complexity. Hum Genomics Proteomics 2009: 239204, 2009. 34. Muthu M, Vimala A, Mendoza OH and Gopal J: Tracing the
voyage of SELDI-TOF-MS in cancer biomarker discovery and its current depreciation trend-need for resurrection? Trends Analyt Chem 76: 95-101, 2016.
![Figure 1. All-in-one peptide molecular mass standard for six peptides, including 1084.247-[arginine 8]-vasopressin, 1637.903-somatostatin, 2147.500-dynor- 2147.500-dynor-phin A, 2933.500-adrenocorticotropic hormone [1-24] human, 3495.941-insulin B-chain (b](https://thumb-eu.123doks.com/thumbv2/9libnet/5444217.104556/3.892.152.741.443.600/molecular-standard-peptides-including-arginine-vasopressin-somatostatin-adrenocorticotropic.webp)