Nihayet Fadime YALÇIN
Atatürk Üniversitesi Vet. Bil. Derg. 2016; 11(1): 22-31
Research Article/Araştırma Makalesi DOI:10.17094/avbd.41068
The Presence of Mycotoxin in Total Mixed Rations of Dairy Cattle in Konya
and the Surrounding Provinces*
Nihayet Fadime YALÇIN
1, Mehmet Kürşat IŞIK
2, Tülay AVCI
1, Halis OĞUZ
3,
Behiç COŞKUN
4, Emine ÇİFTCİ
11. Konya Veterinary Control Institute, Laboratory of Toxicology, Konya, TURKEY. 2. Konya Food and Agriculture University, Konya, TURKEY.
3. Selçuk University, Faculty of Veterinary Medicine, Department of Pharmacology and Toxicology, Konya, TURKEY.
4. Selçuk University, Faculty of Veterinary Medicine, Department of Animal Nutrition and Nutritional Diseases, Konya, TURKEY.
Abstract: In this study, it was aimed to determine the levels of mycotoxin contamination in total mixed rations (TMR) of dairy cattle in Konya and the surrounding provinces where 13.3% cattle production of Turkey takes place. For this purpose, a total of 74 ready-to-consume TMR samples from dairy cattle farms in Konya, Afyonkarahisar, Karaman, Aksaray, Nigde, Antalya, Isparta and Burdur provinces were collected. A general screening in dairy cattle feeds was performed in terms of mycotoxin presence and contamination levels. Samples were analysed for aflatoxin B1, ochratoxin A, zearalenone, T-2 toxin, HT-2 toxin, fumonisin and deoxynivalenol levels by LC-MS/MS multi-mycotoxin method. The levels of different mycotoxins in cattle feeds obtained from dairy cattle farms, the proportion of positive samples and the percentage of presence in the feeds were compared in terms of maximum residue limit. It was concluded that the feeds were found partially contaminated with mycotoxins in terms of mycotoxin types and levels in the regions screened. The exceeded rates were found 30% for aflatoxin B1 (≥5 ppb) and 3% for ochratoxin A (≥100 ppb) in TMR according to Official Gazette of the Republic of Turkey (2014/11). According to the exceeded levels, TMR and feedstuffs should be stored under more favourable conditions to avoid mycotoxin contamination.
Keywords: Dairy cattle, Multi-mycotoxin, Mycotoxins, Screening, Total mixed ration.
Konya ve Çevre illerdeki Süt Sığırlarının Toplam Karışık Rasyonlarında
Mikotoksin Varlığı
Öz
:
Bu çalışmada, Türkiye'nin sığır üretiminin %13.3'ünü oluşturan Konya ve çevre illerdeki süt sığır toplam karışık rasyonda (TMR) mikotoksin kontaminasyon düzeylerinin belirlenmesi amaçlandı. Bu amaçla, Konya, Afyonkarahisar, Karaman, Aksaray, Niğde, Antalya Isparta ve Burdur illeri süt sığır çiftliklerinden, tüketime hazır toplam 74 örnek toplandı. Süt sığır yemlerinin mikotoksin varlığı ve kirlenme düzeyi açısından genel taraması gerçekleştirildi. Örnekler, LC-MS/MS çoklu mikotoksin yöntemi ile aflatoksin B1, okratoksin A, zearalenon, T-2 toksin, HT-2 toksin, fumonisin ve deoksinivalenol düzeyleri analiz edildi. Süt sığırı çiftliklerinden alınan sığır yemlerinde farklı mikotoksin düzeyleri, pozitif örneklerin oranı ve yemlerdeki yüzde oranları, maksimum kalıntı limiti (MRL) açısından karşılaştırıldı. Taranan bölgedeki mikotoksin tip ve düzeyleri açısından yemlerin, mikotoksinlerle kısmen kontamine edildiği sonucuna varıldı. Türkiye'deki Resmi Gazete'ye göre (2014/11) TMR'da yasal limiti aşan aflatoksin B1 (≥5 ppb) % 30 ve okratoksin A (≥100 ppb) %3 olarak bulundu. Aşılan düzeylere göre, mikotoksin kontaminasyonunu önlemek için TMR ve yem hammaddeleri daha elverişli koşullarda saklanmalıdır.Anahtar Kelimeler: Süt sığırı, Çoklu mikotoksin, Mikotoksinler, Tarama, Toplam karışık rasyon.
Geliş Tarihi/Received 19.11.2015 Kabul Tarihi/Accepted 18.04.2016 Yayın Tarihi/Published 24.04.2016
INTRODUCTION
ycotoxins are a large group of toxins produced by moulds and they can be very toxic for animals, plants and humans (1). The toxic effects of mycotoxins are mainly on liver and they cause teratogenic, mutagenic, carcinogenic, cytotoxic, neurotoxic, nephrotoxic, oestrogenic and immunosuppressive effects (2, 3). Ruminants have generally been more resistant to the adverse effects of mycotoxins (4). Many mycotoxins are inactivated within the rumen by ruminal flora while others were passing through digestive tract either in the forms of unchanged or converted into metabolites that can sustain their biological activity (5). Therefore, the rumen itself significantly determines the sensitivity of dairy cattle to mycotoxin via its barrier function (5,6).
These toxins may show no clinical symptoms unless they are accompanied by secondary bacterial infections with high rate of mortality. In this case, determination of economic losses by the ingestion of contaminated feed is difficult in commercial livestock production (2). The larger problem is contaminated animal products that potentially threat the public health. Therefore, the toxin must be determined by analysis in feeds (7).
Pasture, grass, concentrated and preserved feeds that are forming ruminant mixed feed can be the source for many mycotoxins (5). Although there are some differences according to country and regions, most dangerous mycotoxins in dairy cattle feeds are aflatoxins (AFL) by Aspergillus, Ochratoxin A (OTA) produced by Penicillium and Aspergillus spp and Deoxynivalenole (DON), Zearalenone (ZEA), T-2 toxin and Fumonisin (FUM) produced by Fusarium (8,9). The AFL is a group of heterocyclic metabolites produced by storage fungi of the genus Aspergillus, particularly A. flavus and A. parasiticus. It has been a major concern as human hepatocarcinogens and as substances with potential deleterious effects on livestock health and productivity (7,10,11). The most important source of AFL is corn, peanut meal,
such as cereal grains, corn gluten, soy products, sunflower seeds, cotton seeds, palm kernel and dried coconut (12). The OTA is one of the important mycotoxin in feeds and feedstuffs and produced by Penicillium verrucosum, A. ochraceus and A. niger at low levels. This toxin is known as a nephrotoxic and found relatively in cooler climates and commonly in products of grains. It is converted quickly to ochratoxin α, a less toxic metabolite of OTA, by rumen microflora and thus, only a small amount of unchanged OTA is absorbed (13). The ZEA is a mycotoxin produced by Fusarium and its chemical structure resembling oestrogens has oestrogenic effect in animals (9). It is mainly (90%) converted to α-zaeralenone, a hydroxy metabolite of ZEA, and β-zaeralenone at lower rates by rumen microflora (14). The FUMs (FUM B1 and FUM B2) are produced by Fusarium species, especially F.moniliforme and F. proliferatum species. The FUMB1 is reported to be more toxic in monogastric animals and sheep (15). Trichothecenes (T-2 and HT-2 toxins) are secondary metabolites of Fusarium, Stachybotrys, Trichothecium, Kerticimosporium, Cephalosporium and Cylindrocarpen. The DON is one of the most common mycotoxins in foods and feeds (9). The vast majority is degraded by the rumen flora to the lower toxic DOM, a deoxidised metabolite of DON, thus indicating the ultimate low toxicity of the mycotoxin (5).
In this study, it was aimed to determine the contamination of mycotoxins having toxicological and economical importance in total mixed rations (TMR) of cattle in Konya and the surrounding provinces. Mycotoxin analyses are usually performed by chromatographic methods (TLC, HPLC, and LC/MS). However, in recent years, rapid development of the LC-MS/MS system has enabled us to take the multi-mycotoxin residues analyses (11). Performing a multi-mycotoxin screening by LC-MS/MS method and the lack of similar studies with HT-2 detection in the literature apparently shows the
MATERIALS and METHODS
Sampling
Feed samples, which are ready-to-consume, were collected from dairy cattle farms (50-100 animals) in Konya, Afyonkarahisar, Karaman, Aksaray, Nigde, Antalya, Isparta and Burdur provinces where 13.3% cattle production of Turkey takes place (Figure 1). This study was carried out during March and June 2014. Total Mixed Ration feed sample (TMR), dry and wet roughage (hay, barley, alfalfa, silage, cottonseed meal) with concentrated feed (dairy feed), consisting the rations that should be taken in a daily ration. Two kg of TMR were obtained from different points of feed batch in order to represent the masses when the feeds were being distributed to animals. The numbers of collected samples were determined according to the animal production data obtained from the TURKVET (16). Totally, 74 samples were collected and taken in dark plastic bags, brought to the laboratory after being wrapped with the stretch film under cold conditions.
Sample Preparation and Clean-up Procedures
Homogenisation and extraction were performed for each of feed samples according to the method ZV-1030-500-55 LC-MS/MS (17). This method is used for food control laboratories in İzmir Province. Reagent-1, a solution of ZV-1030-0200-55 LC-MS/MS analysis set, was added into five g of sample and vortexed for 30 sec. Then Reagent-2 was added and also mixed for two min, and then centrifuged for five min at 4.000 rpm. Five ml was taken from the upper phase and transferred into a
tube and evaporated under nitrogen. Then, Reagent-3 was added into the tube, solved and filtrated through a 0,45 µm filter and put into LC-MS/MS. Reagents (R1, R2 and R3) were obtained from Zivak Technologies in Turkey.
Analyses
Feed samples were analysed for AFL B1, OTA, ZEA, T-2 Toxin, HT 2 toxin, FUM and DON levels by LC-MS/MS multi-mycotoxin method. The device analyses were performed in food control laboratory directorate in İzmir. Analysis was performed by LC-MS/MS (Zivak, 1034-02MA-Mobil Phase A, ZV-1034-02MB-Mobil Phase B, 1800 V detector, 0.20 mL/min, ZV-1034-02C1 150x2 mm, HPLC Column, 50 psi API Nebulising gas pressure, 350 ºC drying gas temperature, 35 psi drying gas pressure, 0,5 min scanning time). Validation parameters were used as performance criteria for method validation (18). Validation parameters assessed were, linearity, recovery, limit of detection (LOD), limit of quantification (LOQ), repeatability (intra-day precision; RSDr), reproducibility (inter-day precision; RSDR) and specificity (Table 1). The multi-mycotoxin analytical method optimised for TMR was validated using spiked blank sample. The validation experiments used to calculate the LODs and LOQs were also utilised to calculate the recovery of the method. Recovery was carried out by spiked samples at three different levels, by repeating 6 times for each level in different days. Calculation of LOD and LOQ ;
LOD = 3 X Standard Deviation LOQ= 10 X Standard Deviation
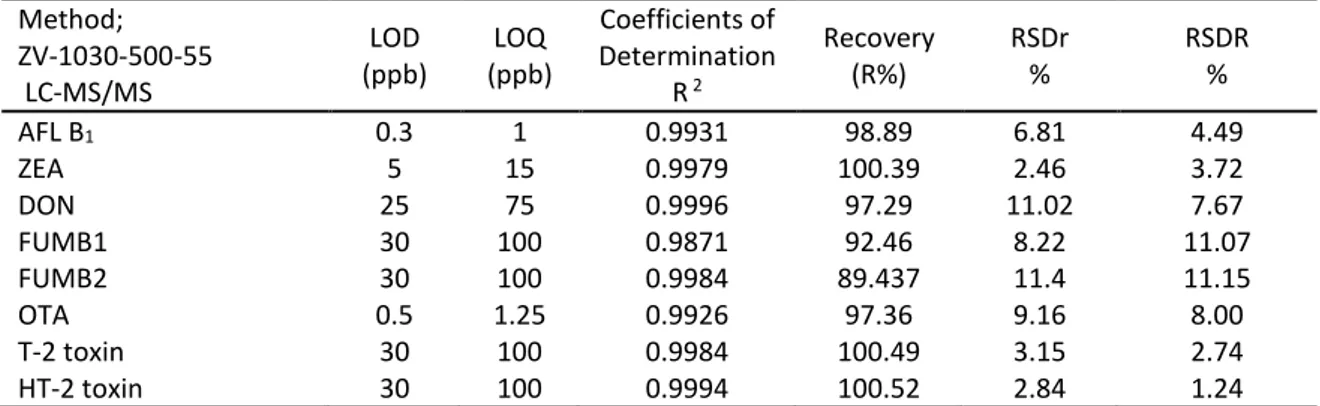
Table 1. Validation data obtained in an average of three different concentrations for each mycotoxin.
Tablo 1. Her bir mikotoksin için üç farklı konsantrasyonda elde edilen validasyon verileri.
Method; ZV-1030-500-55 LC-MS/MS LOD (ppb) LOQ (ppb) Coefficients of Determination R 2 Recovery (R%) RSDr % RSDR % AFL B1 ZEA DON FUMB1 FUMB2 OTA T-2 toxin HT-2 toxin 0.3 5 25 30 30 0.5 30 30 1 15 75 100 100 1.25 100 100 0.9931 0.9979 0.9996 0.9871 0.9984 0.9926 0.9984 0.9994 98.89 100.39 97.29 92.46 89.437 97.36 100.49 100.52 6.81 2.46 11.02 8.22 11.4 9.16 3.15 2.84 4.49 3.72 7.67 11.07 11.15 8.00 2.74 1.24 LOQ: Limit of quantification LOD: Limit of detection RSDR: Reproducibility, RSDr: Repeatability, AFLB1: Aflatoxin B1 ZEA: Zearalenon DON: Deoxynivalenol FUM: Fumonisin OTA:
Ochratoxin A.
Linearity was evaluated using matrix matched calibration curves, by spiking blank samples at six concentrations for TMR. For specificity, TMR samples, which known no multi-mycotoxin contained, were analysed; and no deviation was observed in the time of peak output when the standards added. Both repeatability and reproducibility were carried out by spiked samples at six different levels in different days. The levels of different mycotoxins in cattle feeds obtained from cattle farms, the proportion of positive samples, the percentage of presence in the feeds and the
exceeded rates according to RG (2014/11) were compared in terms of maximum residue limit (MRL) values (19).
RESULTS
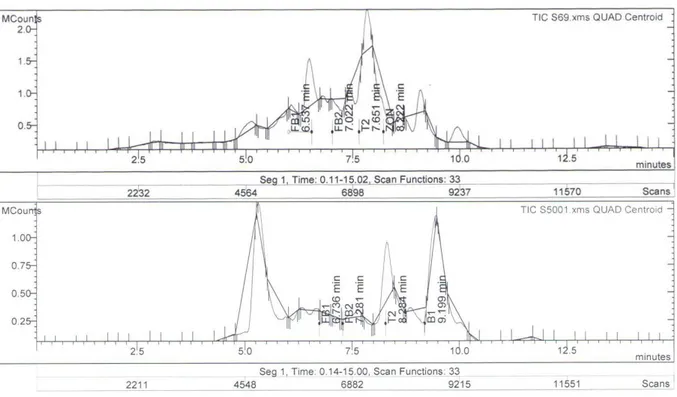
In this study, mycotoxin contaminations were investigated in TMR of cattle collected from cattle farms in Konya and the surrounding provinces (Figure 1). Samples were analysed for AFL B1, OTA, ZEA, T-2 Toxin, HT 2 toxin, FUM and DON levels by LC-MS/MS multi-mycotoxin method (Figure 2).
Figure 1. Provinces and the numbers of cattle where the samples were collected (20).
Şekil 1. Numunelerin toplandığı iller ve sığır sayıları (20).
Konya : 669.140 Afyonkarahisar : 332.621 Burdur : 198.346 Aksaray : 173.530 Antalya : 159.192 Isparta : 141.156 Niğde : 140.760 Karaman : 62.344 Total Provinces : 1.877.089 Total in Turkey : 14.122.847
Most common mycotoxin was FUM (B1+B2) in the region (93.24%) according to the results of analyses (Figure 3). The presence rates were AFL B1
(58.11%), OTA (31.08%), ZEA (21.62%), and DON (4.05%) (Table 2).
Figure 2. Examples of multi- mycotoxin analysis chromatograms of the samples. Şekil 2. Numunelere ait çoklu mikotoksin analiz kromatogramlarından örnekler.
Figure 3. Mycotoxin presence in Total Mixed Feed (TMR) in the provinces.
Şekil 3. İllerdeki toplam karışık rasyondaki mikotoksin varlığı.
FUM (B1+B2) was detected in all samples (100%) from five provinces (Burdur, Niğde, Afyonkarahisar, Aksaray and Antalya). The AFL B1 was detected 7
(75%) of 9 samples in Aksaray, whereas OTA was found 6 (62%) of 8 samples in Afyonkarahisar (Table 2).
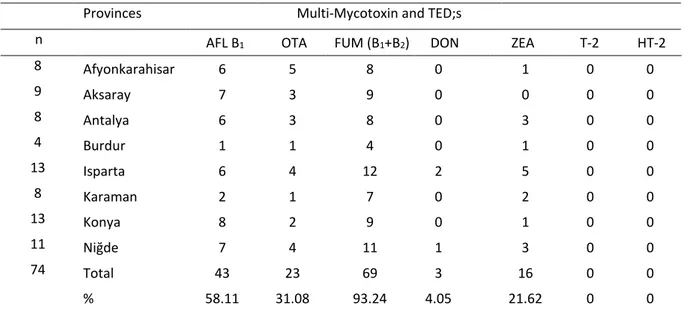
Table 2. Mycotoxin prevalence in Total Mixed Feed (TMR) according to the provinces.
Tablo 2. İllere göre toplam karışık rasyondaki (TMR) mikotoksin yaygınlığı.
Provinces Multi-Mycotoxin and TED;s
n AFL B1 OTA FUM (B1+B2) DON ZEA T-2 HT-2
8 Afyonkarahisar 6 5 8 0 1 0 0 9 Aksaray 7 3 9 0 0 0 0 8 Antalya 6 3 8 0 3 0 0 4 Burdur 1 1 4 0 1 0 0 13 Isparta 6 4 12 2 5 0 0 8 Karaman 2 1 7 0 2 0 0 13 Konya 8 2 9 0 1 0 0 11 Niğde 7 4 11 1 3 0 0 74 Total 43 23 69 3 16 0 0 % 58.11 31.08 93.24 4.05 21.62 0 0
n; Number of samples, TED;s: The number of samples which had detectable levels in LC MS/MS. Among the mycotoxins analysed, only the AFL B1 and OTA levels were found to be exceeding the MRL according to the RG (2014/11)(19) (Table 3). Thirty-two samples (42%) were found negative for the AFL B1; 21 samples (28%) were between zero and 5 ppb; and 22 samples (30%) were up to 5 ppb in the total of 74 TMR samples. Only two samples (3%) were
found to be exceeding the MRL for the OTA in 23 positive samples (31.08%). Twenty-one (97%) samples were proper for using as compared to other toxin contamination levels according to RG (2014/11) (19) (Table 2). No MRL was given for T-2 and HT-2 toxin in RG (2014/11). T-2 and HT-2 toxins were found at undetectable levels.
Table 3. The percentage of exceeding mycotoxin levels in samples according to RG 2014/11 (19). Tablo 3. RG (2014/11)'e göre, numunelerde mikotoksin seviyelerinin aşılma yüzdeleri (19).
MYCOTOXINS Maximum detected level
(ppm)
Maximum residue limit
(MRL) nx % AFLATOXIN B1 0.04 0.005 ppm 22 30 OCHRATOXIN A 0.344 0.1 ppm 2 3 FUMONISIN (B1+B2) 1.208 50 ppm 0 0 ZEARALENONE (ZEA) 0.031 0.5 ppm 0 0 DEOXYLIVALENOL (DON) 0.045 2 ppm 0 0
T-2 TOXIN ND No permitted levels - 0
DISCUSSION and CONCLUSION
In this study, the most common mycotoxin was FUM (B1+B2; 93.24%) in the results of multiple mycotoxins analyses for the presence of AFL B1, OTA, ZEA, FUM, DON, T-2 and HT-2 toxin performed in the TMR collected from cattle farms in eight provinces. The FUM concentrations vary in feed according to season (21), corn, and corn-containing foods that are widely available throughout the world (22). Demir (23) identified 94% F.moniliforme contamination in 100 corn samples and the FUMB1 was found in 52 samples while the FUM B2 was found in 25 samples in Samsun region. Ekici et al. (24) analysed the AFLB1, OTA, and total FUM in the 88 commercially mixed ruminant feed obtained from feed from Ankara, Kırıkkale, Çankırı, Çorum, and Kırşehir provinces by ELISA and HPLC methods. Total of AFL and AFLB1 (81.81%), OTA (95.45%), and total FUM (94.31%) were detected in the samples. All the levels analysed feed samples were found to be below the values permitted by the Republic of Turkey’s Ministry of Food, Agriculture and Livestock. Binder et al. (25) reported that the DON, ZEA and T-2 toxin were major contaminants in the feeds in European region, while the DON, ZEA, FUM and AFL were common in Asian and the Pacific regions. According to the present research, the FUM and AFL B1 constitute the majority of the contamination in cattle feed in this region. Although our results are similar to this study in terms of FUM prevalence, the FUM levels obtained in the samples were found to be below the MRL.
Bilal et al. (26) investigated the rates of AFL, ZEA and DON in 106 samples (30 feeds and 76 feedstuffs) by HPLC method. For feedstuff samples, they reported that the incident rates were 26.32, 31.58 and 18.42% for AFL B1, ZEA and DON, respectively. Kocasari et al. (27) analysed total AFL, OTA, T-2 toxin, DON, ZEA and FUM contamination in feeds of cattle and sheep by ELISA in Burdur province. The most frequently detected mycotoxins were found to be total AFL by 60%, while others were the DON, OTA, ZEA and FUM, respectively. Oruc et al.(28), investigating the AFL B1, T-2 toxin, FUM, DON and ZEA
levels in feed and feedstuffs by ELISA method, found that the mycotoxin contamination, except the FUM, werelower in the samples produced in Turkey than in those samples imported. They also noted that the amounts of mycotoxins in feeds and feedstuffs were below the MRL applied by Turkey and EU. Oguz et al. (29) surveyed the AFLB1 in 150 mixed feed in Konya, Karaman and Mersin regions by TLC-Scanner methods. Three samples from Konya region were found as having 1 ppb while one sample from Mersin province was found as having 0.5 ppb AFLB1 contamination. These levels were found to be below maximum permissible levels in Turkey. In the present study, the AFL levels were lower than the MRL (5 ppb) at 70% and this result is consistent with other studies given above.
Akkaya and Bal (30) analysed beef and dairy cattle feeds by HPLC, and they found that the AFL levels were higher than the permissible level (5 ppb) of RG (2014/11) (19) and European Food Safety Authority (2011) (32), while the OTA levels were lower than the legal limits concerned. Li et al. (31) also analysed feed and feedstuffs of swine by HPLC (FLD/UV) methods in Beijing Region of China and found that the DON was most common mycotoxin, as followed by the AFLB1 and ZEA, respectively. The difference between the two studies might have been originated from feed types and regional differences. By surveying the studies (2001-2004) made by ELISA, it was reported that the OTA contamination was at the rate 80.65% in Turkey (32). However, the same contamination was found at 31.08% in the present study. Herein, the exceeding rates were found 30% for the AFL B1 (≥5 ppb) and 3% for the OTA (≥100 ppb) in TMR according to RG (2014/11). Other toxin levels were found to be lower when compared to the MRL in the RG (2014/11) (19).
Polat and Aksu (33) investigated the AFLB1 and total AFL levels of roughages and concentrated feed samples from 20 dairy farms in Hatay by HPLC method. The concentrates of 9 farms were found to be above 5 ppb legal limit while none of the roughage samples the AFLB1 levels was over 5 ppb. Nizamlioglu
and Oguz (34), analysing the AFL in 72 feed and corn samples in Konya region by ELISA method and they found total AFL was 71.1% in the samples. Total AFL levels were lower than 5 ppb 50% of positive samples. Polat and Gul (35) analysed total AFL and the AFLB1 in roughage, concentrates and compound feed from 11 dairy farms located in Erzurum province by ELISA method. They reported that total AFL and AFLB1 levels in feed samples were higher in spring and summer, as compared to those in autumn and winter. Further, Dogan and Bayezit (36), analysed the AFL in 100 feed samples in Kars region by ELISA method and it was found that 70% of feed, as being 8% higher than 10 ppb. In this case, although the level of detected AFL was found similar to those in other studies in terms of feed contamination, it can be presumed that the differences might be due to different methods used in different studies.
Thirteen countries determined the MRL for T-2 and HT-2 toxins in food and feeds around the world (EFSA, 2011) (37). According to this, maximum tolerable levels reported to be 100 ppb in Iran, 250 ppb in Ukraine for T-2 toxin and 100 ppb in Canada for HT-2 toxin in terms of cattle feeds (38). In this study, T-2 and HT-2 toxin were found at undetectable levels and it is understood that these levels could not affect the public and animal health when compared to the permissible levels in other countries. The differences and prevalence of mycotoxin levels between our results and other studies performed by other researchers in cattle feed might be due to the differences of feed contents, regional circumstances and/or analysis methods applied.
As a result, it is clearly seen herein that the prevention of mycotoxin production is very important in terms of animal and public health based on the mycotoxin contamination exceeding legal limits. Hence, it should be careful for supplying feedstuffs during the storage and consumption in terms of toxin production, especially in dairy cattle farms.
REFERENCES
1. Atanda SA., Pessu PO., Agoda S., Isong IU., Adekalu OA., Echendu MA., Falade TC., 2011. Fungi and mycotoxins in stored foods. African Journal of Microbiology Research, 5, 4373-4382. 2. Oguz H., 2011. A review from experimental trials
on detoxification of aflatoxin in poultry feed. Eurasian Journal Veterinary Science, 27, 1-12. 3. Abrunhosa L., Moraless H., Soares C., Calado T.,
Vila-Chã AS., Martinha P., Venâncio A., 2014. Review of mycotoxins in food and feed products in Portugal and estimation of probable daily intakes. Critical Reviews in Food Science and Nutrition, 6.
4. Zain ME., 2011. Impact of mycotoxins on humans and animals. Journal of Saudi Chemical Society, 15, 129-144.
5. Fink-Gremmels J., 2008. Mycotoxins in cattle feeds and carry-over to dairy milk: A review. Food Additives and Contaminants, 25, 172-180. 6. Hussein HS., Brasel JM., 2001. Toxicity,
metabolism, and impact of mycotoxins on humans and animals. Toxicology, 167, 101-134. 7. Dalvi RR., Ademoyero AA., 1984.Toxic effects of
aflatoksin B1 in chickens given feed contained Aspergillus Flavus and reduction of the toxicity by activated charcoal and some chemical agents. Avian Disease, 28, 61.
8. Kaya S., 2002. Mikotoksinler. In "Veteriner Hekimliğinde Toksikoloji", Ed., Kaya S, Pirinçci İ., BilgiliA., 2 nd ed., 537-574, Medisan Yayın, Ankara.
9. Cankiri B., Uyarlar C., 2013. Mikotoksinlerin süt sığırlarının beslenmesindeki yeri ve önemi. Kocatepe Veteriner Dergisi, 6, 57-69.
10. Oguz H., Kurtoglu V,. 2000. Effect of clinoptilolite on fattening performance of broiler chickens during experimental aflatoxicosis. British Poultry Science, 41,512-517.
11. Tiryaki O., Seçer E., Temur C,. 2011. Yemlerde mikotoksin oluşumu, toksisiteleri ve mikotoksin
kalıntı analizleri. Anadolu Journal of Agricultural Research Institute, 1, 44-58.
12. Placinta CM., d’Mello JPF., MacDonald EK., 1999. A review of worldwide contamination of animal feed with fusarium mycotoxins. Animal Feed Science and Technology, 78, 21-23.
13. Hult K., Teiling A., Gatenbeck S., 1976. Degradation of ochratoxin a by a ruminant. Applied and Environmental Microbiology, 32, 443-444.
14. Kennedy DG., Hewitt SA., McEvoy JDG., CurrieJW., CannavanA., Blanchflower WJ., Elliot CT., 1998. Zeranol is formed from Fusarium spp. toxins in cattle in vivo. Food Additives and Contaminants, 15, 393-400.
15. Kriek NPJ., Kellerman TS., Marasas WFO., 1981. A comparitive study of the toxicity of Fusarium Verticilloides (F. moniliforme) to horses, primates, pigs, sheep, and rats. Onderstepoort Journal Veterinary Research, 48, 129-131.
16. TURKVET. 2015. Türkvet Veteriner Bilgi Sistemi. 17. TMB, Teşhiste Metot Birliği. 2014. Farmakoloji ve
Toksikoloji (in Turkish). Hayvansal doku, yem ve yem hammaddelerinde aflatoksin ve okratoksinin LC-MS/MS ile analizi metodu.
18. EURACHEM Guide., 2014. The Fitness for Purpose Analytical Methods, A Laboratory Guide to Method Validation and Related Topics. 2nd edition.
19. RG., 2014. Resmi Gazete 2014/11 (in Turkish). Veteriner Hizmetleri, Bitki Sağlığı, Gıda ve Yem Kanunu. Yemlerde İstenmeyen Maddeler Tebliği. 28977.
20. TUIK (2014). Turkish Statistical Institute. Haber Bulteni. Sayı: 18851.
21. Dogan A., Tuzcu M., 2001. Fumonisinler. Kafkas Üniversitesi Veteriner Fakültesi Dergisi, 7, 237-244.
22. Abdel-Wahhab MA., Hassan AM., Amer HA., Naguib KM., 2004. Prevention of Fumonisin-Induced Maternal and developmental toxicity in rats by certain plant extracts. Journal of Applied Toxicology, 24, 469.
23. Demir C., 2002. Samsun ve civarında yetiştirilen mısırlarda Fusarium moniliforme ve Fumonisin B1, B2 varlığı üzerinde bir araştırma. Trakya Üniversitesi Fen Bilimleri Enstitüsü, Turkiye. 24. Ekici H., Yıldırım E., Yarsan E., 2016. The effect of
seasonal variations on the occurrence of certain mycotoxins in concentrate feeds for cattle collected from some provinces in Turkey. Turkish Journal of Veterinary and Animal Sciences, 40. doi:10.3906/vet-1501.
25. Binder EM., Tan LM., Chin LJ., Handl J., Richard J., 2007. Worldwide occurrence of mycotoxins in commodities feeds and feed ingredients. Animal Feed Science and Technology, 137, 265-282. 26. Bilal T., Aksakal DH., Sünnetci S., Keser O., Eseceli
H., 2014. Detection of aflatoxin, zearalenone and deoxynivalenol in some feed and feedstuffs in Turkey. Pakistan Veterinary Journal, 34, 459-463. 27. Kocasari FS., Mor F., Oguz MN., Oguz FK., 2013. Occurrence of mycotoxins in feed samples in Burdur province, Turkey. Environmental Monitoring and Assessment, 185, 4943-4949. 28. Oruc HH., Sorucu A., Türkmen İİ., Arslan E., 2012.
Determination of various mycotoxin concentrations in the feedstuffs and feed produced by a feed manufacturer in Turkey. Kafkas University Journal of Faculty Veterinary Medicine, 18, 633-638.
29. Oğuz H., Nizamlıoğlu F., Dinç İ., Üney K., Aydın H., 2011. Determination of aflatoxin existence in mixed feed, wheat flour and bulgur samples. Eurasian Journal of Veterinary Sciences, 27, 171-175.
30. Akkaya MR., Bal MA., 2013. Regional distribution of aflatoxin and ochratoxin a contaminated beef and dairy cattle feeds in Turkey. Animal Health Production and Hygine, 2, 162-166.
31. Li X., Zhao L., Fan Y., Jia Y., Sun L., Ma S., Ji C., Ma Q., Zhang J., 2014. Occurrence of mycotoxins in feed ingredients and complete feeds obtained from the Beijing region of China. Journal of Animal Science and Biotechnology, 5, 37.
32. Yıldız G., 2009. Türkiye’de çeşitli hayvancılık işletmelerinde kullanılan karma yemlerin ve yem hammaddelerinin OTA kirliliği yönünden İncelenmesi. Ankara Üniversitesi Veteriner Fakültesi Dergisi, 56, 131-135.
33. Polat F., Aksu T., 2015.Determination of aflatoxin levels of feeds used in dairy cow farms and their effects on blood parameters and milk aflatoxin levels in Hatay province. Atatürk Üniversitesi Veteriner Bilimleri Dergisi, 10, 146-155.
34. Nizamlioglu F., Oguz H., 2003. Occurrence of aflatoxins in layer feed and corn samples in Konya province, Turkey. Food Additives and Contaminants, 20, 654-658.
35. Polat N., Gül M., 2014. Aflatoxin levels in roughage, concentrates, compound feed and milk samples from dairy farms in Erzurum province. Atatürk Üniversitesi Veteriner Bilimleri Dergisi 9, 149-156.
36. Dogan A., Bayezit M., 1999. Kafkas yöresinde yemlerde aflatoksin B1 düzeyinin ELISA yöntemi ile araştırılması. Kafkas Üniversitesi Veteriner Fakültesi Dergisi, 5, 63-70.
37. European Food Safety Authority (EFSA). 2011. Scientific opinion on the risks for animal and public health related to the presence of T-2 and HT-2 toxin in food and feed. EFSA Panel on Contaminants in the Food Chain (CONTAM). EFSA Journal, 9, 2481.
38. FAO (Food and Agriculture Organization). 2004. Worldwide regulations for mycotoxins in food and feed in 2003. FAO Food and Nutrition Paper, 81.