Relationships Between Measured Levels and
Subjective Ratings:
A Case Study of the Food-Court Area in CEPA
Shopping Center, Ankara
Papatya Nur Dökmeci
a,*, Semiha Yılmazer
aaDepartment of Interior Architecture and Environmental Design,
Bilkent University, 06800, Ankara, Turkey
(Received 18 January 2011 and accepted 14 December 2011)
ABSTRACT
Physical comfort requirements of users; such as, thermal, visual, and acoustic comfort, should be considered and studied in detail when planning and designing public spaces. However, there is not enough research on the relations between the acoustical parameters, and the acoustic comfort level of users in enclosed non-acoustic public spaces, which are directly connected with a central atrium. In such spaces, evaluation on auditory perception and noise annoyance should be performed in parallel with objective parametric measurements. The food-court area of CEPA Shopping Center, with a central atrium and a glass ceiling structure, in the capital city of Turkey, Ankara is chosen for the case. The aim of this study is to investigate the relationships between the users’ subjective ratings of noise levels and the measured equivalent continuous sound pressure levels (Leq). In addition, the demographical differences and user profile variances, as well as the auditory perception classifications are investigated in this case space. The present acoustical indices are measured and then discussed by pointing out the architectural features of the case space, which are the central atrium, glass ceiling structure and the sound reflective material applications. The research methods include, noise measurements to obtain Leq and questionnaires to assess the subjective ratings and auditory perception of the users. This study mainly concentrates on the food-court space, which is within CEPA Shopping Center and displays the significant results regarding this space. These results show that Leq values vary by different day types (weekdays and weekends) and time of day, and the subjective ratings correlate well with these Leq variances. The most dominant sound perceived by the users was found to be the hum of voices. One other significant result implies that, subjective ratings of noise level becomes significant above 67 dBA and shows a sudden increase in the ratings. Furthermore, the time spent in the food-court area correlated significantly with noise annoyance ratings.
Keywords: noise annoyance; auditory perception, food-court areas
* Corresponding author. Add.:Acoustics Group, School of Architecture, University of Sheffield, Western Bank, Sheffield, S10 2TN, UK; Tel.: +44 7786241065
1. INTRODUCTION
Designing public spaces is an important field that should be studied in detail, by considering every variable. Thermal, visual, and acoustic comfort, are some basic requirements regarding the physical comfort of users, and should be included when planning an enclosed, semi-enclosed or open space [1]. Previous studies concentrate mainly on the objective characteristics and on the acoustical formations in open/urban spaces [2] however; there are few studies in the literature on enclosed ‘non-acoustic’ public spaces. Studies focusing on the relations and correlations between objective acoustical parameters and subjective ratings need more attention [3]. Furthermore, the auditory perception and noise annoyance should be studied in accordance with the objective indices within enclosures.
Enclosed areas such as shopping centers, food courts, dining spaces or other leisure venues are important examples for such ‘non-acoustic’ public spaces that require further consideration [4, 5]. Low ambient noise, low sound pressure levels, and appropriate reverberation time are crucial for high acoustic comfort in these spaces. In addition to objective parameters; loudness, annoyance, reverberation and noisiness are some other basic subjective criteria that should also be studied in such public spaces. In this respect, studies indicating the relations between objective and subjective parameters are lacking in the literature [6].
Other important aspects to consider are the architectural features and design elements in enclosures, which have significant effects on distinctive acoustical formations [7]. Architects and designers should not forget that the discipline of architecture is not only visually perceptible; there are many other criteria for a space to be, well appreciated and physically comfortable. Some architectural elements like atriums and glass ceiling structures are used commonly in public enclosures. In such examples, either architectural elements or decisions may lead to malign acoustical formations; or the function, and the usage of the space may create disturbing environments for the users. Consequently, enclosed environments should be carefully designed with the inclusion of the necessary acoustical remedies. Articles regarding atriums and their acoustical characteristics have gained momentum in recent years. Comparative studies of Bradley [8], Chen [5] and Mahdavi [9, 10] are examples concentrating on the acoustical attributes of atriums in buildings with varied functions.
The basic consideration of this study is to reveal the relationship between the acoustical attributes and auditory perception of the users with respect to the architectural and spatial properties of the food-court space in CEPA Shopping Center, Ankara. Thus, the aim of this study is to set out the relationship between the users’ subjective ratings of noise levels and the measured equivalent continuous sound pressure levels (Leq). The demographical differences such as, age and education, as well as space utilization and auditory perception variances, are discussed with respect to the users’ noise annoyance ratings. Measurement results are considered to identify the acoustical characteristics of an architectural space with a central atrium, glass ceiling structure and sound reflecting materials.
It is hypothesized that the mean Leq values correlate well with the subjective evaluation of the sound level (noisiness), and that users are able to perceive the Leq
variances during the different times of the day (noon, afternoon and evening) in the food-court space. Moreover, certain associations and correlations between demographics and space utilization by the users’ are considered to be significant regarding their auditory perception, and noise annoyance.
2. METHODOLOGY
Two different assessment tools were considered for the study. Noise measurements were carried out by Bruel & Kjaer type 2230 sound level meter to measure the equivalent continuous sound pressure level (Leq). The ‘auditory perception and noise annoyance’ questionnaires were structured not only for evaluating the noise annoyance ratings of the users but also for providing information on user demographics and space utilization characteristics; which may affect their auditory perception. Cross-comparisons between the results of these two different methods and their relations with each other were evaluated by parametric tests such as; Pearson’s correlation.
2.1. Noise Measurements
The noise measurements were done in the third floor where the food-court area is located. Measurements were performed in two different day types; weekdays and weekends. Two different day types were chosen to sample coherent representation of the space including the varied sound environment and sources depending on the usage and function during the opening hours. Each day type had been divided into four intervals according to the times of the day as; morning (10:00-12:00), noon (12:00-14:00), afternoon (16:00-18:00), and evening (20:00-22:00). Measurements were conducted during a 12-hour usage period of the space between 10:00 to 22:00, at three identified locations for each different time interval.
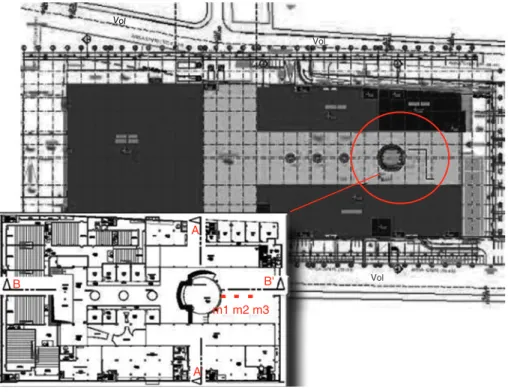
The first measurement point was set near the atrium at the symmetry axis of the space. The second measurement point was located 10 meters away from the atrium at the same axis and the third point, 20 meters away from the atrium on the same axis (in Figure 1). The measurement points were chosen as the estimated points of the receivers, when the effect of overall sound propagation was considered. This approach has also been noted in related guidelines [11]. Twenty-one measurements were accomplished for each day type (weekdays and weekends) for determining the Leq values. The measurements were carried in several points as suggested in the WHO Guidelines for community noise (1999), for indoor spaces in order to better characterize the sound environment in the space [11]. All Leq values were obtained by one-minute averaged measurement technique. The microphones were positioned at least 1.5 meters away from all the reflecting surfaces.
2.2. Questionnaire
A survey entitled, ‘acoustic comfort and noise management’ including twenty questions was prepared by in-depth examination and consideration of the previously recognized noise annoyance ratings. Although the referenced ISO standard [12] states its limited use for "noise annoyance at home", this standard forms the backbone one of the questionnaire. The suggested question formats were used and structured in accordance
with, Likert scaling (5-point scale), closed-ended (dichotomous, nominal-polytomous, ordinal-polytomous) and open-ended questions [13]. The survey was designed as a structured interview in Turkish language with four main sections; (1) demographics, (2) evaluation and auditory perception in CEPA, (3) evaluation and auditory perception in food-court, (4) acoustical comfort and noise annoyance ratings. The ‘acoustic comfort and noise management’ survey used in this study was designed in Turkish language for this case study.
2.3. The Case: CEPA Shopping Center
CEPA Shopping Center is one of the most widely used public space in Ankara. It is located near one of the main highways in the city, situated across from a big university. The shopping center is very central and has a diverse range of shops which allows for a broad range of users.
CEPA Shopping Center is designed with an atrium at the entrance level, which connects all four floors with each other. The spaces with different functions such as; the movie theatre, the food-court and the shops are located separately from each other. All these spaces have unified, yet distinct localizations. The overall plan is rectangular and is designed to have two different circulation axes, which are linked to each other at the
Vol Vol Vol A B B' A' m1 m2 m3
Figure 1. CEPA Shopping Center; site plan and focused food court plan showing the Leq measurement points.
beginning and at the end of the circulation paths. The food-court area, which was considered for this study is located on the third (3rd) floor. The total volume of the shopping center is 496,000 m3with a height of 40 meters, a width of 80 meters and a
length of 155 meters.
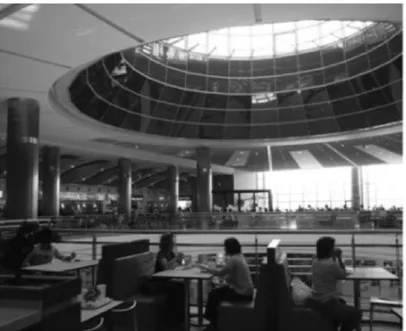
The food-court area is the circular semi-detached space that is surrounded by various restaurants and cafes at the sides and a glass ceiling structure above. The considered volume of the food-court area is approximately 30,000 m3. The atrium is located in the
middle of the space with a circular opening, which provides visual and audile connection with the overall shopping area (in Figure 2, 3).
In CEPA Shopping Center, no significant interventions have been carried out with respect to the material selection or application to obtain better acoustical conditions. The dominating materials in the space are; large panes of glass used on the glass ceiling structure, wide glass shop cases, granite for the finishing material on floors and aluminum cladding on columns, which tend to act as reflectors for certain frequencies, leading high reverberation and low attenuation in the space. (in Figure 4).
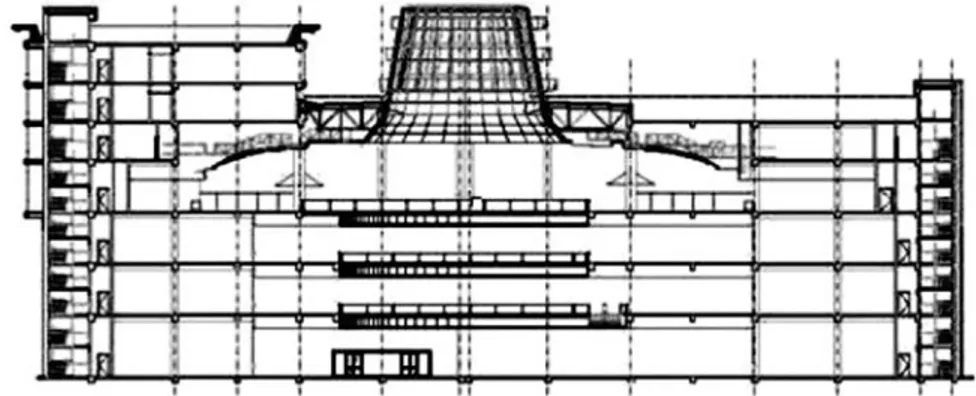
Figure. 2. Cross-section (AA’) of CEPA Shopping Center.
3. RESULTS
3.1. Equivalent Continuous Sound Pressure Level (Leq) Measurements
Background noise was measured in the food court space during the unoccupied hours. The Leq value of the empty space was found to be 44 dBA. The Leq variations for different times during the weekdays and the weekends are noted in Figure 5. The total Leq mean value for the weekdays was measured to be 63.5 dBA, whereas, the mean Leq value measured at the weekends was 68.3 dBA, which was approximately 5 dBA higher than that of the weekday mean Leq value (in Table 1).
75 70 65 Leq (dBA) 60 10:00 Atrium 57 64.8 Leq-WD Leq-WE 10:00 A+10m 57.6 65.5 10:00 A+20m 59.2 65 12:00 Atrium 60.8 67.7 12:00 A+10m 61.4 68.3 12:00 A+20m 62.2 67.9 14:00 Atrium 66.3 68.6 14:00 A+10m 65.1 71.6 14:00 A+20m 64.2 71.3 16:00 Atrium 65.1 71.5 16:00 A+10m 64.7 72.3 16:00 A+20m 63.9 70.7 18:00 Atrium 64.2 70.5 18:00 A+10m 65.9 69.3 18:00 A+20m 64.8 71 20:00 Atrium 65.5 68.4 20:00 A+10m 68.8 68.4 20:00 A+20m 70.2 66.4 22:00 Atrium 64.8 65 22:00 A+10m 62.2 66.2 22:00 A+20m 60.8 64.2 55
Figure 4. Third floor food court area in CEPA Shopping Center.
Figure 5. Measured Leq values for the weekends (WE) and the weekdays (WD) of different hours and locations.
The overall measurements showed that there tends to be Leq peaks especially during lunch (12:00-14:00) and dinner (18:00-20:00) hours at the weekdays, whereas at the weekends, the highest Leq values were obtained all through the afternoon hours. Leq peaks were rather non-relevant for the assessment of weekend hours. The only overlap occurred during dinner hours. The weekday Leq values were at peak during dinner hours in a dramatic way. In contrast, the weekend dinner Leq values showed noticeable decrease. For both day types, opening and closing hours displayed the lowest Leq values when compared to other time intervals of the day (in Figure 5).
3.2. Questionnaire Results
Data was obtained from a random sample group of 240 people, from the population utilizing the space. This sample group consisted of 128 males and 112 females without any known hearing impairment or problem. A high rate of collaboration between the participants who were asked to complete the questionnaire had been noted. The users were grouped into four, according to their education level (primary school grads n: 10, high school grads n: 40, university grads n: 152, master’s- PhD grads or students n: 38). There were three age groups as, 20-35 years (n: 141), 36-50 years (n: 51), and 51-65 years (n: 48). The distribution of the questionnaires according to the visiting day was done evenly as 120 users on weekdays and 120 on weekends. The distribution on the visiting frequency was varied through three categories as, more than 2 times a week (n: 42), 1-2 times a week (n: 71) and 1-2 times a month (n: 127). The correlations of the demographic factors with respects to overall noise annoyance in CEPA and in the food-court area as well as other indices, such as, the auditory perception for different sound sources on different days and in different times during these different days were also evaluated.
3.2.1. Time Spent and Preferred Activities
The most rare time spent in food-court and CEPA was noted as ‘more than 4 hours’. In addition, the time spent in food court area tended to get more rare when compared to time spent in CEPA (in Table 2).
The participants’ most common motivation for coming to CEPA was noted as ‘eating-shopping’ (40.8%). Only ‘shopping’ (34.6%) and only ‘eating’ (12.1%) followed as second and third common motivations. The forth motivation for coming to CEPA included all three activities, which were noted as ‘eating-shopping-going to movie theater’ (6.3%).
Table 1. Measured Mean Leq values for the weekends and the weekdays for different time periods.
Time Periods and Measured Mean Leq Values
Type of Day Morning Noon Afternoon Evening Overall Mean
Weekday 57.9 dBA 63.3 dBA 64.8 dBA 65.4 dBA 63.5 dBA
When the sample group was asked about their activities in the food-court, the results indicated that the majority of the users prefer ‘eating-conversation-drinking tea/coffee’ (34.6%), followed by ‘eating-conversation’ (22.5%) and ‘eating’ (17.9%). 65 percent of the users noted that they preferred to stay in the food-court area for the purpose of conversation. Although people tend to do many activities at once, the estimated time they report for spending in the food-court is comparatively low, being ‘1-2 hours’ by 94% of the sample group (in Table 2).
3.2.2. Subjective Ratings of Noise Levels (Noisiness)
In order to obtain a general knowledge on the subjective ratings of noise levels of the sample group, two basic questions regarding subjective noisiness during eating and during conversation in general were asked. These two questions were designed by the aim of gathering information about the users’ understanding of ‘noisiness’. The expected result was to obtain higher percentages regarding noisiness during conversation, as the observations implied that the sample group tends to perceive noise less during eating. The results were similar with the expected outcomes. The subjective ratings of noise levels during conversation were noted as ‘noisy-4’ (22.5%) and as ‘very noisy-5’ (60.4%). The noisiness ratings decreased by approximately 50 percent when the activity of eating was compared with conversation on the ‘very noisy-5’ rating basis (in Table 3).
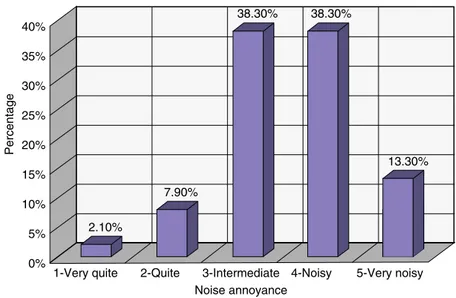
The subjective ratings that were carried out on a 5-point scale showed that 38.3% of the participants found the food-court space as noisy on the ‘intermediate-3’ basis. An additional 38.3% of the participants found it ‘noisy-4’ and 13.3% found the space ‘very noisy-5’. These outcomes identified that a total of 51.6% of the users found the food-court of CEPA either ‘noisy-4’ or ‘very noisy-5’ (in Figure 6).
Table 2. Time spent preferences of the users in CEPA and in the food-court space.
Time spent
Space 1–2 hours 3–4 hours >4 hours
CEPA 40%, n: 97 48%, n: 115 12%, n: 28
Food-court 94%, n: 225 4%, n: 10 2%, n: 5
Table 3. Subjective ratings of noise levels of the users during eating and conversation.
Subjective Ratings of Noise Levels
Activity 1-very low 2-low 3-intermediate 4-high 5-vey high
During eating 7% 8.8% 20% 29.6% 34.6%
3.2.3. Response to Different Sound Sources
When the participants were asked about the different sound sources that had an effect on the noise formation at the food-court level, the answers were quite straightforward. Noise annoyance from the ‘music from downstairs shops’, and ‘sounds from the activities held in lower ground foyer of the shopping center’ were rated as low-2. On the other hand, noise annoyance from the overall shopping center that can be heard in the food-court space was rated higher. The sound of the other people was another sound source that caused noise annoyance in the food-court and it was rated highest, playing an important role for the noise formation in the overall space affecting the perceived noisiness of the users in the food-court space (in Table 4).
The questionnaire also included questions on the type of sounds that the participants could hear while they filled out the questionnaire. The most annoying sound and most dominantly heard sound were asked separately. The answers to these questions showed
40% 35% 30% 25% 20% Percentage 1-Very quite 2.10% 7.90% 38.30% 38.30% 13.30% 2-Quite 3-Intermediate Noise annoyance
4-Noisy 5-Very noisy 15%
10% 5% 0%
Figure 6. The subjective ratings of noise levels for CEPA food-court space.
Table 4. Noise annoyance ratings of the users from different sounds in food-court space.
Noise Annoyance Ratings
Different Sounds 1-very low 2-low 3-intermediate 4-high 5-vey high
65.4% 16.7% 9.6% 5% 3.3%
Activities in CEPA foyer 44.2% 22.1% 17.4% 9.2% 7.1%
Overall noise in CEPA 10% 15.4% 30.8% 25.4% 18.3%
important variances, which offered clues on the auditory perception classifications. The question on the most dominantly perceived sound did not imply any meaning on annoyance, so the answers on that particular question were not discussed under annoyance classification. Although, in the case of auditory perception, most annoying and most dominant sound implies different meanings, the results indicated that in many cases (different day types and times in a day), the most dominantly perceived sound was also noted as being the most annoying sound.
The most annoying sound by itself was noted as ‘speech of other people’ (30%), followed by ‘hum of voices’ (19.2%). ‘Speech of other people and hum of voices’ together were also rated as the most annoying sounds by 12.5% of the sample group. These outcomes showed that speech and hum of voices were rated as most annoying sound types by a total of 61.7%, when the whole sample population was considered.
The most dominantly perceived sound was again similar to the answers for the most annoying sounds, but the content of the sound varied by being ‘separately heard speech noise’ (49.2%), and ‘hum of voices’ (25%). Sound sources described as, ‘children crying’ and ‘background music’ were rated 10% as the third and forth type of most dominantly perceived sound sources. The least rated sound is ‘tables/chairs creaking’ (5.8%). It was noted that, types of most dominantly perceived sound and most annoying sound varied greatly by day type and time of the day, (noon, afternoon and evening). This variance was linked to the masking effect. As the number of events increased they tended to mask each other, increasing the overall annoyance level. On the other hand, when the sound events occurred separately the informative character of the source could become more annoying. These different situations should be studied in detail by listening tests.
3.2.4. Variations on Weekdays and Weekends
There were considerable variations between the weekdays and the weekends regarding the participants’ auditory perception and noise annoyance ratings. The time spent in the food-court area on the weekends, and on the weekdays were very similar to each other (93.3% for the weekdays, 94.2% for the weekends); In addition, the activities undertaken in the food-court area were mainly chosen as; eating, drinking tea/coffee and conversation (34.2% for weekdays, 35% for weekends).
The users were asked whether they stay in the food court for the purpose of conversation. Although the noise level was approximately 5 dBA higher in the food court on the weekends than that of the weekdays, the results showed that at weekends, 67.5% said that they do stay in the food-court for conversation. For the weekdays, 62.5% indicated that they tend to stay for conversation. These results showed that, the majority of the sample group tended to stay in the food-court area, even though they rated the environment as ‘noisy’ for conversation purposes.
When the subjective ratings of noise levels were considered; on the weekdays, 30% of the users rated the food-court area ‘noisy-4’, and 13.3% ‘very noisy-5’. The subjective ratings for the weekends were noted as, ‘4’ by 46.7%, and ‘very noisy-5’ by 13.3%. It can be seen from this data that weekends were rated higher for noisiness as there was a shift of 16.7% towards ‘noisy-4’ scale for the weekends.
When the different source types were considered, music from downstairs shops was rated lowest of all the other four sources (68.3% for the weekdays, 62.5% for the weekends). Yet, the highest rated sound regarding annoyance was ‘noise coming from other people’, which was rated for the weekdays (high-4 by 27.5%, very high-5 by 30%) and (high-4 by 25.8%, very high-5 by 38.3%) for the weekends. The one common trend was, that for all types of sounds, at the weekends they tended to be rated higher when compared to the weekdays.
4. DISCUSSION
4.1. Leq Variances at Weekends and Weekdays
The final regulation of the Ministry of Environment and Forestry, the “Environmental Noise Management and Control Regulation” was validated on March, 2008 in Turkey [14]. According to the Turkish regulations, the limit values for indoor commercial areas such as business premises, shops or similar spaces should be lower than 60 dBA for Leq. The regulation clearly states the limit value, yet the measurements carried out in this study showed that the noise level is well beyond the limits. Especially during the noon and afternoon periods; the Leq levels approach 73 dBA at times, which is 13 dBA higher than the allowed limit. Although the noise level is not suitable for the current Turkish regulation, the measured mean Leq values for both day types tend to be suitable for the WHO community noise guidelines [11], which have been noted as 100 dBA for Leq and 110 dBA for Lmax. It is understood from the study that serious and immediate action should be taken; to analyse and control the present situation in similar spaces and renovate accordingly to lower the noise values for the comfort of the users and the employees.
Similar with this research, Chen and Kang [5], in their study on Sheffield Meadowhall Shopping Center, found the result that at the weekdays the sound pressure levels in dBA were lower than on the weekends. In their study, the sound pressure levels were lower during the the first hour of opening and the last hour of the center been open, the same as was found with the case of CEPA, whereas, during midday, the Leq values showed variances for both shopping centers. Their study is also very similar with regards to the sound pressure level changes during different day types and hours in a day. For example, in both studies, considering noon and evening hours, the weekend measured Leq values had lower amplitude; however, during the weekdays they increased in comparison to the other hours during the day. The measurements undertaken in this study indicated that Leq values for the weekdays are increased progressively during the day and became highest in the evening (in Figure 5). On the other hand at weekends, the highest values were obtained during the afternoon and the values decreased gradually during evening hours. The main reason for such a variation was due to the usage density of the shopping center and the food-court area. In addition, the main purpose and motivation (for coming to the shopping center) of the users should be analysed to understand the differences of Leq values for different day types and hours in a day.
The reason for high Leq values in the evening during the weekdays in the food court can be explained as follows; people tend to use the space for a quick dinner or gathering
space for drinking tea/coffee after work or school/college. When the traffic level is considered in the city, the dinner hours (18:00-20:00) get delayed towards 20:00 for the weekdays because of congestion. On the other hand, during the weekends, noon and afternoon hours retain the highest Leq values. This is especially the case in the afternoon, as is the time for many people to have a quick dinner or snack at the weekends in order to leave the evening hours for other leisure activities. Furthermore, people tended to crowd in groups to use the food court area more often as a result of their tendency for gathering to shop and socialize during the weekends.
In the literature, one of Bradley’s [8] studies, which concentrates on the atriums of different volumes and types within variedly functioned buildings; indicates that, the Leq values near the atriums increases with larger volumes. It has been concluded that; volume is one of the most important factor to be considered, when evaluating an enclosed space. Although, there are many other factors affecting the noise formation in atriums; in this study it can be said that volume and localization of the atrium void, as well as its shape should be studied in detail to understand the poor acoustical quality of the case space. More detailed comparisons and further research should be carried out to assess other criteria affecting Leq variances in buildings with atriums [15, 16].
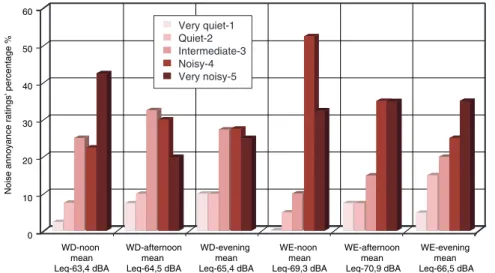
4.2. Relationships between Leq and Subjective Ratings of Noise Levels
When measured Leq values of different times of day and day types were analysed by correlation with the subjective ratings of the noise levels by the users during these predefined times, there were some noticeable, and positive relationships. In Figure 7, the percentages of the subjective ratings of the users show that during noon, both for the weekdays and the weekends, there was a significant increase.
Very quiet-1 Quiet-2 Intermediate-3 Noisy-4 Very noisy-5 60 50 40 30 20 WD-noon mean Leq-63,4 dBA WD-afternoon mean Leq-64,5 dBA WD-evening mean Leq-65,4 dBA WE-noon mean Leq-69,3 dBA WE-afternoon mean Leq-70,9 dBA WE-evening mean Leq-66,5 dBA
Noise annoyance ratings' percentage %
10
0
Figure 7. The subjective ratings of noise level percentages (ratings 1 to 5) compared with the different day types and the times of the day.
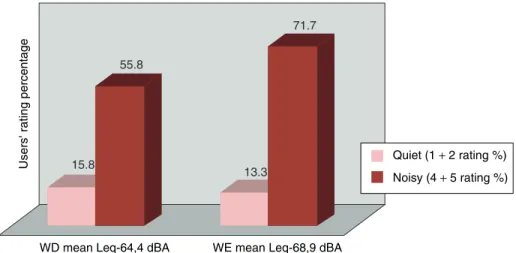
Subjective ratings of noise level relationship with the changing dBA ranges (in Table 5) had also been analysed. In order to further analyse the relation of the mean Leq value ranges and the subjective ratings, the percentages of the ratings, ‘very quite-1’ and ‘quite-2’ were added and entitled ‘quite’ and the ratings, ‘noisy-4’ and ‘very noisy-5’ were added and entitled ‘noisy’. As it can be seen from the table, the varied mean Leq value ranges and the subjective ratings correlated well with the increasing dBA levels. The results also imply that, the subjective ratings became significant above 67 dBA showing a sudden increase.
One of the most significant result was that users can perceive the dBA changes for weekdays and weekends. Noise measurements showed that there was nearly a 5dBA change between weekday and weekend Leq values. Egan (1988) developed the change in apparent loudness chart that reveals the human sensitivity to changes in sound level. It was stated that, change in sound pressure level by 6 dB is clearly noticeable by human ear [16]. In that respect, 5dBA change was also noticeable for the users of CEPA food-court space. The subjective ratings show that 71.7% of the
Table 5. Subjective ratings of noise level percentages for 3 varied mean Leq ranges of 62-64 dBA, 65-67 dBA and 68-71 dBA.
Subjective Ratings of Noise Levels
Quiet Intermediate Noisy
Mean Leq Ranges (1-Very quiet + 2-Quiet) (3-Intermediate) (4-Noisy + 5-Very noisy)
62–64 dBA 12% 32% 56%
65–67 dBA 18% 28% 54%
68–71 dBA 8% 17% 75%
Users' rating percentage
WD mean Leq-64,4 dBA WE mean Leq-68,9 dBA 15.8 13.3 55.8 71.7 Quiet (1 + 2 rating %) Noisy (4 + 5 rating %)
Figure 8. The subjective ratings of noise level percentages (quiet and noisy) compared with the mean Leq values of the weekdays and the weekends.
users rated weekends to be ‘noisy-4’ or ‘very noisy-5’. On the other hand, 55.8% rated the weekdays to be ‘noisy-4’ or ‘very noisy-5’. There was over 15% of increase on the subjective ratings for the weekends (in Figure 8).
4.3. Correlations between Noise Annoyance and Demographics
There are many different factors that were considered for correlation analysis. Educational level was found to correlate well with annoyance from ‘other people’s noise’ in the food-court space (p‹0.05). This infers, highly educated users tend to be more annoyed in such spaces. Interestingly, increasing age was negatively correlated with annoyance from ‘other people’s noise’ in the food-court (p‹0.05) (in Table 6).
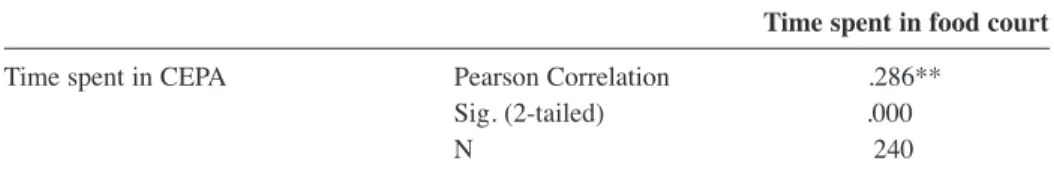
Furthermore, the time spent of the users in the space was analysed and the resulting correlations were significant for the time spent in CEPA and in the food-court (p‹0.01) (in Table 7). This correlation points out the fact that users who had participated in the questionnaire in the food-court spent most of their time in the food-court space when they have visited the shopping center. When time spent in the shopping center and the annoyance ratings in the food-court were correlated, a significant correlation between the two was noted (p‹0.05) (in Table 6). This correlation presents that people got annoyed from ‘other people’s noise’ more by the increasing time that they spent in the shopping center.
In addition, the most dominantly perceived sound and the most annoying sound were asked to the participants. When the total sample group of 240 people was considered, the most dominantly perceived sound was rated to be ‘noise from other people’ (49.2%) and secondly, ‘hum of voices’ (25%). Similarly, the most annoying sound was rated to be ‘noise from other people’ (30%) and ‘hum of voices’ (19.2%). Pearson’s correlation
Table 6. Correlation between education, age, time spent in CEPA shopping center and annoyance from other people’s noise in the food-court.
Education Age Time spent in CEPA
Annoyance from other Pearson Correlation .144* −.154* .132*
people’ noise in food Sig. (2-tailed) .026 .017 .041
court N 240 240 240
*. Correlation is significant at the 0.05 level (2-tailed)
Table 7. Correlation between time spent in food court and time spent in CEPA shopping center.
Time spent in food court
Time spent in CEPA Pearson Correlation .286**
Sig. (2-tailed) .000
N 240
was used to evaluate the two variables, and they found to be correlated (p‹0.01) (in Table 8). The result implies that, users’ auditory perception is dominated by the sounds that they tend to be annoyed by.
In order to discuss the architectural features and their effects on the auditory perception of the users, measurements or reliable simulations should be completed. Furthermore, acoustical parameters and room responses of such enclosures should be determined and studied in detail for the construction or renovation stages. In addition, the subjective evaluations and the auditory perception classifications of the users should not be left out during a renovation project. Architectural solutions such as; acoustical material applications, and interior interventions based solely on the objective parametric results of a space would not give all the necessary acoustical information regarding that space. The user’s auditory perception and comfort ratings are important clues that lead to better renovation strategies for creating ideal aural environments that would work parallel with its designated function.
One weakness for relating subjective and objective evaluation is the enclosed public space that the study takes place. First of all, there are many uncontrollable factors in such spaces as; the measurements, and surveys could not be undertaken at the same time. A research group would be needed who can accomplish the measurements at the same time as the questionnaires are carried out so that the time periods would be more concrete and a larger series of data can be gathered for more detailed comparative analysis.
5. CONCLUSION
This study aims to relate the measured equivalent continuous sound pressure level (Leq) with the auditory perception, the subjective ratings of noise levels and the noise annoyance ratings of the users in the case food-court space. The demographical differences (age, education), users’ space utilization, and auditory perception variances were also discussed with respect to the users’ subjective noise level and noise annoyance ratings.
The measurement results showed that the mean Leq value that was obtained for weekends was nearly 5 dBA higher than that of weekdays. Furthermore, the subjective ratings of noise levels of the users correlated well with the measured Leq values. Over 15% of the users found the weekends to be noisier than the weekdays. Other significant results imply that, subjective ratings of noise levels became significant above 67dBA and lead to a sudden increase for the subjective ratings above 67 dBA.
Table 8. Correlation between perceived most dominant sound and perceived most annoying sound.
Perceived most dominant sound
Perceived most annoying Pearson Correlation .205**
sound Sig. (2-tailed) .001
N 240
The questionnaire results lead to some noticeable correlations as well. Educational level was found to be significant regarding the annoyance from noise coming from other people (p‹0.05). Conversely, findings showed that, age was negatively correlated to other noise annoyance and auditory perception ratings with a significance of p‹0.05. Time spent in the shopping center was significantly correlated with noise annoyance (p‹0.05). One other interesting correlation was that users were mostly annoyed by the most dominant sounds that they have perceived (p‹0.01).
Although, there are many studies regarding noise annoyance and the objective acoustical parameters in public spaces, there are few that concentrate on the relationship of the subjective evaluation and the objective conditions with the characteristics of an enclosed space [17]. In this study, this combined method was attempted. Further studies can include indoor soundscaping approach [18], which can be undertaken in anechoic rooms with recorded noise samples and socio-acoustic surveys. The next step could be to study on an objective comparison method that analyses measured Leq values and subjective noise annoyance ratings, within the same graphical explanation, supported by numerous examples with high reliability scores. Computer simulations would also supplement the acoustical findings related with the architectural design. One important constraint of the study is the difficulty in recording the exact number of users present within the space during the whole day. A more comprehensive study can be accomplished by better collaboration and usage of the analysis tools.
6. ACKNOWLEDGEMENTS
The author gratefully acknowledges the contributions of Prof. Dr. Mehmet Çalıs¸kan to the project, and questionnaire respondents. The author would also like to thank the CEPA Management Team for their support and cooperative work.
REFERENCES
[1] Z. Maekawa, P. Lord, Environmental and Architectural Acoustics, E&FN Spon, London (1994).
[2] W. Yang, J. Kang, Acoustical comfort evaluation in urban open public spaces, Appl. Acoust. 66 (2005) 211-229.
[3] P. Zannin, A. Calixto, F. B. Diniz, J. Ferreira, A survey of urban noise annoyance in a large Brazilian city: the importance of a subjective analysis in conjunction with an objective analysis, Environ. Impact Assess. Rev. 23 (2003) 245-255. [4] J. Kang, Acoustic comfort in “non-acoustic” spaces: a review of recent work in
Sheffield, Proc. of IOA. 25 (2003) 125-132.
[5] B. Chen, J. Kang, Acoustic comfort in shopping mall atrium spaces-a case study in Sheffield Meadowhall, Archit. Sci. Rev. 47 (2004) 107-114.
[6] J. Kang, Relationships between objective acoustic indices and acoustic comfort evaluation in non-acoustic spaces (A), JASA 115 (5) (2004) 2371.
[7] P. N. Dökmeci, “Acoustical comfort evaluation in enclosed public spaces with a central atrium: A case study in CEPA Shopping Center, Ankara”, MFA Thesis, Bilkent University (2009).
[8] J. S. Bradley, Y. K. Oh, Average acoustical characteristics of ten atrium spaces (A), JASA 101(5) (1998) 3135.
[9] A. Mahdavi, J. Lechleitner, J. Pak, Measurements and predictions of room acoustics in atria, J. of Build. Perform. Simul. 1 (2008) 1-8.
[10] A. Mahdavi, J. Pak, J. Lechleitner, Acoustics of atria: Contrasting measurement and modeling results, Building Simulation Proceedings (2007) 1219-1226, [11] World Health Organization, WHO Guidelines for community noise (1999). [12] International Standards Organization, Acoustics-Assessment of noise annoyance
by means of social and socio-acoustic surveys, DD ISO/TS 15666 (2003). [13] Turkish Ministry of Environment and Forestry, Environmental Noise
Management and Control Regulation, 2002/49/EC (2008).
[14] H. J. Ader, G. J. Mellenbergh, Advising on Research Methods, Johannes van Kessel (2008).
[15] W. Y. Hung, W. K. Chow, A review on architectural aspects of atrium buildings, Archit. Sci. Rev. 44 (2001) 285-296.
[16] D. Egan, Architectural Acoustics, McGraw-Hill Inc, New York (1988).
[17] P. N. Dökmeci, S. Yılmazer, M. Çalı_kan, F. Erkip, Acoustical comfort evaluation in public spaces with a central atrium, Internoise Congress Proceedings (2008) in08_0572.
[18] P. N. Dökmeci, J. Kang, Objective parameters for acoustic comfort in enclosed spaces, Proceedings of 20th International Congress on Acoustics (2010).