Selçuk J. Appl. Math. Selçuk Journal of Special Issue. pp. 83-91, 2011 Applied Mathematics
An Application of Structural Change Tests on Linear Regression Models
Aydın Karakoca, A¸sır Genç
Department of Statistics, Faculty of Science, Selcuk University, 42031, Konya, Turkiye e-mail: [email protected],agenc@ selcuk.edu.tr
Abstract. In this study, we introduced structural change tests on linear re-gression models. Properties of structural tests are decribed and an application of tests done on a data sets on deposit interest rate for Latvia, Holland and Turkey which gets from unistat and Tuik.
Key words: Structural Change, Chow test, Cusum. 2000 Mathematics Subject Classification: 62J05, 91G70. 1. Introduction
Regression analysis includes any techniques for modeling and analyzing several variables, when the focus is on the relationship between a dependent variable and one or more independent variables. The most common form of linear regression model(LRM) is given in (1).
(1) Yi= β0+ β1Xi1+ β2Xi2+ · · · + βkXik+ εi, i = 1, 2, . . . , n
The success of the model depends on both ensuring the classical assumptions on (1) and homogeneity of data. Small changes in trends may occur long circuit in some cases. These changes may cause important effects on model struc-tures.Changes in the trend of the variables considered importantly is called structural change.The structural change which resulting data after a certain pe-riod and ongoing pepe-riod indicates the difference in the data.Structural change makes temporary or consistent effects on LRMs. For instance steps to decrease inflation can effects the economic variables .If structural change occurs due to earthquake,drought or strike because of these have a temporary effect after these events disappear there is no effect of structural change [4].
2. Structural Change Tests
Tests on structural change are concerned with testing the null hypothesis of “no structural change” i.e., that the regression coefficients remain constant against the alternative that the coefficient vector varies over time.In order to determine
even if there is a structural change on the regression coefficients several tests are available in [1], [2], [3].
2.1. Chow test
Chow, in his 1960 paper, developed one of the first testing methodologies to assess the assumption of parameter constancy. According to Chow, after the initial estimation of a linear regression model with k coefficients, one should be able to test how well m additional observations fit the regression Furthermore, another application of Chow’s method is to test the assumption of equality between subsets of coefficients. Chow proposed the implementation of an F-test for this latter application.and was the first to develop the distribution theory for such a test. A limitation of the method is that a breakpoint must be selected a priori. The breakpoint is defined as the time at which the structural change occurs under the alternative hypothesis. Several ways have been proposed for selecting the breakpoint [1].
Formally we can express this as a hypothesis-testing problem.Consider the linear model (1). If there are two subsamples, such (2) and (3), in which the parameters are not necessarily the same, then we can write,
(2) Yt= β 0 0+ β 0 1X1+ εt, t = 1, 2, . . . , n1 (3) Yt= β 00 0 + β 00 1X1+ εt, t = (n1+ 1) , . . . , n1+ n2
and the null hypothesis we wish to test is
H0 : bβ1 = bβ2 where bβ1 = " β00 β01 # and bβ2 = " β 00 0 β 00 1 #
.The total number of observations is n = n1+ n2..matrix form of (2) and (3) is (4).
(4) ⎡ ⎢ ⎢ ⎢ ⎢ ⎢ ⎢ ⎢ ⎢ ⎢ ⎢ ⎢ ⎢ ⎣ Y1 Y2 .. . Yn1 Yn1+1 Yn1+2 .. . Yn1+n2 ⎤ ⎥ ⎥ ⎥ ⎥ ⎥ ⎥ ⎥ ⎥ ⎥ ⎥ ⎥ ⎥ ⎦ = ⎡ ⎢ ⎢ ⎢ ⎢ ⎢ ⎢ ⎢ ⎢ ⎢ ⎢ ⎢ ⎢ ⎣ 1 x1 0 0 1 x2 0 0 .. . ... ... ... 1 xn1 0 0 0 0 1 xn1+1 0 0 1 xn1+2 .. . ... ... ... 0 0 1 xn1+n2 ⎤ ⎥ ⎥ ⎥ ⎥ ⎥ ⎥ ⎥ ⎥ ⎥ ⎥ ⎥ ⎥ ⎦ ⎡ ⎢ ⎢ ⎢ ⎢ ⎣ β00 β01 β000 β 00 1 ⎤ ⎥ ⎥ ⎥ ⎥ ⎦+ ⎡ ⎢ ⎢ ⎢ ⎢ ⎢ ⎢ ⎢ ⎢ ⎢ ⎢ ⎢ ⎢ ⎣ ε1 ε2 .. . εn1 εn1+1 εn1+2 .. . εn1+n2 ⎤ ⎥ ⎥ ⎥ ⎥ ⎥ ⎥ ⎥ ⎥ ⎥ ⎥ ⎥ ⎥ ⎦
If the null hypothesis isn’t true then the correct procedure is to estimate two separate regressions (??) and (??).Let bβ1 and bβ2 be the parameter estimates
and RSS2 =bε02bε2.The unrestricted sum of squares for the whole data set will
be U RSSE = RSS1+ RSS2 , which has (n1− k) + (n2− k) = n − 2k degrees
of freedom.
If the null hypothesis is true then the correct procedure is to estimate a single regression from all the data.In this case we denote the parameter estimate as b
β, the residuals bybε and the (restricted) sum of squares bε0bε as RSSE, with (n − k) degrees of freedom. Under the null hypothesis there should be no significant difference between U RSSE and RSSE. A formal test is performed by calculating the Fh-statistic,
Fh=(RSSE − URSSE) /k
U RSSE/ (n − 2k) ∼ Fk,(n−2k)
In order to use Fhstatistic variance between two periods must be same.
Homo-genetiy test of variance hypothesis , H0: σ21= σ22 can be tested by,
Fh= s2 1 s2 2 where, s2i = SSEi ni− k , i = 1, 2 and s2
i is unbiased estimators of σ2i which is the variances of error terms. In the
test procedure proportion of the biggest variance to the small one is used. The hypothesis is rejected when Fh> Fα,((n1−k),(n2−k)).satisfies.In case of disruption
of the assumption of homogeneity of variance calculations in chow test is given below, (n1− k) σ41+ (n2− k) σ42 (n1− k) σ21+ (n2− k) σ22 ∼ χ 2(f ) f = ((n1− k) σ 2 1+ (n2− k) σ22)2 (n1− k) σ41+ (n2− k) σ42 F∗∗= (RSSE − URSSE) /k U RSSE/f ∼ Fk,f 2.2. Likelihood Ratio Test (LR)
H0: bβ1= bβ2 hypothesis for (2) and (3) can be tested by LR statistic given by
LR = (RSSE/U RSSE)−n/2 or −2 log LR = n log (RSSE/URSSE) for LR test. LR has Chisquare distribution with degree of freedom k .The hypothesis which suggests there is no structural change rejected when LR > χ2(k) satisfies [2].
2.3. Wald Test
The Wald test is a way of testing the significance of particular explanatory variables or restrictions in a model.Testing Hβ=h hypothesis
W = ³
H bβ− h´0hH (X0X)−1H0i−1³H bβ− h´
bσ2
herebσ2estimator of unrestricted model error’s variance and, bσ2= U RSSE/n
³
H bβ − h´0hH (X0X)−1H0i−1³H bβ− h´= RSSE − URSSE
W = RSSE − URSSE U RSSE/n
W has Chi-Square distribution with degree of freedom k.The hypothesis which suggests there is no structural change rejected when W > χ2
(k) satisfies [5].
2.4. Lagrange Multiplier Test (LM)
Lagrange Multiplier(LM) tests has Chi-Square distribution with degree of free-dom k as well as LR and Wald tests. LM test uses LM statistic given in (5).The hypothesis which suggests there is no structural change rejected when LM > χ2 (k) satisfies [2] bσ2R= RSSE/n (5) LM = ³ H bβ− h´0hH (X0X)−1H0i−1³H bβ− h´ bσ2R =RSSE − URSSE RSSE/n
2.5. Cusum and Cusum-sq Tests
Cusum test is performed for testing the stability of regression coefficients. Con-siderin (1), Let (6) is the parameter estimates for first t observation, X(t) and
Y(t)the first t observations of independent and dependent variables respectively
, (7) is variance of model.
(7) σ2(1 + Xt+1
³
X(t)0X(t)´−1X(t)0)
and et+1 = Yt+1− Xt+1(t)bβ (t)
is the errors .(9) can be obtained by using sequential errors (8), (8) wt+1= et+1/ µ 1 + Xt+1 ³ X(t)0X(t)´−1X(t)0 ¶1/2 (9) Wt= t X i=k+1 wi sw
in (9) sw is sample variance of wk+1, . . . , wN . By drawing scatter plot of Wt
versus t (t = k + 1, . . . , N ) (N. is total observation number ) the two points £
k, ±c(N − k)1/2¤and£k, ±3c(N − k)1/2¤ are lower and upper confidence limit
points at point k and N respectively.For different significance levels c values are given in Table 1
Table 1.c values for different significance levels
0.01 0.05 0.10
c=1.143 c=0.948 c=0.850
Cusum square( Cusum-sq) test uses the serial errors squares. The test statistic is as given (10). (10) St= Pt i=1w2i PN i=k+1w2t t = k + 1, k + 2, . . . , N
Let E(St) = (t − k)/(N − k) is expected value of St . Cusumsq plot can be
obtained by Drawing Stversus t index. When St goes out the range E (St)±C0
hypothesis is rejected. C0 value can be determined from Cusum-sq tables.
3. Application
In this section an application of structural change tests done on a data sets on deposit interest rate between 1996 and 2010 for Latvia, Holland and Turkey which datas gets from unistat and tuik [6]. Year 2007 and 2008 were important because of the global financial crisis and effects of the global financial crisis to
the deposit rate values are investigated by (1) which has one dependent variable (time) and dependent variable (deposit rates).Datas are give in (Figure 1)
0 2 4 6 8 10 12 14 1996 1997 1998 1999 2000 2001 200 2 200 3 200 4 200 5 2006 2007 2008 2009 2010 Turkey Holland Latvia
Figure 1. Turkey,Holland and Latvia deposit rate1996-2010 series
Table 2. Results for Chow test F value P>F Turkey 2007 .56 .5874 2008 1.60 .2454 Holland 2007 12 .0017 2008 4.63 .0347 Latvia 2007 12 .0011 2008 6.54 .0105
Chow test is applied for three countries for years 2007 and 2008 in terms of whether there is a structural change in deposit rate series. It is seen there isn’t any structural change in 2007 and 2008 for Turkey from Table 2.(.5874 > α = 0.05, .2454 > α = 0.05) According to the Table 2 there is a significiant structural change in 2007 and 2008 for Holland and Latvia.
Table 3. Results for Wald,LR and LM test results for year 2008
LR Wald LM
χ2=3.84 χ2=3.84 χ2=3.84
Turkey 3.06<3.84 2,41<3,84 1,93<3,84 Holland 97,87>3,84 12,64>3,84 10,25>3,84 Latvia 16,04>3,84 6.72>3,84 5,67>3,84
LR,Wald and LM test results are given in table 3 and for three tests results It is seen there isn’t any structural change in 2008 for Turkey. From Table 3 it is seen that there is a significiant structural change in 2008 for Latvia an Holland.
- 15 - 10 -5 0 5 10 15 98 99 00 01 02 03 04 05 06 07 08 09 10 CUSUM 5% Sig nificance
- 0.5 0.0 0.5 1.0 1.5 98 99 00 01 02 03 04 05 06 07 08 09 10 CUSUM of Squares 5% Significance
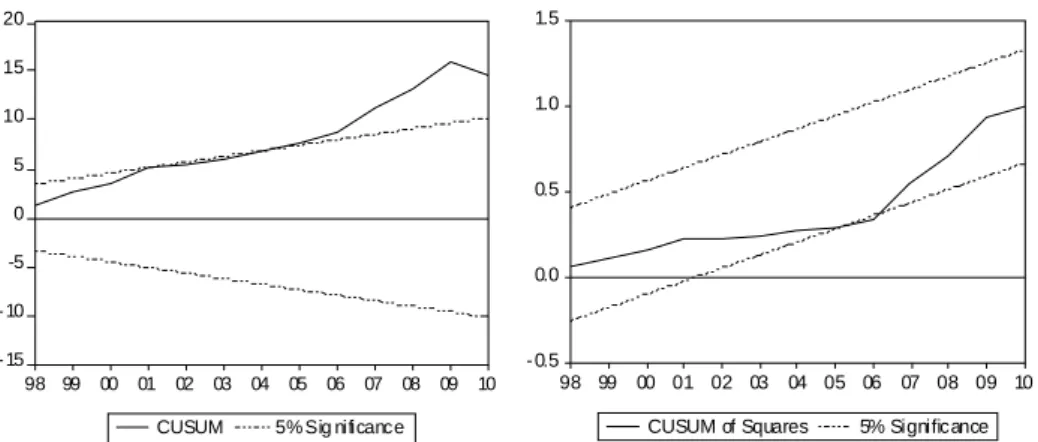
Figure 2. Turkey 1996-2010 deposit rate series Cusum and CusumSq figures
- 15 - 10 -5 0 5 10 15 98 99 00 01 02 03 04 05 06 07 08 09 10 CUSUM 5% Sig nificance
- 0.5 0.0 0.5 1.0 1.5 98 99 00 01 02 03 04 05 06 07 08 09 10 CUSUM of Squares 5% Significance
- 15 - 10 -5 0 5 10 15 20 98 99 00 01 02 03 04 05 06 07 08 09 10 CUSUM 5% Sig nificance
- 0.5 0.0 0.5 1.0 1.5 98 99 00 01 02 03 04 05 06 07 08 09 10 CUSUM of Squares 5% Significance
Figure 4. Latvia 1996-2010 deposit rate series Cusum and CusumSq figures
Cusum and Cusum-Sq figures are given for Turkey,Holland and Latvia in Figure 2, Figure 3 and Figure 4 respectively. According to the Figure 2 both cusum and cusum-sq tests are satisfies that there is no structural change for Turkey because there is no overflow out of the lower and upper limits.Acoording to the Figure 3 structural change seen for Holland because in cusum-sq drawings overflows out of the lower limit.Acoording to the Figure 4 structural change seen for Latvia because both cusum and cusum-sq drawings overflows out of the lower or upper limits.
4. Conclusion
In this study structural change tests are introduced and an application of structural change tests done on a data sets on deposit interest rate between 1996 and 2010 for Latvia, Holland and Turkey which datas gets from unistat and tuik.All tests results are not differ much. For 2008 Latvia and Holland have structural change for all tests. Turkey has no structural change for all test results.
5. Acknowledgements
This study is a part of Master Thesis titled “ Structural Change and Model Selection in Regression Models", Aydın KARAKOCA, submitted by Selcuk University, Graduate School of Natural and Applied Sciences, Department of Statistic, Konya, Turkey, 2003.
References
1. Gregory C. Chow (1960). "Tests of Equality Between Sets of Coefficients in Two Linear Regressions". Econometrica 28 (3): 591—605.
2. Bai, J. 1999. Likelihood ratio tests for multiple structural changes, Journal of econometrics (91): 299-323.
3. Luger, R. 2001 A modified CUSUM test for orthogonal structural changes, Eco-nomic letters 73: 301-306.
4. Karakoca, A, “ Structural Change and Model Selection in Regression Models”, Master Thesis, Selcuk University Institute of Science, Konya, 2003.
5. Gujarati, D.N. Basic Econometrics, McGraw-Hill Companies ,1987 6. http://tuik.gov.tr/VeriBilgi.do?tb_id=12&ust_id=4