Ž .
Chemical Physics Letters 291 1998 501–508
The barrier for heme–protein separation estimated by
non-equilibrium molecular dynamics simulations
O. Edholm
a,), P.I. Ohlsson
b, M.L. Smith
c, J. Paul
da
KTH, the Royal Institute of Technology, Theoretical Physics, SE-100 44 Stockholm, Sweden
b
Umea UniÕersity, Medical Chemistry, SE-901 87 Umea, Sweden˚ ˚ c
Chuparosa Research, Mesa, AZ 85206, USA
d
Bilkent UniÕersity, Chemistry, Bilkent 06533, Ankara, Turkey
Received 10 November 1997; in final form 11 May 1998
Abstract
Ž . In heme-containing proteins the heme group is usually non-covalently bound in a pocket. Molecular dynamics MD simulations have been performed to estimate the barrier height for heme–protein separation. In simulations of myoglobin dissolved in water, a force has been applied to pull the heme out of the binding pocket. With forces above 0.5 nN, the heme group is easily pulled out of the pocket in times of the order of tens of picoseconds. With weaker forces, heme release becomes too slow to be monitored in an MD simulation covering a couple of hundred picoseconds. These results are consistent with a free energy barrier to heme release of about 100 kJrmol. The results show that the main energetic change that occurs during the release is a conversion of hemerprotein Lennard–Jones energy into hemerwater Lennard–Jones energy. The release is essentially barrierless in energy indicating that the main part of the barrier is entropic. q 1998 Elsevier Science B.V. All rights reserved.
1. Introduction
Iron–porphyrins are the active centres of hemoproteins but it is only as joint entities that proteins and prosthetic groups can exercise their function as electron transporters, oxygen carriers and catalysts. Thermody-namics favor the formation of hemoproteins and apoproteins are excellent receptors of free heme. There is also a reverse release reaction, slow for active enzymes but rapid when the structure of the protein changes conformation. Change of conformation opens the crevice and allows water molecules to enter the pocket, thereby forming a layer between the protein and the porphyrin. This lowers the barrier for heme–protein separation.
Previous work, documented kinetics for heme release from freshly isolated proteins in their native forms as
w x
well as recombined with artificial 2,4-substituted hemes 1–6 . It was observed that even freshly prepared hemoproteins are found in two forms: one active and one inactive fraction. The fraction of inactive or fast
)
Corresponding author. E-mail: [email protected]
0009-2614r98r$19.00 q 1998 Elsevier Science B.V. All rights reserved.
Ž .
Table 1
Kinetic parameters for the slow phase release from native hemoproteins at temperatures around 258C
0 0
Protein Rate constant Pre. exp. factor D H D S DG8 Range
Ž1rmin. ŽkJrmol. ŽJrmol Ø K. ŽkJrmol. Ž8C.
Ž . LegHb ) 238C 0.00710 9.5Eq20 130 117 95 23–37 Ž . LegHb - 238C 0.00630 8.9Eq13 90 y20 96 7–23 HRP A2 0.00047 1.1Eq21 137 117 102 14–45 CCP 0.00017 1.5Eq73 437 1110 105 25–37 HRP C2 0.00024 5.2Eq21 131 91 104 30–45 Hb A 0.00773 7.0Eq20 120 82 95 25–42
chloro-peroxidase 0.00190 n.a. n.a. n.a. 99 25
earthworm Hb 0.01690 n.a. 36 y195 94 25
n.a. not available.
release protein increased with the van der Waals radius of the porphyrin 2,4-substituents, thereby supporting the intuitive model that bulky groups hinder the formation of a stable heme–protein conformation. The inactive form is distinguished from the active form by the absence of an Fe–N bond on the distal side. This was proven by similar kinetics of the heme release from the inactive protein and metal-free porphyrins from a homogeneous population. Heme proteins recombined with metal free porphyrins obviously lack Fe–N bonds and display only one rate of porphyrin release. Arrhenius plots gave a 10 kJrmol difference in the barrier height due to the Fe–N
Ž .
bond, but this was only about 10% of the total barrier height. The remaining 90–100 kJrmol Table 1 was ascribed to differences between the hemerprotein and hemerwater surface energies.
The present work is an attempt to model the above release by computer simulation techniques. Molecular
Ž .
dynamics MD simulations were performed on myoglobin dissolved in water. In these simulations, the heme group was pulled out of its pocket by the application of a constant force. These simulations give good estimates of the free energy barrier, comparable with the experimental values.
2. Methods
Myoglobin was simulated in a periodic box containing 5763 water molecules. As an initial structure, we used w x
the entry 1MBA 13 from the Brookhaven Protein Data Bank. For the simulations a standard MD program, w x
GROMOS 14 , was used. All potential parameters were the standard ones of GROMOS and the water model w x
was SPC 15 . United atoms were used for the aliphatic hydrocarbons, while polar hydrogens were represented w x
explicitly. All bond lengths were kept fixed using the algorithm SHAKE 16 . The step length for the integration of the equations of motion was chosen as 0.002 ps and a cutoff at 1.0 nm was used. The system was initially equilibrated for 200 ps. Pressure scaling was used during part of the equilibration to obtain a volume of the
w x
system corresponding to the volume at atmospheric pressure. Temperature scaling 17 to a heat bath with temperature 300 K, using a time constant of 0.1 ps, was used during the entire simulation.
The time for the spontanous equilibrium release of a heme group from the protein can be estimated from
w x Ž . Ž . Ž .
transition state theory 18 to be 2 p r v exp DUrk T , where the angular oscillation frequency v typicallyB is 2 = 1012 sy1
and the free energy barrier DU s 100 kJrmol. One obtains then, at room temperature, a time that is of the order of 107 s or several months. Since MD simulations due to the limited speed of present
computers may be performed for times only up to the order of a nanosecond, such a process cannot be simulated in equilibrium until we get computers that are about 16 orders of magnitude faster than the present ones. Alternatively, a raise of temperature by an order of magnitude would speed up the process enough to be seen on the time scale of the simulations. This is, however, not practical since it would denaturate the protein. We will therefore simulate this as a non-equilibrium process by applying a force that pulls the heme group out of the
Ž
binding pocket. This may be done in at least two different ways. We chose the method applied by Yushchenko
w x .
et al. 8 in another context to pull with a constant force and measure the resulting displacement. The force that is necessary to pull the heme group out of its pocket in a given time then provides information about the barrier height. Technically the pulling was done by applying a force on the heme and a force in the opposite direction on the protein. The direction of the force was obtained by averaging the two iron–carboxy vectors. The total disjoining force was thus first divided into two equally opposing portions, then each portion was split equally to all heme and protein atoms.
w x
Alternatively one may, as Grubmuller et al. 9 , apply a harmonic potential that restrains the position of the
¨
Ž .
bound molecule heme in our case, biotin in their case first at the binding position and then at positions successively further and further out along a trajectory that finally puts the initially bound molecule outside the solvent. This method has the advantage that if the molecule is moved slowly enough, the free energy change w x along the unbinding trajectory can be calculated by an integration procedure originally derived by Zwanzig 10 . Similar non-equilibrium dynamics simulation have recently been applied to other problems by Evans and
w x w x
Richtie 11 and Isralewitz et al. 12 .
3. Results and discussion
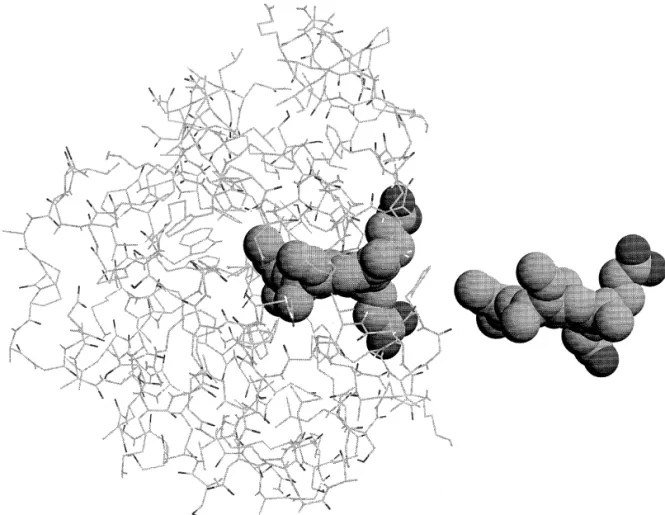
To pull the heme group out of the protein over a barrier with a height of 100 kJrmol over a distance of say 0.6 nm, one needs to apply an external force. For this distance it becomes 0.3 nN. We applied forces between 0.17 and 3.3 nN to the system and were indeed able to pull the heme free with the stronger forces. In Fig. 1, the protein with the heme in its initial position and the heme pulled out to a distance of 0.8 nm are shown. The distance of the heme iron from its initial position is shown versus time for five different forces in Fig. 2. A reproducible dissociation in times smaller than 100 ps was obtained only with forces stronger than 0.3 nN. With weaker forces, we were sometimes able to pull the heme free in times of the order of 100–300 ps, but the result depended on initial velocities and due to the longer computer times needed, we decided not to try to explore this further. A relatively broad distribution of relaxation times is also what would be expected from transition state
Ž .
theory. The results may be interpreted using the following model potential free energy :
2
°
x 2 for y` - x - x r2 0ž /
x0~
2 U x s yFx q UŽ
.
0 xŽ .
1 1 y 2 y1 for x r2 - x - x 0 0ž
x0/
¢
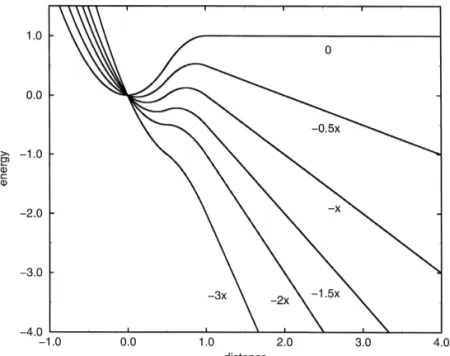
1 for x - x - `0See Fig. 3. The external pulling force is represented by the linear term in x, while the inherent free energy barrier, binding the heme to the protein, is represented by two harmonic parts which are put together in such a way that a barrier of height U , positioned at the point x0 0 along the reaction coordinate, is obtained. The remaining free parameters are determined to give a continous potential and first derivatives of the potential at
x r2. Now, if the constant force F is successively increased, the barrier becomes smaller and finally disappears0
Ž . completely. The barrier obtained from Eq. 1 is:
2
F F
DU s U 1 y 20 q .
Ž .
2ž /
ž
F0 F0/
When the force is zero the barrier is U . The barrier then decreases with increasing force until it becomes zero0
Fig. 1. Structure of the protein containing the pocket with the heme after 200 ps of equilibration and the heme in its final position outside the pocket, 2 nm from the original one. The figure was constructed using RASMOL v. 2.6.
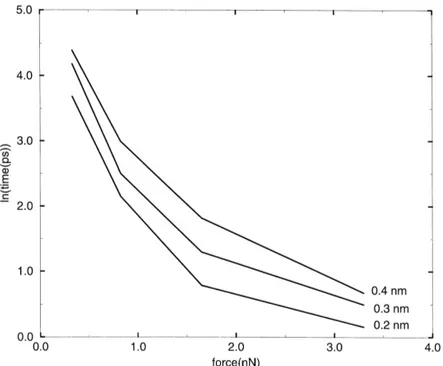
with weak forces it was noted that once the heme had reached a distance of about 0.3 nm from its initial position, it usually was released from the protein. This indicates that the barrier has its maximum around 0.3 nm in this case. Since the limiting position of the maximum when it joins the minimum is x r2, this indicates a0 position of the maximum in the unperturbed system at around 0.6 nm. In Fig. 4 we show the logarithm of the time to escape out to a distance of 0.2–0.4 nm as a function of the applied force. The escape time goes up to about 55 ps for a force of 0.33 nN. After that it increases extremely fast with the applied force.
w x Ž .
From transition state theory 18 and Eq. 2 , the escape time may be calculated as:
2
2 p 2 p U0 F F
t s exp DUrk T s
Ž
B.
exp 1 y 2 q .Ž .
3ž /
ž
/
ž
/
v v k TB F0 F0
This formula contains two unknown parameters x and U , while v can be calculated from the model potential0 0
as:
2 U0
v s
(
Ž .
4x0 m
Žthe mass is 612 grmol . We should expect the best agreement using as weak a force as possible, since a. relatively high barrier improves the validity of transition state theory. Further, as will be discussed below, strong
Fig. 2. The distance between the position of the iron in the simulation and in the binding site versus simulation time for five different pulling forces.
forces and velocities give rise to frictional forces, which lengthen the heme release times compared to transition state theory calculations. With the equations above we obtain, using x s 0.6 nm, an average release time of 440
ps with U s 80 kJrmol and 300 ps with U s 90 kJrmol. From the simulations we have 54 ps and thus0 0
estimate the barrier to slightly over 80 kJrmol. If we take friction and deviations from transition state theory
into account, an even lower barrier might be predicted. With the stronger forces, we get a potential that runs
Ž .
continously downhill after the application of the force F ) F . Then transition state theory does not apply.0
In addition to the inherent barrier for release of the heme, we also have frictional forces. Just to pull the heme group through water causes resistance. For a spherical particle, this force can be estimated from Stokes’ formula:
Ffrics y6 p ah v
Ž .
5with a being the radius of the particle, h the viscosity of the water and v the velocity of the particle. Modeling the heme group as a sphere with radius 0.7 nm, we then obtain the frictional force 0.4 nN for a velocity of 30 mrs, which is obtained if the heme is pulled over the distance of 0.3 nm in 100 ps, while the frictional force becomes 4 nN if the heme is pulled over the same distance in 10 ps. From this, it is quite clear that the frictional forces are certainly not negligible. For the weaker forces giving longer escape times, the frictional force is smaller in absolute numbers, but it is still about 25% of the pulling force. This reduces the estimated barrier from 80 to about 70 kJrmol. This brings us within 25 kJrmol of the experimental figure. Taking into account statistical and possible systematic errors, such a deviation is not unreasonable.
We also tried the alternative method, that of free energy integration. A run of 50 ps resulted an increase of free energy of several 100 kJrmol that did not level of with distance. A 500 ps simulation resulted in a free
Ž .
energy that leveled of at about 120 kJrmol. A longer runs 2 ns gave similar results.
We did analyze the various energy contributions in a 65 ps run with a force of 0.83 nN, which was successful in pulling the heme out of the pocket. The only significant changes were in the Lennard–Jones interactions between the heme group and the protein and the heme group and the water. The freeing of the heme was accompanied by a transfer of 125–150 kJrmol of Lennard–Jones energy binding the heme to the protein, into Lennard–Jones energy binding the heme to the water. This is done without any barrier in the Lennard–Jones energy since the sum of the two contributions remains almost constant. The changes in electrostatic energies are
Ž negligible. The reason for this is the fact that the electrostatic binding of the iron to the histidine is weak 10
Ž .
Fig. 4. Model binding potential of the heme into the pocket 0 and the modified potential with different applied constant forces. The units are dimensionless with the energy in units of the barrier height and the distances in units of the distance between the energy minimum and maximum and the applied force in units of the barrier height divided by this distance.
.
kJrmol and that the carboxyl groups are hydrated already in the initial structure. Since the energy cost to free the heme group is thus negligible, our conclusion is that the free energy barrier must be mainly entropic. That would be the case if it was caused by the hydrophobic effect.
To investigate this, we calculated the exposed surface area to the solvent during the simulation, using the
w x 2 2
method of Lee and Richards 19 . This gave 75.53 nm for the bound state and 91.34 nm for the free heme and
Ž 2.
protein. If the entire area change 15.8 nm was due to a transfer of hydrophobic atoms from hydrophobic surroundings into water one would, using the Tanford value for the free energy cost of transfering alkane to
y1
˚
y2w x
water, 24 cal. mol A 20 , obtain a free energy increase of 170 kJrmol. This is clearly an exaggeration w x
since all atoms are not hydrophobic. Eisenberg and McLachlan 7 have suggested a simple scale of hydrophobicity for different amino acid atoms. With their figures, the total free energy difference becomes 65 kJrmol. This is, however, an underestimate since hydrophilic atoms that get exposed to water in the separated molecules may match each other in the hemerprotein complex. If one, assuming a perfect match of hydrophilic atoms in the complex, put all contributions from hydrophilic atoms to zero, the net free energy change becomes 99 kJrmol, which probably is a slight overestimate.
We monitored changes in protein structure during the simulation by calculating the root mean square
Ž .
deviation rmsd of the atomic positions to the positions in an structure obtained by averaging the final 100 ps of equilibration. Without a pulling force, fluctuations give rise to a rmsd of about 0.12 nm. In simulations where the heme is pulled out of the pocket, this is enhanced to 0.2–0.3 nm for atoms within 0.1 nm of original iron position. Atoms further away from the heme are less affected, giving a total average rmsd of less than 0.2 nm for the whole protein. The perturbation depends on the strength of the force and is larger for a given length of simulation, the stronger the force. However, since we are able to pull the heme group out of the pocket much faster with a stronger force than with a weaker one, it is possible to remove the heme group from the pocket with a smaller perturbation using a stronger force.
Ž .
Most of the structural changes involve slight 0.2–0.3 nm adjustments of side chains positions inside the pocket. There are, however, two more spectacular changes. The side chain of Phe-98 sits originally as a sort of lid over the pocket and moves about 0.8 nm in the process of hemerprotein rupture. The other spectacular change involves Arg-70, which is located behind the heme in the pocket. When the heme group leaves the pocket, the side chain of this residue moves 0.9 nm into the position where the heme group was sitting originally. When the heme group leaves the cavity, water also enters. The number of water molecules increases from 2 to 7 within 0.5 nm of the original heme iron position and from 10 to 18 within 0.7 nm.
The amount of work performed on the system in the pulling process is FD r. Thus, the work to pull the heme free increases with the applied force. This is due to an increasing amount of irreversibility of the process. The amount of work fed into the system pulling the heme 0.3 nm with a force of 3.3 nN is 600 kJrmol, while the work is 150 kJrmol with a force of 0.83 nN. About 100 kJrmol of this energy is needed to get the heme over the free energy barrier. The rest is dissipated in the form of heat and removed from the system by the
Ž .
temperature scaling coupling to the heat bath . It is clear that to reduce the amount of irreversibility, one would like to use an as small force as possible.
It is difficult to make a rigourous error estimate. The character of the errors vary with the strength of the applied force. Strong forces give errors due to the fact that the system is driven too far out of equilibrium. Weak forces require long simulations and give statistical errors in the estimated barrier height, due to a fairly wide distribution of relaxation times. To these errors, the effect of inaccuracies in the force field have to be added. We are here simulating the hydrophobic effect and it is well known that this is difficult and that results depend sensitively on the properties of the force field. A total error of 20–30 kJrmol should certainly be expected.
We conclude that a free energy barrier of the order of 100 kJrmol can be estimated from the molecular dynamics simulations. This barrier is mainly entropic, not enthalpic. Further the release of the heme from the pocket is mainly a question of converting hemerprotein Lennard–Jones energies into hemerwater Lennard– Jones energies; electrostatics and the Fe–N bond both playing much smaller roles. This process is a transfer of a mainly hydrophobic molecule from at least partly hydrophobic surroundings in the pocket of the protein into
water, an entirely non-hydrophobic surrounding. A parallel study discusses the influence of hemerwater w x
interactions on the ferrirferro reduction potential 21 .
Acknowledgements
The computers used for these simulations were paid by grants from the Goran Gustafsson Foundation.
¨
References
w x1 J. Paul, A. Rosen, Chem. Phys. Lett. 105 1984 197.´ Ž . w x2 J. Paul, K.G. Paul, C. Holmberg, Chem. Scripta 25 1985 177.Ž .
w x3 M.L. Smith, J. Paul, P.I. Ohlsson, K. Hjortsberg, K.G. Paul, Proc. Natl. Acad. Sci. USA 88 1991 882.Ž . w x4 J. Paul, M.L. Smith, K.G. Paul, Biochim. Biophys. Acta 1079 1991 330.Ž .
w x5 J. Paul, P.I. Ohlsson, W. Chen, Chem. Phys. Lett. 231 1994 547.Ž . w x6 W. Chen, J. Paul, Inorg. Chem. 34 1995 199.Ž .
w x7 D. Eisenberg, A.D. McLachlan, Nature 319 1986 199.Ž .
w x8 V.S. Yushchenko, O. Edholm, E.D. Shchukin, Coll. Surf. 110A 1996 63.Ž . w x9 H. Grubmuller, B. Heymann, P. Tavan, Science 271 1996 997.¨ Ž . w10 R.W.J. Zwanzig, J. Chem. Phys. 22 1954 20.x Ž .
w11 E. Evans, K. Richtie, Biophys. J. 72 1997 1541.x Ž .
w12 B. Isralewitz, S. Izrailev, K. Schulten, Biophys. J. 73 1997 2972.x Ž .
w13 M. Bolognesi, S. Onesti, G. Gatti, A. Coda, P. Ascenzi, M. Brunori, J. Mol. Biol. 205 1989 529.x Ž .
w14 W.F. van Gunsteren, H.J.C. Berendsen, Groningen Molecular Simulation GROMOS Library Manual Biomos, Groningen, 1987 .x Ž . Ž . w15 H.J.C. Berendsen, J.P.M. Postma, W.F. van Gunsteren, J. Hermans, in: B. Pullman Ed. , Intermolecular Forces D. Reidel Publ.,x Ž . Ž
.
Dordrecht, 1981 p. 331.
w16 J.P. Ryckaert, G. Cicotti, H.J.C. Berendsen, Comp. Phys. 23 1977 327.x Ž .
w17 H.J.C. Berendsen, J.P.M. Postma, W.F. van Gunsteren, A. DiNola, J.R. Haak, J. Chem. Phys. 81 1984 2684.x Ž . w18 See e.g. S. Glasstone, K.J. Laidler, H. Eyring, The Theory of Rate Processes McGraw–Hill, New York, 1941 .x Ž . w19 B. Lee, F.M. Richards, J. Mol. Biol. 55 1971 379.x Ž .
w20 C. Tanford, The Hydrophobic Effect Wiley, New York, 1973 .x Ž .