:A3.l P 'i -''г i*'-· ·. -r ■ ■ ■ .'■ '.i...:; -1^· i J::^· i. ε.ΐ'Αί^^ : - ' ~ "■'V-· T S
ISS.&
ANALYTICAL LOADING MODELS
AND CONTROL STRATEGIES
IN FLEXIBLE MANUFACTURING SYSTEMS :
A COMPARATIVE STUDY
A T H E S IS S U B M I T T E D T O T H E D E P A R T M E N T O F I N D U S T R I A L E N G IN E E R IN G A N D T H E I N S T I T U T E O P E N G I N E E R I N G A N D S C IE N C E S O F B I L K E N T U N I V E R S I T Y IN P A R T I A L F U L F I L L M E N T O F T H E R E Q U I R E M E N T S F O R T H E D E G R E E O F M A S T E R O F S C I E N C E^urac/d^o /^ir~Lo vot^
tarafiidsa L :::;Lsiai§iir.
By
Nur'eddin Kirkavak ^
June, 1990
T í. І Т Г .б
і ^ б о
I certify that I have read this thesis and that in my opinion it is fully ade quate, in scope and in quality, as a thesis for the degree of Master of Science.
Assoc. Prof. Cemal Din5er(Principal Advisor)
I certify that I have read this thesis and that in my opinion it is fully ade quate, in scope and in quality, as a thesis for the degree of Master of Science.
/'I
Prof. Charles Falkner
I certify that I have read this thesis and that in my opinion it is fully ade quate, in scope and in quality, as a thesis for the degree of Master of Science.
Assoc. Prof. Ömer Benli
I certify that I have read this thesis and that in my opinion it is fully ade quate, in scope and in quality, as a thesis for the degree of Master of Science.
Assoc. Prof. Nesim Erkip
I certify that I have read this thesis and that in my opinion it is fully ade quate, in scope and in quality, as a thesis for the degree o f Master of Science.
Asst. Prof. Sinan Kayaligil
Approved for the Institute o f Engineering and Sciences:
Prof. MeHi^t Baray ^
ABSTRACT
A N A LY TIC A L LOADING MODELS
AN D CONTROL STRATEGIES
IN FLEXIBLE M ANUFACTURING SYSTEMS :
; A C O M PAR ATIVE STU D Y
Nureddin Kirkavak
M.S. in Industrial Engineering
Supervisor: Assoc. Prof. Cemal Dinger
June, 1990
There are three problem areas in designing and implementing a manufacturing line : the part family selection and grouping, system configuration and toolings and the operational control o f manufacturing. The manufacturing process has to be stream-lined by considering resources and products to achieve flow lines operating around product families with acceptable levels o f utilization. The stream-lined processes have to be assigned to tandem machines in the manufacturing lines. Then, interactions between production and inventory levels should be controlled at the operational level. Based on this framework, first a system configuration and tooling problem is modeled. The model turns out to be a large mLxed integer linear program, so that some alternative optimal seeking or heuristic techniques are used to solye the model for constructing a flow line structured Flexible Manufacturing System. Push systems of the Material Requirements Planning type or pull systems like the base-stock or Kanban schemes are often seen as alternatives for controlling manufacturing systems. The differentiating features o f push, pull and a hybrid strategy are studied by discrete event simulation under different system and environmental characteristics for Flexible Manufacturing Systems. The impact o f assignment o f operations to machines on the performance o f the system is also discussed.
K e y w o r d s : Flexible Manufacturing Systems, Machine Loading Problem, Mixed Integer Linear Pro gramming, Manufacturing Control Strategies, Simulation, Statistical Analysis.
ÖZET
ESNEK İM A LA T SİSTEMLERİNDE
YÜ K LE M E MODELLERİ
V E
KONTROL STRATEJİLERİNİN
KARŞILAŞTIRM ALI ANALİZİ
Nureddin Kırkavak
Endüstri Mühendisliği Bölümü Yüksek Lisans
Tez Yöneticisi: Doç. Cemal Dinçer
Haziran, 1990
İmalat battı tasarım \e uygulamalarında karşılaşılan üç problem alanı; ürün ailelerinin belirlenmesi
ve gruplama, sistemin kurulması ve kesici takımlarla yüklenmesi ve operasyonel imalat kontrolüdür. Kaynaklar ve ürünler göz önüne alınarak üretim süreci kabul edilebilir doluluk oranlarında belli ürün ailelerinin üretimi için çalışan imalat hatlarına ayrılırlar. Üretim sürecinden ayrılan işlemler ilgili imalat hatlarındaki seri makinalara yüklenirler. Daha sonra, üretim ile ara stok seviyeleri arasındaki etkileşim operasyonel seviyede kontrol edilmelidir. Bu yapıya göre öncelikle, sistemin kurulması ve makinaların
kesici takımlarla yüklenmesi problemi modellendi. Kurulan çok büyük Karışık Tamsayılı model alternatif
optimal veya yaklaşık çözüm veren yöntemler ile çözüldüğünde seri akışlı Esnek İmalat Sistemi kurulmuş ve kesici takımlarla yüklenmiş olur. Malzeme İhtiyaç Planlamasındaki gibi itme ve taban stok veya .Kanban tekniklerindeki gibi çekme stratejileri imalat sistemlerinin operasyonel kontrolünde alternatif olarak kullanılabilirler. İlme, çekme ve karışık stratejilerin değişik özellikleri benzetim yoluyla Esnek İmalat Sistemleri için değişik sistem ve çevre faktörlerine göre incelenmiştir. Ayrıca, operasyonların makinalara yüklenmesi probleminin sistemin performansına olan etkileri üzerinde de durulmuştur.
A n a h ta r kelim eler: Esnek İmalat Sistemleri, Makina Yükleme Problemi, İmalat Kontrol Strateji leri, Karışık Tamsayıh Doğrusal Programlama, Benzetim, İstatistiksel Analiz.
ACKNOWLEDGEMENT
I would like to thcink to Assoc. Prof. Cemal Dinger for his supervision, guidance, suggestions, and encouragement throughout the development of this thesis. I am grate ful to Prof. Charles Falkner, Assoc. Prof. Ömer Benli, Assoc. Prof. Nesim Erkip and Asst. Prof. Sinan Kayaligil for their valuable comments.
I would like to extend my deepest gratitude and thanks to my family for their morale support, encouragement, especially at times of despair and hardship. It is to them that this study is affectionally dedicated, without whom it would not be possible.
I would like to offer my sincere thanks to Cemal Akyel for his valuable remarks, comments and encouragement. I wish to express my appreciation to Deniz Goziikaxa and all other BCC personel for their help.
TABLE OF CONTENTS
1 I N T R O D U C T I O N 1
2 A N A L Y T I C A L LO A D IN G ^ M O D E L S 3
2.1 I n t r o d u c tio n ... 3
2.1.1 ' What is a Flexible Manufacturing System ? . . ' ... 3
2.1.2 Production Planning Problems of FMS ... 4
2.2 L ite ra tu re R e v i e w ... 5
2.3 M o d e l D e v e lo p m e n t ... 7
2.3.1 Problem Statement : System Configuration and T o o lin g ... 7
2.3.2 Problem Formulation . . . . ; ... * ... S 2.3.3 Problem G e n e ra tio n ... 10
2.4 S o lu tio n S trategies ... 11
2.4.1 Optimal Seeking Solution T ech n iq u e... ... . 11
2.4.2 Heuristic Loading R u l e s ... 13
2.5 C o n c lu d in g R e s u l t s ... 15
2.6 M o d e l E x t e n s i o n s ... 17
3.1 In tro d u c tio n ... 21
3.2 L itera tu re R e v i e w ... ' ... 22
3.3 S im u la tion M o d e l ... 24
3.3.1 System C o n fig u ra tio n ... 24
3.3.2 Model D e v e lo p m e n t... 24
3.3.3 Simulation Scen arios... 29
3.4 S im u la tion R esu lts ... 30
3.4.1 Impact of Loading Techniques... 31
3.4.2 Impact of Length of the Production Line ... 33
3.4.3 Impact o f Average Machine Utilization... 34
3.4.4 Impact of Demand Variability... 35
3.4.5 Impact of Buffer Inventories . . . ... ... . 37
3.5 C o n c lu s io n ... 37
4 C O N C L U S IO N L· S U G G E S T IO N S F O R F U R T H E R R E S E A R C H 39
A P P E N D I X 40
LIST OF FIGURES
2.1 The structure of system analysis... 4
2.2 The system configuration o f the original problem... 7
2.3 The system configuration for the primary model... 8
2.4 The flowchart of the problem generation procedure... 12
3.1 The layout of the hypothetical system... 25
3.2 Flowchart of the simulation model... '... 27
A .l The input parameter file for problem generation procedure... 58
A .2 The generated data of a sample problem... 59
A.3 Sample output of heuristic loading procedure... 60
A .4 The input peirameter file for problem simulation procedure... 61
A.5 Sample output of simulation procedure... 62
A .6 Evaluation of loading solutions of sample problems according to alterna tive objectives... ... 65
A .7 Evaluation of alternative loading solutions for push control strategy. . . 67
A.8 Evaluation of alternative loading solutions for pull-control strategy. . . . 68
A.9 Evaluation of alternative loading solutions for conwip control strategy. . 69
A. 10 Evaluation of alternative control strategies for heuristic loading solution. 70
A .11 Evaluation pf alternative control strategies for optimized balance of work
loads... 71
A .12 Evaluation of alternative control strategies for minimized number of buffer points... 72
A. 13 Evaluation of alternative lengths of manufacturing line for push control strategy... 75
A. 14 Evaluation of alternative lengths of manufacturing line for pull control strategy... 76
A. 15 Evaluation of alternative lengths of manufacturing line for conwip control strategy... ... ■... 77
A. 16 Evaluation of alternative control strategies for 5 machines... 78
A .17 Evaluation of alternative control strategies for 10 machines... 79
A. 18 Evaluation of alternative control strategies for 15 machines... ... . 80
A. 19 Evaluation of alternative control strategies for 20 machines... .· 81
A .20 Evaluation of alternative levels of average machine utilization for push control strategy. ... 84
A .21 Evaluation of alternative levels of average machine utilization for pull control strategy. ... 85
A .22 Evaluation of alternative levels of average machine utilization for conwip control strategy. ... 86
A .23 Evaluation of alternative control strategies for 80 % average machine utilization... 87
r A.24 Evaluation of alternative control strategies for 70 % average machine utilization. . ■... 88
A .25 Evaluation of alternative control strategies for 60 % average machine utilization. . ... 89 ‘
A .26 Evaluation of alternative control strategies for 50 % average machine utilization...; · ... 90
A.27 EveJuation of alternative levels of demand variability for push control strategy... 93 A.28 Evaluation of alternative levels of demand variability for pull control
strategy... 94
A .29 Evaluation of alternative levels of demand variability for conwip control strategy... 95 A .30 Evaluation of alternative control strategies for 0.0 coefficient of variation
in demand interarrival times... 96 A.31 Eveduation of alternative control strategies for 0.25 coefficient of variation
in demand interarrival times...·... 97 A .32 Evaluation of alternative control strategies for 0.50 coefficient of variation
in demand interarriveil times... 98
A.33 Evzduation of alternative control strategies for 1.0 coefficient of variation in demand inter arrival times... 99
LIST OF TABLES
3.1 Evaluation of alternative loading solutions in terms of alternative objectives. 32
3.2 The evaluation of distributions used for generating demand intearrival
times... 36
A .l Sizes of formulations o f problems in control group 1... 45
A .2 Sizes of formulations of problems in control group 2. . . ... 46
A.3 Sizes of formulations of problems in control group 3... 47
A.4 Solutions of problems in control group 1... 48
A .5 Solutions of problems in control group 2... 49
A .6 Results of heuristics for the problems in control group 1... 50
A .7 Results of heuristics for the problems in control group 2... 51
A .8 Results of heuristics for the problems in control group 3... 52
A .9 Tests of hypothesis related with the means of objective values of the problems in Control Group 1... 53
A. 10 Tests of hypothesis'related·, with the means of objective values of the problems in control group 2...: ... 54
A .11 Tests of hypothesis related with the 'means of objective values'of the problems in pooled control group... 55
A .12 Average power statistics for hypothesis t e s t s . ... 56
A. 14 Experimentation parameters for the impact of loading techniques. . . . 63 A. 15 Evaluation of loading solutions in terms of alternative objectives... 64 A. 16 Simulation results for the impact of loading techniques. ... 66 A. 17 Experimentation partimeters for the impact o f length of the production
line... 73
A. 18 Simulation results for the impact of length of the production line.... 74
A. 19 Experimentation pzirameters for the impact of average machine utilization. 82 A .20 Simulation results for the impact of average machine utilization... 83
A.21 Experimentation parameters for the impact of demand variability. . . . 91
A .22 Simulation results for the impact of demand variability.'... . 92 A.23 Experimentation parameters for the impact of buffer inventories in pull
control strategy. ... 100
f
A .24 Simulation results for the impact of buffer inventories in pull control strategy... 101
1. INTRODUCTION
After fifties, the developments in computer technology have been utilized to control automation in memufacturing industry. The production of numerically controlled ma
chine tools heis started Computer Aided Manufacturing (CAM ). On the other hand, the
design and process planning studies required to manufacture a new part are automated by Computer Aided Design (CAD ) and Computer Aided Process Planning (CAPP) systems as a result of increasing graphic and programming capabilities in computers.
After seventies, Automated Storage and Retreival Systems (A S /R S ) ând Automated
Guided Vehicles (AGV) represent the adoption of computer control for material handling and storage functions. A group of numerically controlled machines equipped with an automated material handling system, which are all operated under computer control, is called a Flexible Manufacturing System.
After eighties, those automation features have been brought together and integrated
in a manufacturing system for the concept of Computer Integrated Manufacturing
(CIM). Flexible Manufacturing Systems (FMS) are to be a physical implementation
of CIM in memufafcturing systems for achieving the efficiency of a transfer line with the fiexibility o f a jobshop.
•
In this thesis, the distinctive features of m anu facturing c o n tro l strategies for manufacturing systems composed of tandem flexible niachines are investigated using sequential optimization eind the discrete event simulation. The aim is to explore the potential control capability and to investigate the superiority o f pull control strategy for flexible machines under various operating conditions. First, th e sy stem configu ra tion an d to o lin g (lo a d in g ) problem is modeled with mixed integer linear program ming. Then, the simulation model of the system is developed. The emprical results are obtained from the solutions o f the loading problem and the simulated performance measures of hypothetical manufactuing systems generated for experimentation.
hypothetic2il system to be investigated is introduced and mixed integer linear program ming formulation is given in the. third section. A problem generation procedure and the design o f the experiment are also included in this section. Section four discusses solution strategies available for solving this mixed integer linear program. Concluding results are summarized in the succeding section. Modeling extensions are given in the last section o f this chapter.
The comparative analysis of manufacturing control strategies is discussed in the third chapter. Introduction and Literature Review are given in first two sections of the chapter. The. simulation model and key performance measures are explained aind the investigated simulation scenarios are introduced in the third section. The fourth section summeirizes edl simulation results. The general conclusion on the simulation of manufacturing control strategies is stated in the last section.
Finally, overall conclusion and suggetions for further research will be addressed in the last chapter. The accompanying tables, graphs and figures are collected in the Appendix. References are given at the end of the thesis.
2. ANALYTICAL LOADING MODELS
2.1
Introduction
2.1.1
What is a Flexible Manufacturing System ?After midfifties, requirements for high precision in manufacturing led to the development of nvimerically controlled machine tools. Standing in the late seventies, manufacturing systems have been designed eind developed using computer control of machine tools to produce mid-sized batches of several different parts attempting to geiin both the efficiency o f automated mass production and the flexibility of a job shop. These axe called Flexible Manufacturing Systems if they have the following main components;
• M a ch in e T o o l : It requires insignificant set-up time between two operations utilizing different tools on the same machine.
• M a teria ls H a n d lin g S y stem : It is an automated and flexible system giving alternative material routing opportunuties between components of the system. • C o m p u te r C o n tr o l S y ste m : It supports either centralized or decentralized
computer control over system components.
• R e s o u rce s to b e sh a red b y part types : These are mainly composed of tools, pallets, carriers and fixtures .
The FMS is a result o f the evolution of the use of several NC machine tools working independently, into an integrated system of CNC machine tools controlled by a central computer. As a consequence of the automatic tool interchange, the machine set-up time and hence internal set-up costs are small for an FMS, which permit less work-in-process inventory than that of a conventional manufacturing system. Generally, an FMS can process required part types to demand, in lot sizes as small as one.
2 . 1 . 2 Production Planning Problems of FMS
The design problems concern how to set up the FMS before production begins in order to meike good use of the system capabilities. The typical problems can. be listed as follows [23] :
• Part type selection problem, • Machine grouping problem, • Production ratio problem, • Resource allocation problem, • Loading problem.
In this chapter, we axe mostly interested in machine grouping and loading problems before going into the operational problems to investigate different control strategies. First problem is to partition the machines into machine groups in such a way that each machine in a particular group is able to perform the same set. of operations. The second problem is to allocate the operations and required tools for part types among the machine groups subject to·the technological and capacity constraints of the system.
The general approach to the analysis of loading and operational problems of an FMS can be described pictorially as given in Figure 2.1.
S T A T I C D E T C R M Z K I S T Z C D Y N A M I C S T O C H A S T I C O R D E T E R M I N I S T I C
Recall that a solution to the loading problem is an allocation'of the total amount of work for processing parts among the machines. A solution to the grouping problem is a particular configuration of the system.
2.2
Literature Review
The loading and scheduling problems in practice are handled in various ways. At present,'even for some FMS’s, the loading function is performed manually with an aim of finding a feasible solution [23].
Caie and Maxwell [4] have noticed that, “schedulers are usually more interested in generating a feasible part-to-tool assignment that satisfies dem and... A scheduler’s main objective is to level the load between identical machine tools so that no machine tool is over-capacitated and demand is satisfied” .
Stecke [23] have noticed that, “for systems that are simple to be able to utilize a more sophisticated loading procedure, the usual practice in industry is to balance the assigned workload among the machinés ...” . Software packages have been developed by several computer companies to help a shop manager perform his planning and/or control functions.
A common complaint of industrial practitioners is that theoretical approaches to their problèms fall short in realism or are impractical. Analytical approaches to work load assignment methods and loading procedures will now be examined for their rele vance to’ our research. The loading problem is defined as the allocation of given part types ( or operations ) to machines with limited slots in each tool magazine to minimize the number o f machines required [23].
The loading problem could be viewed as a bin packing· problem, Coffman et. al. [6]. One version of the problem has been found to be equivalent to the eissembly line balancing problem, Greene [11], Magazine and "Wee [18]. These versions of the loading problem have been shown to be NP-Complete [7].
There are many proposed procedures and algorithms which either attempt to balance or advocate balancing the workload within the job-shop environment. In these studies, it is assumed that each operation is assigned to one and only one machine.
The balancing problem in deterministic flow lines is known eis the assembly line balaincing problem and is stated as : given a production rate or cycle time, what is the minimum number of workstations needed without violating the constraints of the problem [11]. Application of an eissembly line balancing algorithm results in a one-to- one assignment of operations to machines. The possibilities of pooling or duplication of an operation assignment, or multiple manning be largely ignored. However, Wild and Slack [29] examine the benefits from the merging of two equivalent single flow lines into a one double line, with two servers at each station. They found that the double flow line reduces machine idle time. Kleinrock [15] shows that M pooled servers are more efficient than M individual parallel servers. Conway, Maxwell emd Miller [8] stated that multiple job routes and machine flexibility reduces the machine congestion and queue lengths.
FMS loading problems have brought attention to many researchers after eighties. Stecke and Solberg [24] presented flve different loading policies for an existing FMS. An impact of these policies on machine scheduling is discussed. Detailed non-linear integer programming formulations of this problem are presented by Stecke [25]. These grouping emd loading problems are solved through linearization approaches [25] or heuristics, by Stecke and Talbot [26]. A variety of objectives are considered regarding workload, material movement, tool maga.zine utilization and operation priorities. Those models include a set of constraints related to a limited space of a tool magazine. Kusiak [17] introduced an additional set of tool life zmd part assignment constraints.
Ammons et. al. [1] developed a loading model which minimizes a number of
operation-to-machine assignments while balancing the workload. The developed model is solved with three variants of the objective function. Chakravarty and Shtub [5] linked the concept of grouping parts and machines with the loading model. For one particular loading problem, Berrada and Stecke [2] developed a solution procedure to solve the non-linear integer loading problem directly.
Stecke [27] ties some previous results together by suggesting a hierarchical approach to solve actual grouping aqd loading problems. The actual grouping is done by model ing the problem as an optimal k-decomposition of weighted networks by Kumar et. al. [16]. Algorithms which are suitable for computer implementation and large problems are developed. Bounds on algorithm performance are constructed to give an estimate of the quality o f the generated solution. Greene and Sadowski [12] solved loading and scheduling problem with a mixed integer program. Several objective functions are con sidered. Also, there is a discussion on the increasing number of variables and constraints necessary to solve the problem for a real sized system.
2.3
Model Development
2.3.1
Problem Statement : System Configuration and ToolingConsider a manufacturing system composed of M machines and N different peirt tj’pes
to be processed in that system. Suppose material handling, storage and computer control problems are solved. These aire the main components o f the system. Tools are required to process the parts on the machines. So, one problem is to assign tools to machines. Then, we have to assign operations of parts to the machines that possess the required tool. Therefore, we have three different sets of components to deal with. If we bring all operations required to process all parts together, we obtain the set o f operations. For a specific part type, there may be alternative feasible sequences o f operations for processing on machines. The feasibility of operation sequences are supplied by priority relations between operations. These alternative operation sequences increzise the processing flexibility of the system. Then we have the set of machines composed o f all machines in the system. They may have different set of manufacturing characteristics. The last set is the set of tools. This set is the link between operations and machines for assignment. Because, an operation can not be assigned to a machine if the required tool is not available on that machine*.
R E C E X V I N O
WS
S - iWS s
S H I P P I N GFigure 2.2: The system configuration of the original problem.
The original problem is to find an acceptable assignment of operations and tools to machines so that grouped or pooled machines construct tandem workstations. Parts can be processed on alternative machines in a workstation. Increasing the number of alter native machines in a wokstation, increases the machining flexibility of the workstations. The configuration of the system is given in Figure 2.2.
It is important to start with the simples; formulation o f the problem. Suppose there are A/ machines, each one of them is cissigned to a unique workstation. So, there are
M number o f machines and corresponding .V/ number of workstations in the system. There éué .V number of different part types to be processed. Part type i requires 0,- number o f ot>erations to be a complete part and ready for the assembly.
Suppose ail machines are identical with the szime magazine capacity, C slots per mageizine. X ote that, in real life all operations could not be performed in all machines. For any opera.tion, there may be a feasible subset of eill machines in which the operation could be performed. V¡ is the production volume of part type i, in a period of time in which there are T time units of production planned. P,j is the processing time, in time units required for the j th operation of the i th part to be processed in the system. Machine blocking set-up times are included in processing times. Sij is the space requirements on the magtizine in terms of slots required for the tools used in the
j th operation o f the i th part. Xijm is a binary variable showing the assignment of
7 th operation of i th part to the m th machine. Several objectives could be found related with the selected performance criteria. One such simple, linear and practically interesting objective is to maximize .the minimum machine utilization. The system configuration o f the primary model is given in Figure 2.3.
2 . 3 . 2 Problem Formulation
M/'c
1 H/C 2 M/'C m— 1 M /co o
oo
:>
O O K o o ZZ Z ^ R C c e z v i N O WS i WS 2 WS m -i WS A S S E M B L Y 8i S B Z P P I N OFigure 2.3; The system configuration for the primeiry model.
.Assuming there is only one part type, the' problem reduces to deterministic line balancing problem. Otherwise, it is a mixed integer linear program as follows :
Maximize Zo = Z Subject to ^ X - * P - *V--^ijm ^ ^ 't ^ 2· j= lj=l ^ N Oi E E -Y u ™ * 5 i> < c 1=1 j=l \f
E
m=l M E - ' f ü " = 1 m=l X.jTO ¿3 Binary L· Z > 0 V m = l . . M (1) Vm = l..iVf (2) Vi = 1..N (3) V i = 1..0i - 1 Vi = 1..N ' (4) V j = l..Oi Vi = 1..N (5) V j = l..Oi Vm = 1..MIn this model, Z denotes minimum target machine utilization in the system. Note that, objective functions considered in previous formulations o f loading problem are almost non-linear. This formulation differs from the previous studies with the linear m a x im in objective. In the first constraint, Z should not exceed the assigned workloads of the meichines. Second constraint is for the magazine capacity of the machines. In this formulation of the model, the tool duplications axe not considered. Third con straint requires, the operations of a part type to be assigned in a flow line structure to the machines. This is another distinguishing feature of this formulation in loading a manufacturing line. That is, after the completion of j th operation.of a specific part, (y -f 1) st operation of the same part can be assigned either to the current machine or to the succeeding machines along the line. For all parts, one way .flow of processing is allowed eJong the production line. Note that; allowing alternative flows of operations for processing in the system, increases the flexibility but this makes the control of the system much more difflcult. And, fourth constraint assures one-to-one assignment of all operations of all parts to the machines in the system. Since, Z is a measure for minimum planned machine utilization, a value for Z that is greater than one shows the need for overtime at all machines. Finally, Xijm is a binary decision variable showing the assignment decision of.j th operation of i th part type to the m th machine.
In this model there axe 1 nonnegative zind ( M * 0 { ) binary variables together with (2 * M + 2* Oi — N ) constraints. For moderate values of M, N and 0,· the resulting problem may become computationally prohibitive in finding optimal solution. Therefore, some computationally more tractable solution procedures must be developed to attack real size problems.
2 . 3 . 3 Problem Generation
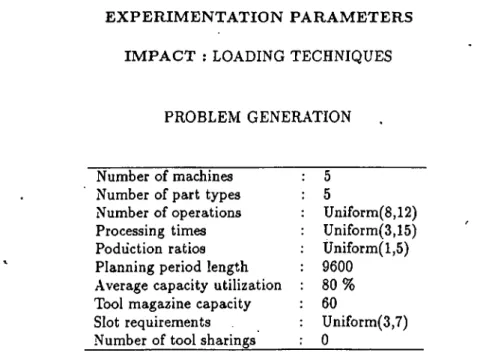
A software package is designed to test the solution capability of primtiry formulation for the system configuration and tooling problem with a built-in random problem generation mechanism. By the help of this software some test problems axe generated and solved both by a commercially available large scale Mathematical Programming System and heuristics which axe exclusively designed to solve laxger problems.
In the generation procedure of problems a standaxd random number generator is used. That maíces possible to generate the same problem by using the same input paxaxneters if need arises. There are two kinds of input paxameters to generate the system configuration and tooling problem. The first group of parameters is composed o f constants which define the general characteristics of the problem. Those parameters are as follows :
• Number of machines in the system, • Number of part types in the system,
• Machine magazine capacity in terms of slots,
e Total available time units in a planning period,
• Planned capacity utilization, required to determine the maximum throughput of the system, with generated production ratios.
The second, group of paxameters is some distribution parameters for the required data of the problem. The data are generated uniformly with specified lower and upper limits. The distribution paxameters are as follows :
• Upper and lower limits on the number of operations required to complete a specific part type,
• Upper and lower limits on slot requirements of tools in the system, • Upper and lower limits on production ratios of part types.
The procedure utilized to generate the test problems is described in the flow chart given in Figure 2.4. To gain an insight in solving system conflguration and tooling problem we have designed and evaluated experiments. Three control groups are con sidered in these experiments. Each control group is composed of several problems wnth simiW characteristics. All problems in each control group are generated using the same raaidom number seed, planned capacity utilization (average machine utilization) and av erage machine magazine utilization. The problems in each control group are comparable in size.
• C o n tro l G ro u p 1 problems are composed, of 2-3 machines and 8-16 part types. The average number of operations of a specific part type is increased from 5 to 20 in increments of 5. There are 16 different problems in this control group. These problems are relatively computationally easier due to simplicity of machines con figuration. The general parameters and the sizes of the formulations of problems are tabulated in Table A .l in the Appendix.
• C o n tro l G ro u p 2 problems are composed of 4-5 machines and 5-10 part types. The average number of operations of a specific part type is increased from 5 to 20 in increments of 5. There are again 16 different problems in the second Control Group. These problems axe relatively more complex, due to configuration, than previous group. The general parameters and the sizes of the formulations of problems are tabulated in Table A .2 in the Appendix.
• C o n tro l G ro u p 3 problems are composed of 6-7-8 machines and 3-6 part types. The average number of operations of a specific part type is increased from 5 to 20 in increments of 5. There are 24 problems in this control group. Relatively the most complex problems are in this group. The generul parameters and the sizes of the formulations of problems are tabulated in Table A.3 in the Appendi.x.
2.4 Solution Strategies
2 .4 .1 Optimal Seeking Solution Technique
The experimentation started with solving Control Group 1 problems on the main frame
[STAJtT j · P A R A M E T E R I N P U T N u m b o г оГ m a c hi n o s -># N u m b o r of p a r t t y p o s e M a c h t n o m a g a x v n o e o p a e v t y t F l o n n u n g p o r i o d i n \ v m o u n i t s • S у s i o m of f V C V 9 П С у ■ »»d R a n d o m n u m b o r g o n o r a t o r s o s d C l o n , u o n S L. i mi t s f o r o p o r a t i o n n u m b e r t 1 p t .u p t 1 L ·i m i t Ш f o r p r o c s s s i n g t v m s s I l s r « u o r 3 L i m i t s f o r s l o t r s q u i r s m s n t s C 1 pr ,u p r 3 L i m i t s f o r p r o d u c t i o n r a t i o s C O M F O T C m of o p » ra i V o n · r O R i m t t o n # 0 #C i. 1 B C J H X r O n M C I o n « u o n > Т Г N /
COMFUTC produ-ction volume • caloaO· F O R i « i t o n # F O R j B l t o o # r l S ^ « c a l 0 9 o e o l F r Г I 3 * F i C i « J S' ‘ • e o l o 9 m # « o * - i / < 1 0 0 « ш с о 1 о > F O R i · ! t o n R F v ( i S s a c o l o R F r t i l И 4 ^ C O M F U T C AT o f t o o l · i#«o F O R i s i t o П » l # 3 l R » o # C I 3 Т Г V / C O M F U T C a l o l r o q u I г о г п о п Ч I F O R l « i i o I # S r CI 3 8 U N I F O R M < I · r « u « r > Т Г V / C O M P U T E t o o l r o g u v r o m o n l a FOR v s l t o n S FOR j 9 i t o o R C l S r a n d o f f l s U N Z F O R M f O , I S > ZF n o t o v o r y t o o l V· o a a l g n o d T H C N T r C V « j 3« f V r · t u n o e · i g n o d t o o l • t a r t i n g from· r a n d o v C L S C T r ( i , j 3 » r o n d o m ____ ______________________
П
S/' ¡ O U T P U T p r v Y n a r y m o d « l f o r m u l a l v o n j~
П
Г gKp Imathematical programming code for solving linear and non-linear programming prob
lems. This code utilizes the Branch L· Bound technique in .solving integer programming
problems. In all problems, since, the formulation is maximization type, optimal linear solution is aji upper bound on the optimal integer solution. An integer solution which has an objective value greater than 99 % of the upper bound is considered to be suffi cient to stop· branching. Also, the maximum number of iterations allowed in the breinch and bound technique is 50000.
All problems of the first group could be solved with a 1 % maximum deviation from the upi>er bound in less than 50000 iterations. A total of 90 minutes of CPU Time is elapsed, to solve 16 problems in this group. Optimal linear solutions are obtained in less than 5 minutes. 30 minutes more is required to obtain the initial integer solutions. An additional 55 minutes is elapsed for improving initial integer solutions. On the average,
3 % improvement is attained in the objective functions. The details of the solutions tire
tabulated in Table A.4 in the Appendix.
For three problems of the second control group, the code was not able to find an initial integer solution ir? 50000 iterations. For other problems, the average deviation from the upper bound is 13 %. In solving these problems, a total of 9 hours of CPU Time is elapsed. Only 6 minutes of this amount is utilized for obtaining optimal linear solutions. More than 3 hours is required, to obtain initial integer solutions. Nearly 6. hours is elapsed for improving initial integer solutions to the best solutions found. An average of 9 % improvement is attained in the objective functions. The details of the solutions are tabulated in Table A .5 in the Appendix.
We conclude that, for moderately large problems acceptable feasible solutions could be found in reasonable time, but it takes too much time to improve the initial solutions or prove the optimality of the solutions.
2 . 4 . 2 Heuristic Loading Rules
There are some heuristic solution techniques to be used in obtaining an acceptable solution for the system configuration and tooling problem. All these heuristic solution techniques are myopic in the sense that they are one pass algorithms and they choose an operation from a subset of all operations with a given rule. The set of available operations consists of operations that have no unassigned preceeding. operation. If an available operation finds enough empty slots on the current machine magazine, then this operation is called a feasible available operation.
The heuristics choose an operation from the feasible available operation şet by con sidering the given criteria. Workloads and magazine capacities are the two restrictions o f the problem during the solution. Heuristic solution rules differ in two points. The first is the selection criteria and the other is the maocimum worklotid to shift the assignments to the next machine in the manufacturing line.
H E U R IS T IC # 1 : Select the operation from feasible available set of operations that minimizes the absolute difference between two ratios :
7? À 'V T d lL ’\ _ Current WOTkload’\-OvtTation Processing Requirement
HJtJ. i L/73Fİ — Target Workload
J? A T T D Slots In Current Mapazine^Oyeration Slot Requirement
^ " Target Magazine Utilizations Magazine Capacity
The machines axe loaded up to a limit where the absolute deviation of the current workload o f the machine from target workload could not be less than the previous value o f that absolute deviation by assigning more operations to the ourent machine.
H E U R IS T IC # 2 : Select the operation from feasible available set of operations as it is in Heuristic # 1, and load the meichines up to target workload.
H E U R IS T IC 3 : Select the operation from feasible available set of operations
that minimizes the absolute difference between two ratios :
Î? A T f/O // 1 _ Remaining Workload^Operation Processing Requirement ^ T T Total Processing Requirement
"R ATTCl-LkO _ Remaining Slot Repuirements—Operation Slot Requirement
^ Requirements
The machines axe loaded up to a limit where the absolute deviation of the current workload o f the machine from target workload could not be less than the previous value of that absolute deviation by assigning more operations to the current machine.
H E U R IS T IC ^ 4 : Select the operation from feasible available set of operations as it is in Heuristic ^ 3, and load the machines up to target workload.
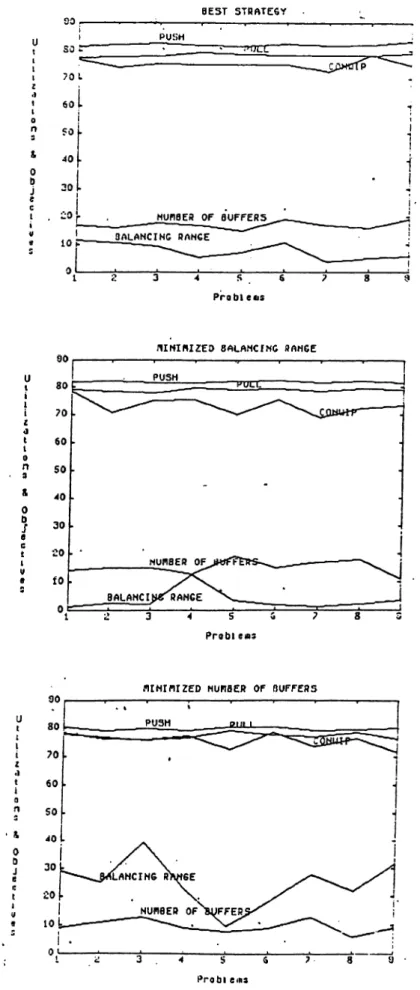
B E S T S T R A T E G Y : Apply ail four heuristics to the problem, then select the best solution obtained that gives the maximum o f minimiim workloads assigned to the machines.
Note that, if the selection o f opérations gives an infeasible assignment to the ma chines, then increase the target workload by some amount and reapply the same heuristic
technique. Also, in some problems, heuristic solution techniques may not give feasible solutions at all.
2.5 Concluding Results
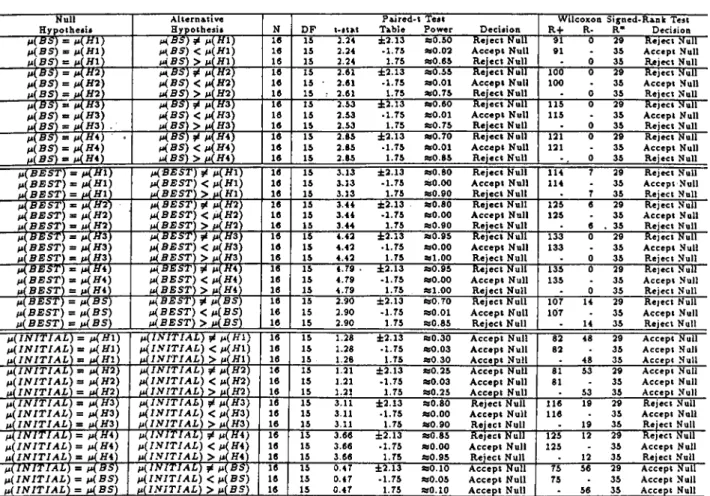
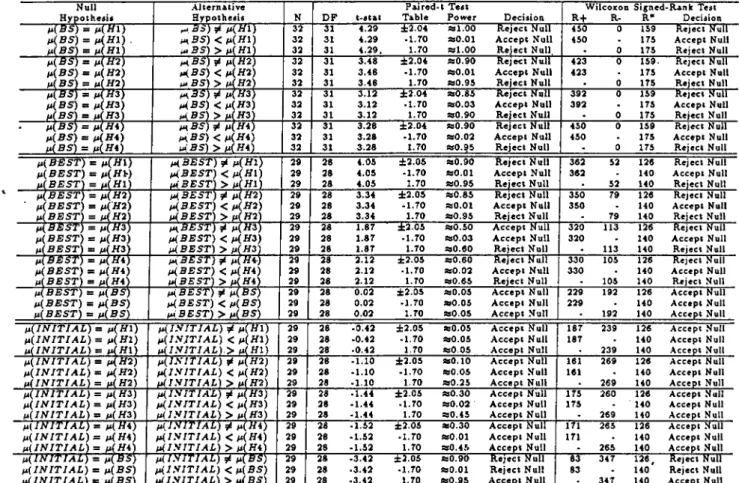
The system configuration and tooling problem is formulated and solved utilizing both optimal seeking and heuristic solution techniques. The solutions of optimal and heuris tic techniques axe evaluated by utilizing both p a ra m etric (Paired-t test with normality assumption) and n on -p a ra m etric (Wilcoxon signed-rank test) tests with appropriate hypotheses. In all cai5es, both statistical tests resulted in the same decision. The solu tions obtained from the primary formulation of the problem give a fiow line structured Flexible Manufacturing System. Operational level machining flexibility is related with the niimber o f alternative flows of processing of a specific part type in the system. Alter native flows o f processing of operations is not allowed in a flow line structured flexible manufacturing system but this reduces the complexity of the control and scheduling problems in the system.
It takes substantieil CPU time to solve the problem optimally. For relatively complex and large problems, after obtaining an initial feasible integer solution, convergence to optimal solution is too slow. If the workloaids could be balanced within a predetermined range, it may suffice to use that solution.
• C O N T R O L G R O U P 1 ; An improvement of 3 % on the average, is realized over the initial integer solution by utilizing an optimal seeking Branch Sc Bound
procedure. Solutions obtained by best strategy on >the average are within 4 %
of the optimum ( or best if 50000 iterations exceeded ) solutions. There is no definite dominating heuristic solution technique. Solutions obtained by heuristics 3 and 4 are significantly worse than the initial integer solutions of optimal seeking algorithm. On the other hand, best integer solution is significantly better than solutions o f all four heuristics' and the best strategy. Solutions of heuristics 1, 2 and the best strategy could be treated as equivalent to initial integer solutions of optimal seeking algorithm. For more detail on statistical tests, see Table A.6 and A.9 in the Appendix. •
• C O N T R O L G R O U P 2 : An improvement o f 11 % on the average, is realized over the initial integer solution by utilizing an optimal seeking Branch Sc Bound
procedure. The best solutions found are 13 % on the average less than the solutions given by LP relaxation. That shows the computational complexity of this group. Best strategy on the average gave 4 % better solutions than the best solutions
obtained (in 50000 iterations of thç Branch L· Bound Algorithm). There is no . definite dominating heuristic solution technique. Except h eu ristic# !, all other
heuristics gave significantly better solutions than initial integer solutions obtained by optimal seeking technique. In comparison to the best solutions attained by Branch & Bound procedure, heuristic 1 is significantly worse and the best strategy is significantly better. Other heuristics gave equivalently acceptable solutions with optimal seeking solution technique. For more detail on statistical tests, see Table A .7 and A. 10 in the Appendix.
• C O N T R O L G R O U P 3 : Only heuristic solution techniques axe used in this control group, since the CPU time requirement of optimal seeking solution tech nique becomes unreasonably high. The heuristic solutions found are 8 % on the average less than the upper bound given by LP relaxations. The numerical data of the solutions Eire tabulated in Table A.8 in the Appendix. For three of the problems in this control group workloads could not be balanced well. These eire the smallest sized problems in this group. During the generation of the problems, decreasing the total number of operations and at the same time keeping average machine zmd magazine utilizations close to a target value result in artificial prob lems which are away from reality. The relative reduction in the average number o f operations per machine negatively affects the balance of the workloads.
Considering all problems o f control group 1 and 2 as a pooled control group, some conclusions could be stated : •
• Applying all heuristic techniques and then selecting the best solution, result in significeint improvements.
• There is no significant differencè between initial integer solution and solution of any one o f the heuristics.
• Applying all heuristic techniques and then selecting the best solution, is equiva lently as good as the best solution obtained by optimal seeking solution technique (in 50000 .iterations).
• Best integer solutions found by optimal seeking solution technique (in 50000 it erations) are significantly better .than the individual solutions obtained by all heuristics.
• There is no dominating heuristic rule.
Related statistical tests are tabulated in Table A. 11 in the Appendix. Average power statistics for tests of hypothesis are summarized in Table A. 12 in the Appendix.Note that, in statistical tests rejection decisions are more powerful than acceptance decisions.
The performance of heuristic solution rules is even better for larger problems. A medium sized machine configuration and tooling problem is generated with parameters of 10 machines, 15 part types and 12 operations on the average by utilizing 10 different random number generation seeds. Best strategy gave solutions within'2 % on the average from the upper bound of the problem. Heuristics 2 and 4 is better than the other two on the average. The numerical data of the solutions are tabulated in Table A .13 in the Appendix.
As a result, heuristic rules, in most cases, could safely be used instead of solving the current formulation of the system configuration and tooling problem by optimal seeking solution techniques such as Branch & Boimd.
2.6 ■
Model Extensions
The primtiry formulation of the system configuration and tooling problem is the simplest representation o f the reality. It should be extended to cover some real life features of the problem. The size o f the formulation increases with the addition of new features. This malces the extended formulation more complicated and difficult to solve yet more realistic.
In the primary model formulation, all machines are assumed to be identical with the same magazine capew:ity, C . Different meichine magazine capacities could be incorpo rated into the model by using Cm instead of C in the primary model fomulation. Here,
Cm is the machine magazine capacity of the m th machine.
Tool duplications axe allowed in this formulation. Tool duplication occurs, when two operations requiring same tool assigned to the same machine. Incorporating the tool duplication problem both the number o f binary variables and constraints increase. Let us separate the set of operations into two : operations that do not use the same tool with some other operations and operations that share the same tool with some other operations. D{j is a matrix of binary parameters indicating either the j th operation of i
th part shares the tool if the binary pareimeter value is zero or otherwise that operation does not share any tool. Suppose Y\m is a binary variable representing the assignment of I th tool to the m th machine in the system. There are L ''number of different tools available. Additionally, Ei is a binary parameter showing either the tool I is required by only one operation if the value is zero, or that tool is utilized by more than one operation if the value is one. Ri is the number of slots required on the magazine by the
I th tool. Wi is the number of operations using I th tool, that is, the total number of
the required tool is a\'ailable on that machine. So, the assignment decision is extended to cover the assignment of sharing tools to the machines.
There is also, only one sequence of operations for processing in the system. It is possible to consider tdternative. sequences o f operations. During^ the process planning
stage of a part type, precedence relations between operations tire set. This information
could be summarized in a matrix o f binary parameters of a specific part. If operation j\
of part t should be processed before operation j2 of part t, then P re,(^‘1,^2) has a value of 1, otherwise zero. For all pairs of operations having 1 in precedence matrix, there tire (m — 1) number of corresponding cônstraints for not violating the precedence relations.
Primary model formulation considers maximization of minimum machine utilization as the objective. If the average machine utilization· is low, then minimizing the differ ence between the mtodmum and the minimum machine utilizations would be a better objective resulting a more balance in loading of the machines. This objective could be formulated by minimizing the difference· between two linear ^^iables. First variable, should exceed all assigned workloads to the machines and second variable, should not exceed all assigned workloads to the machines.
Modified formulation of the system configuration and tooling problem then be comes : · M inim ize Zq = Z\ — Z2 Subject to ^ y . . * p .. * V-y v V-y v -^xjm ^ -Tt} ^ •'i < z ^ Vm = 1..M (1) «■=1 }=1 ^ * ^ ®·' -^tjm ^ tj ^Y · * P· · jfc V· > Z2 Vm = 1..M (2) i=l 3=1 ^ N Oi L E * Si3 * D i j ) -f Y ^ { E i ♦ ♦ R i ) ÈCrrx Vm = 1..AÎ (3) «■ =1 i= l /=1 < 0 V/ = 1..L (4) («•J)€y(0 Vm = 1..M M < W i V / = 1..T · (5) m = l
M
Prti{jx,j2) * Y ^ m * (X.jim - Xihm) < 0
m = l
.Vf
i ;
771=1= 1
Xijm ^ i/m is Binary and > 0
Vi = l..iV (6) V ii = 1..0,· V;2 = 1..0,· Vi = l..iV . (7) V j = 1..0,· Vi = \..N (8) V ; = 1..0,· Vm = 1..M Wl = l..L
Where J (/) = { ( i ,i ) : if j th operation o f i th part uses 1 th tool for processing. Vi = L.iV & .V i = 1..0,· }
The objective function is modified for minimizing the difference between maximum and minimum machine utilizations. First two constraints put an upper and lower bound on the machine .utilizations. The modification to allow different machine mageizine càpacities is reflected in the third constraint. This constraint îdso avoids the duplication of tools. Then fourth and fifth constraints are added to dictate the assignment of tools and operations to the machines. The sixth constraint is modified to consider alternative sequences of operations in assignment. Also, there are additional binary tool assignment variables in this formulation.
The hidden objective behind maximizing minimum machine utilization or minimiz ing the difference between maximum and minimum machine utilizations, is balancing the workload between machines equally. An alternative objective could be to minimize the number o f parts processed on different machines while keeping the balance of the workloads in an acceptable range. The hidden objective in this case is minimizing the number of intermediate buffers between machines to reduce the total inventory cost.
Suppose, Zim is an additional variable showing some of the operations of i th part
performed on m th machine if it takes a value of 1 and zero otherwise. A new constraint
is required to assure the assignment o f parts to machines in the system fgr some of their processing requirements.
The resulting altenative formulation o f the system configuration and tooling problem is as follows :
Subject to M inimize Zq = E E ^im * 1=1 m = l N M ^ - ^ t j m ^ y . . :k P· . * V·^ VX ^ jj, 2-/ ¿Lé m — ^max t = l i = l X ijm < Z im
*
O i J = 1E E № m * 5 o * A i ) + E№,*yim*i2/)
<Cm
i=l i=l 1-1E
X i : m - y i m * W ,<0
(‘•.i)6^(0
A/E
m = l Af J 2 ) * ^ * (2^0*1 m “'■ ^^ij2Tn) ^0
m = l M E ^ « " . = 1 m = lXxjm & & ^im Binary
Vm = 1..M (1) Vm = 1..M (2) Vi = 1..N Vm = 1..M (3) V / = 1..L (4) Vm = 1 . . M V / = 1..L (5) % Vi = 1..N (6)
Vii =
l . O i V;2 = 1..0,· Vi = 1..JV V ; = 1..0, Vi = l..iV V ; = 1..0.· Vm = 1,.M V / = 1..L(7)
(
8
)
The objective function is altered for minimizing the number o f parts processed on different machines. First constraint does not allow a machine to be overloaded since
^max is the maximum capacity utilization ratio, "Second constraint assigns parts to machines. All other constraints of the formulation remain the same as in the modified formulation o f system configuration and tooling problem. Also, there axe additional binary part assignment variables in this formulation.
3. MANUFACTURING CONTROL STRATEGIES
3.1
Introduction
In manufacturing systems the strategy of keeping inventory at the minimum possible level has been recognized tq be very important during the ptist few yeaxs. This inter est has been created by the recently well publicized successes of Japanese production management techniques. The most well-known Japanese technique is kanban control
technique implemented within the Just-in-time philosophy. To date, the succesfuU ap
plications of the JIT concept in Japan that have been reported are mainly for Itirge scale assembly line operations.
The purpose of this research is to explore the potential of the pull aspect of JIT philosophy for scheduling and to compare the effectiveness of pull to the traditional
push and to a hybrid control strategy CONWIP - constant work-in-process.
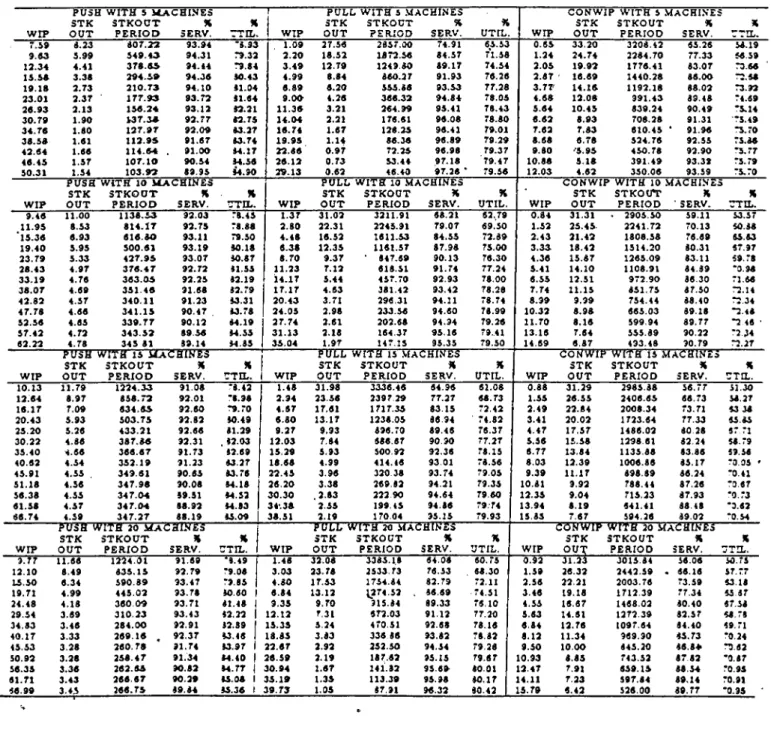
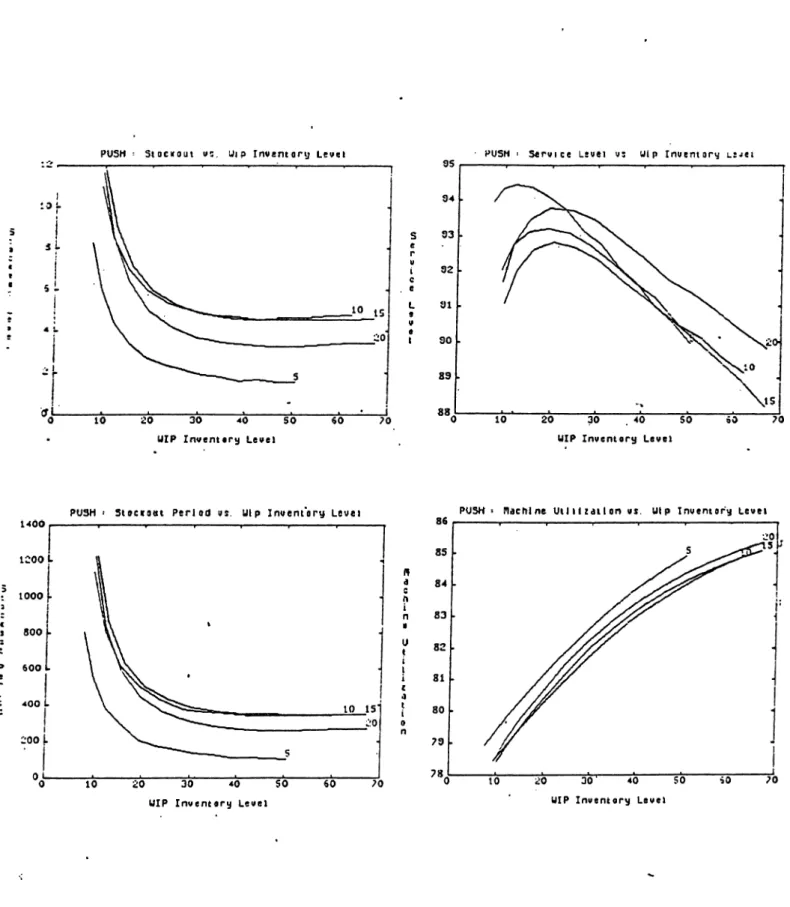
In push systems, jobs are released to the first stage to be processed, and this stage pushes the work-in-process ( WIP ) to the following stage and so forth until the product reaches the final stage. A forecast demand, including the allowances for lead times, is determined for eaxh stage of the production process. The push system is thus controlled through the inventory levels at each stage in the system. An inaccurate forecast, in most cases, is overcome by the WIP inventory levels which are often inflated to include the safety stocks. This can result in unnecessarily high carrying costs. The reliance on the WIP and on-hand inventories is the primary drawback of the push strategy.
On the other hand, the Japanese pull system is designed to minimize work-in-process inventory levels and its fluctuations. This simplifies inventory controls, prevents ampli fied transmission of demand fluctuations from stage to stage and raises the level of shop control through decentralization. In pull systems, the succeeding stage demands and withdraws work-in-process units from the preceeding stage only at its consumption rate of the items. The ideal pull system with one unit o f inventory at each stage is hardly
achievable in a real manufacturing system, where a variation in processing times, im balance of workloads between stages, demand fluctuations and machine breakdowns are inevitable.
A new pull based production system that possesses the benefits of >a pull system and can be used in a wide variety of manufacturing environments is called CONWIP. In CONWIP systems, jobs are pulled into the production emnronment whenever tin earlier job is completed and are then pushed between stages. Thus a production system operating under CONWIP strategy is a closed system.
In a sequential production line, the higher work-in-process inventory incurs cost, but it is capable o f absorbing the shock o f uncertainty from sudden machine breakdowns, high variation o f processing times at different stages and the like. In other words, it is well accepted that these intermediate buffers increase the efiiciency of the line.
In an ideal situation, the processing, times at various stages are usually asstimed constant and equal for a balanced production system. For such a system, the production line runs at 100 percent efficiency and the need for work-in-process inventory is zero when the system experiences no machine breakdowns.
f
M ost,of the systems in real life have complex characteristics so that it would be difficult to represent the system with an analytically tractable mathematical formula tion. Even in some cases, simulation is the only tool in modelling and analysis of the systems. In Flexible Manufacturing Systems, simulation can be used to test the layout of the system and to study the effects o f different control strategies, scheduling priority rules, breakdown scenarios and maintenance schemes. In this chapter, the comparative analysis of hypothetical manufacturing systems will be conducted with the help of a simulation model.
•3.2
Literature Review
During the past three decades, the general sequential production line has been studied by many researchers. Most of these research studies use simulation as a tool to investigate the effects of some system parameters on the performance of the system.
In the last decade, the concept of Just-In-Time (JIT) technique has been the main focus of the poduction literature. But, very few researchers have performed analytical studies on pull systems. A review o f these studies reveals that only two-or-three stages are analytically analyzed or simulated. Also, some of the findings are contradictory such as the placement of a bad stage in a production line [13]. Freeman [10] suggested that
a bad (bottleneck) stage should be surrounded by good stages and a large buffer should be placed close to that stage. On the other hand, Sheskin [21] found analytically that a bad stage at the beginning or at the end of the line has little effect in case of symmetric lines with reliabilities arranged in increasing or decreasing order.
Research reported on the measurement of performance of a pull system or on its performance comparison with a push system is sparse. A unitary scheme in order to interpret and classify, with push and pull logic, and some application conditons have been considered in De Toni et. al. [9].
Spearman and Zazanis [22] offer theoretical motivations for the apparent superior performance o f pull systems. They consider three conjectures:
1. Pull systems have less congestion,
2. Pull systems are inherently easier to control,
3. The benefits of a pull environment owe more to the fact that WIP is bovmded than to the practice of pulling everywhere.
Woodriiff et. al. [30] have described a pull based production control strategy cdled CON WIP that offers the possibility of significant improvements over other production control strategies. Karmarkar [14] has compared the procedural distinctions between push and pull systems. He noted that some pull systems actually have a push component inside.
Rees et al. [19] state that “ The Japanese have demonstrated in the market place the superiority o f a JIT with a Kanban system that includes reduced set-up times and costs and group technology. Many Non-Japanese companies have jumped on the Kanban b a n d -w a g on in the hope of remaining competetive. Companies that can not implement the group technology portion o f JIT may very well be better off remaining with MRP and reducing setup costs and times within that system ” .
Sarker and Fitzsimmons [20] have identified some characteristics of the pull system regarding its efficiency and the role of WIP inventory. They observed that a pull system is always better at minimal WIP levels, but on the other hand its throughput is less than the push system.
Note that, simulation analysis is an indispensible tool in designing complex systems. Discrete event simulation is a natural candidate for modeling Flexible Manufacturing Systems in which state changes occur at discrete points in time [28]. The simulation model represents the detailed operation pf the system through a computer p r o g r ^
which executes each event that would occur in the system. So, simulation modeling and analysis permits controlled experiments on complex systems.
3.3 Simulation Model
3 . 3 . 1 System Configuration
A manufacturing system with M identical and fiexible machines working in series is selected. N different part types have to be processed in this hypothetical system. Part
type irequires O,· number of operations to be a complete part and ready for the assembly.
Machines have identical magazine capacities of C slots. For any operation, there may
be a feasible subset of all machines on which the operation could be performed. V, is the
production volume of part type i in a period of time in which there are T time units.
Pij is the processing time in time units required for the j th operation of the i th part to be processed in the system.
3 . 3 . 2 Model Development
A comprehensive series of simulation experiments are designed to investigate the. per formance o f push, pull and conwip control strategies on sequential production line com posed of flexible machines. The problem generator introduced in Section 2.3.3, is used to generate data for different systems with .different parameters. Recall that, the set of parameters eissociated to the problem generation is as follows:
• Number o f machines, • Number o f part types,
• Distribution for the number of operation per part type, • Capacity o f the tool magazine ( for all machines ), • Distribution for processing times,
• Distribution for production ratios,
• Distribution for space requirements of tools on the magazines, • Planned capacity utilization,
• Planning period length,