REPUBLIC OF TURKEY SİİRT UNIVERSITY
GRADUATE SCHOOL OF NATURAL AND APPLIED SCIENCES
GAIT-BASED HUMAN GENDER CLASSIFICATION USING 5/3 LIFTING BASED WAVELET FILTERS AND PRINCIPAL COMPONENT ANALYSIS
MASTER DEGREE THESIS OMER MOHAMMED SALIH HASSAN
163111006
Department of Electrical and Electronics Engineering
Supervisor: Asst. Prof. Dr. Volkan Müjdat TİRYAKİ Co-Supervisor: Prof. Dr. Adnan Mohsin ABDULAZEEZ
June – 2018 SIIRT
THESIS NOTIFICATION
I hereby declare that this paper is my unique authorial work, which I have worked out by my own. Every information bases, references, and literature used or excerpted through an explanation of this work are correctly cited and listed incomplete reference to the owing cause.
Signature
Omer Mohammed Salih Hassan
Note: In this thesis, the use of original and other source notifications, tables, figures and photographs without reference, it is subject to the provision of law No. 5846 on Intellectual and Artistic Works.
iii
ACKNOWLEDGEMENT
First of all, thanks to GOD for giving me the strength and confidence to achieve my goals. I would like to express my gratitude and appreciation to my supervisors Prof. Dr. Adnan Mohsin Abdulazeez, and Asst. Prof. Dr. Volkan Müjdat Tiryaki for guiding me throughout implementing this valuable study. Also, I extend my gratitude to lecturers of the Department of Engineering at Siirt University, for their inspiration and valuable suggestions throughout studying my courses. Furthermore, I want to convey my special thanks and appreciations to Asst. Prof. Dr. Musa Ataş and Asst. Prof. Dr. Yılmaz Kaya for their continuous help.
2018
iv TABLE OF CONTENTS Page ACKNOWLEDGEMENT ... İİİ TABLE OF CONTENTS ... İV LIST OF FIGURES ... Vİ ABBREVIATIONS AND SYMBOL LISTS ... Vİİ SYMBOL DESCRİPTİON ... Vİİ ÖZET ... Vİİİ ABSTRACT... İX 1. INTRODUCTION ... 1 1.1THE AİM OF STUDY ... 2 1.2THESİS OUTLİNE ... 3 2. LITERATURE REVIEW ... 4
3. MATERIALS AND METHODS ... 8
3.1DATABASE ... 8 3.1.1 CASIA database B ... 8 3.1.2 OU-ISIR database... 8 3.2.METHOD ... 10 3.2.1 Preprocessing ... 10 3.2.2 Outer Contour ... 10 3.3.GAİT REPRESENTATİON ... 11
3.3.1. Continuous Wavelet Transforms ... 11
3.3.2 Discrete Wavelet Transform ... 11
3.3.3 2D Wavelet Transform ... 13
3.4WAVELET DATA ACQUİSİTİON AND DATA PRE-PROCESSİNG ... 14
3.4.1 Data Acquisition ... 14
3.4.2 Wavelet Data Pre-Processing ... 15
3.4.3 Feature Extraction ... 16
3.4.4 Wavelet Classification ... 16
3.4.5 Lifting Scheme Based Wavelet Transform ... 17
3.5DİMENSİON REDUCTİON USİNG PCA ... 22
3.6COEFFİCİENTS DESCRİPTİON... 23
C4.5 DECİSİON TREE CLASSİFİCATİON ALGORİTHM. ... 24
4. RESULTS AND DISCUSSION ... 26
4.1EXPERIMENTAL IMPLEMENTATION ... 26
4.2GAİT CYCLE DETECTİON AND FEATURE EXTRACTİON ... 29
5. CONCLUSIONS AND FUTURE WORK ... 38
5.1.CONCLUSIONS ... 38
5.2.FUTURE WORK ... 39
REFERENCES ... 40
v
LIST OF TABLES
Page Table 4.1. Gender classification results for OU-ISIR gait database large population
dataset…… ………27
Table 4.2. Gender classification results for CASIA-B gait database……….….………27
Table 4.3. Gender classification results obtained from CASIA. The present study results is given in bold……….….……….….28
Table 4.4. Comparison of gender classification with previous researchers………36
Table 4.5. The best results with RF…….….……….….………36
Table 4.6. RF performance measures for CASIA data…….….……….36
vi
LIST OF FIGURES
Page Figure. 2.1. Different stages of the walking cycle………....6 Figure. 3.1. Example images of OU-ISIR (a) and CASIA-B …..………...9 Figure. 3.2. Captured image sample of the gait measurement system……….9 Figure .3.3. The block diagram of the gender recognition system…………....……….10 Figure .3.4. The block diagram of discrete wavelet transforms…………...…………..11 Figure. 3.5. Block diagram of a 2D discrete wavelet transform…………..…..………13 Figure. 3.6. 2D discrete wavelet transform outputs of silhouette image…...……..…...13 Figure. 3.7. Examples of silhouette and neutral frames are aligned in different
sequences of human walking. The image at the far right of each row is the image of the corresponding walking energy……….…..……….15 Figure.3.8. Lifting scheme block diagram. ...…....18 Figure.3.9. Low-range and semi-high walking models frame as ………...…20 Figure.3.10. (a) The low-sub-band gait was created using contour 5/3GI and the reverse radon conversion of the corresponding parallels to the larger (b) one (c) 15, (d) 25, e 50, (f) 75, and (g) all eigenvalues, respectively ………...24 Figure.3.11. Classification phase………..………..25 Figure.4.1. Construct temporal templates for female using GEI CASIA database...….29 Figure.4.2.Construct temporal templates for male using GEI CASIA database...…30 Figure.4.3. Construct temporal templates male and female using GEI for OU-ISIR database……….………30 Figure.4.4. Cue Walk period the number of intensity pixels from the lower half of the silhouette for female in CASIA dataset………31 Figure.4.5. Cue Walk period the number of intensity pixels from the lower half of the silhouettes for male in CASIA dataset………...…………..31 Figure.4.6. Cue walk period the number of intensity pixel from the lower half of the silhouette for female in OU-ISIR dataset.……….………..32 Figure.4.7. Cue walk period the number of intensity pixels from the lower half of the silhouette for male and female in OU-ISIR dataset……….32 Figure.4.8. Wavelet filters applied on the contour images. L: Low pass filter result, H. High pass filter result………...……….33 Figure.4.9. Constructing Low and High pass subband temporal template 5/3 wavelet lifign scheme……….……….……..34 Figure.4.10.Predict and update subband temporal template 5/3 wavelet lifting scheme...34 Figure.4.11. Constructing subband temporal template PCA……….….…..35 Figure.4.12. Compressed subband temporal template PCA……….…..35 Figure.4.13. ROC cure………37
vii
ABBREVIATIONS AND SYMBOL LISTS Abbreviation Explanation
CCTV : Close Circuit Television TBP : Transient Binary Patterns PCA : Principal Component Analysis HMM : Hidden Markov model-based STIPs : Spatio Temporal Interest Points HOG : Histogram of oriented gradients HOF : Histogram of optical flow GEI : Gait Energy Image MEI : Motion-Energy Image MHI : Motion-History Image LDA : linear discriminant analysis
GTDA : General Tensor Discriminant Analysis SBDA : Sparse Bilinear Discriminant Analysis CGI : Chrono-Gait Image
FHEI : Flow Histogram Energy Image
GI : Gait Image
FT : Fourier transform
STFT : Short-Time Fourier Transform
GC : Gait Cycle
DWT : Discrete Wavelet Transform CWT : Continuous Wavelet Transform
Symbol Description I : Image r : Polar transform(line) δ : straight line ψ : Mother wavelet T : Transform 2-D : Two Dimension 1-D : One Dimension
Xw : Continuous Wavelet Transform
g[n] : Low Pass Filter
h[n] : High Pass Filter
L : Low Frequency
H1 : Horizontal data of the silhouette
H2 : Vertical data of the silhouette
H3 : Diagonal data of the silhouette
a : The constant location
b : Scaling
t : Time
viii ÖZET
YÜKSEK LİSANS TEZİ
5/3 DALGACIK KALDIRMA FILTRESI VE TEMEL BILEŞEN ANALIZI YÖNTEMLERI ILE YÜRÜYÜŞE DAYALI İNSAN CINSIYET
SINIFLANDIRMASI
M.Sc.Thesis
Omer Mohammed Salih HASSAN Siirt Üniversitesi Fen Bilimleri Enstitüsü Elektrik-Elektronik Mühendisliği Anabilim Dalı Danışman: Dr. Öğr. Üyesi Volkan Müjdat TİRYAKİ
II. Danışman: Prof. Dr. Adnan Mohsin ABDULAZEEZ
Haziran 2018, 55 sayfa
Günümüzde video verilerinin artışı ile birlikte yürüyüş tanıma sistemleri ile ilgili araştırmalar yaygınlaşmaya başlamıştır. Yürüyüş verilerinden makine öğrenmesi yöntemleri kullanılarak insan cinsiyet tahmini yapılabilmektedir. Bu çalışmada CASIA-B Yürüyüş Veritabanı ve OU-ISIR Yürüyüş Veritabanı Geniş Popülasyon Veri Setinin bir kısmı kullanılarak bir cinsiyet tahmin sistemi tasarlanmıştır. Yürüme videolarından elde edilmiş silüetlerden gerekli olan öznitelikler dalgacık 5/3 kaldırma yöntemi ile çıkarılmış, C4.5 karar ağacı algoritması ile sınıflandırılmış, ve cinsiyet tahmininde kullanılarak sistem performansı ölçülmüştür. Elde edilen sonuçlara göre, yürüyüş video kayıtlarında bulunan bilginin önerilen yöntem ile insan cinsiyetini tahmin etmede %97 oranında başarılı olduğu görülmüştür. Bu çalışma yürüyüş paternleri içindeki bilginin doğru öznitelik çıkarımı ve sınıflandırma ile insan cinsiyetinin tahmininde başarı ile kullanılabileceğini göstermiştir.
ix ABSTRACT M.Sc. Thesis
GAIT-BASED HUMAN GENDER CLASSIFICATION USING LIFTING 5/3 WAVELET FILTERS AND PRINCIPAL COMPONENT
ANALYSIS
Omer Mohammed Salih HASSAN
The Graduate School of Natural and Applied Science of Siirt University The Degree of Master of Science
In Electrical-Electronics Engineering
Supervisor: Asst. Prof. Dr. Volkan Müjdat TİRYAKİ Co-Supervisor: Prof. Dr. Adnan Mohsin ABDULAZEEZ
Jun 2018, 55 pages
Researches about gait recognition systems have begun to spread with the increase of the amount of video data. Human gender can be estimated by using machine learning methods from gait data. In the present study, a human gender classification system is designed by using CASIA - B gait database and OU-ISIR Gait Database Large Dataset. The silhouettes were extracted from the gait videos, the features were extracted using 5/3 lifting scheme, the feature vectors were then classified using C4.5 decision tree classifier, the genders were obtained, and the system performance was evaluated. Results showed that by using the proposed method, human gender were classified with an accuracy of 97.98% on CASIA - B gait databases and 97.5% recognition rate on OU-ISIR Walk Database large Dataset. This study demonstrates that using gait data followed by proposed feature extraction methods, human gender can be successfully estimated.
1 1. INTRODUCTION
Gait is a type of biometrics in which raw information is taken from video sequences of walking. Gait is the repeated movement of the legs, arms, body, and joints in leg and arms of the body. It is possible to recognize human or see his/her psychological state by examination of gait patterns. Gait is characterized as a method for the velocity procedure characterized by progressive times of raise and swing the lower limbs. "Walk" refers generally to walking, jogging and running through it is also utilized to describe a person's walking style (Mahfouf at el., 2018).
Gait recognition has attracted researchers possibly because the gait data can be captured from longer distance. Unlike other biometrics, for example, face, iris, unique finger impression, gait biometric does not require physical contact with the sensor. Gait data can be collected by using a simple camera or motion sensors. The individuals are recognized by the way they walk. The walkıng sequences are gathered while the indeviduals walks horizontally bebore the camera and procced offline. Motion stabliltiy can be achieved through a tracking system that moves to a moving object (Little and Boyd , 1998) gait recognition systems have many application fields. Gait recognition systems are used for
1) Authentication of the identities of people.
2) gender, age, and action classification (Sabir et al., 2013).
3) Diagnosis of medical diseases like Parkinson diseases, Alzheimer's diseases, and others.
4) Estimation of psychological state.
5) And security surveillance applications (Wu et al., 2017).
Gender classification is an important problem in machine learning. The features extracted from human face, voice, and gait are commonly used for this classification problem. Gait data can be used to classify gender. In addition, gait features can be extracted from video stream with relatively low resolutions (Eltaher et al., 2014). Gender classification can be used in security surveillance systems, customer statistical information for shopping centers, robotic applications, and detection of elderly people in care centers (Flora et al., 2015).
Gait pattern may contain transient or constant changes. The gait pattern is affected by extrinsic factors such as terrain, footwear, clothing, and cargo and intrinsic factors
2 such as sex, weight, height, age (Iwama et al. 2006). The gait pattern is also affected by physical properties of the environment, emotions, and anthropometric characteristics (Ramakrishnan et al., 2018).
In this thesis, gender classification system was implemented by preprocessing, outer contour extraction, template construction by 5/3 lifting based wavelet filters, dimension reduction with PCA, and finally classification.
The preprocessing and contour extraction details are given in the materials and methods section. A discrete wavelet conversion (DWT) is a transformation in which wave samples are examined separately. One of the main advantages of transformation is that it holds both frequency and location information. Lifting scheme is a method for both DWT and wave performance mapping. The 5/3 wavelet filters were used to preserve the data passing a walk sequence, which is useful for the representation of the gait and the recognition system. The lifting scheme transforms any separate must switch with limited filters into a series of primary joiners, the so-called lifting steps, which reduces the number of calculations by about two factors.
Principal Component Analysis (PCA) is a mathematical method that reduces the dimensionality of the data while retaining most of the variation in the dataset extracting features converts information in high-dimensional space to a distance of fewer dimensions. In PCA, a linear chart of data is made into a low-dimensional space so that the data discrepancy is doubled in low-dimensional representation. In practice, the heterogeneity matrix of the data is constructed and the intrinsic vectors of this matrix are calculated. Self-contained items that correspond to the largest values of eigenvalues are used to rebuild a large portion of the original data discrepancy (Ding et al., 2002).
1.1 The Aim of Study
The goal of this thesis is to implement human gender classification using the gait data in OU-ISIR Gait Database and CASIA dataset B. The recognition performance of lifting 5/3 wavelet filters followed by the C4.5 algorithm for gender classification using OU-ISIR database and CASIA was investigated.
Gait is a dynamic property and recognizing feature at low resolution, from a distance, noncontact, result without user co-operation, the main objective of gait recognition to address these restrictions develop two-dimensional templates. Building a format without losing information of walk sequences is a critical task.
3
GEI is one of the most commonly used coordination methodologies and this methodology was used Wang et al. (2012) and Yu at al. (2006) in gait recognition, the dimension of the feature vector is veryimportant. A big input feature vector requires a lot of computation time. Therefore, it is attractive to have relatively small feature vector while keeping the original pattern's serious feature as much as could reasonably be expected. Among all the current procedures, one big approach is to change the 2-D design into a 1-D signal. The wavelet descriptor provides good global characteristic with low range and features in high different metrics (Mastriani, 2006).
In this thesis, the different time-dependent template is given to lifting 5/3 wavelet filters to capture as much information as possible from the walk sequence. Features were extracted from gait energy image. PCA was utilized to reduce the high-dimensional characteristics to a low-dimensional partial space (Amos, 2001).
The C 4.5 decision tree classifier was used to classify gender Classification techniques aim to recognize the classes that apply to objects from some characteristic features. They get to use in a wide range of individual motions and especially in automated decision building. Decision trees are a very efficient classification of supervised learning. It aims the partition of a dataset into collections as related as possible in terms of the variable to be predicted (Hssina et al., 2014).
1.2 Thesis Outline
This thesis is organized in five chapters. Chapter 1 presents the entire work and provides an overview of the topics discussed here. Revised literature and theory were briefly reviewed in Chapter 2. The method and the design and implementation system are presented in Chapter 3. In Chapter 4, conclusions and future work are presented and the thesis is completed in Chapter 5.
4 2. LITERATURE REVIEW
There is a wide and accepted thought that each individual walk is unique. A person will perform his or her own walking style in a rather repetitive manner, and unique enough to be able to visualize the person remotely by walking (Cunado et al., 2003). Strong and reliable human verification of access control and access has become very important in these days. There is an urgent need to identify individuals in a wide range of circumstances. For individual identification, many biometric-based verification techniques have been proposed using a wide range of signals, for example, fingerprint, face, iris, ear, and walking. These biometric features can also be used to estimate the gender.
There was a long pattern of use of walking recognition in video surveillance-based applications, for instance, Closed Circuit TV (CCTV), in light of its performance for the recognition of people from a distance. Gait recognition depends on some outside variables, for instance, clothing, shoes, briefcases and environmental context (Dalal, 2006).
Gender classification based on silhouette images is as of now a standout amongst the most difficult issues in image analysis research. In silhouette image understanding, crude information regularly has high dimensionality and a number of tests should be done. In this area, the choice of the feature plays an important role in enhancing the accuracy and adaptability of the identification process. Since applicable features are frequently obscure from the earlier, in reality, irrelevant and redundant features might be presented to represent to the domain. However, utilizing more features implies expanding computational cost in the feature extraction process, slowing down the classification procedure and furthermore expanding the time required for preparing and approval, which may prompt to classification over-fitting.
Just like the case in most image analysis problems, with a restricted measure of test information, unimportant features may cloud the distributions of the little arrangement of important features and confuse the classifier. It has been demonstrated both theoretically and observationally that reducing the number of unimportant or repetitive features significantly builds the learning effectiveness of the classifier. The most popular strategies used to decrease the dimensionality of gender classification according to our literature review is principal component analysis (PCA). PCA seeks to
5 locate an arrangement of commonly orthogonal essential functions that catch the directions of greatest difference in the data and reduce dimensionality in the information (Ellammal, 2013).
Different gait recognition strategies have been proposed. Zeng et al., (2014) which typically include of two essential features consist component extraction and classification, in this manner, to upgrade the recognition execution of methods one needs to enhance these two characteristics. Before classification, the characteristics must be extracted from the human walk sequence.
Model-free methods include extracting the descriptors of walking directly from the silhouettes. The general framework of the model-free approaches consist of object detection, silhouette extraction, extraction of features, and classification (Alotaibi et al., 2015).
Bouchrika and Nixon (2007) proposed a technique based on the motion model for the extraction of walking property using a borderline pattern of elliptical Fourier descriptors to separate the movement of human joints. The execution of the model-based technique is restricted and their computational many-sided quality is for the most part high. Kusakunniran, (2014) regularly investigate. The walking sequence of the movement or the shape that people make during walking to extract a characteristic walk to recognize. Methodologies can be additionally split into two classifications in light of the methods for keeping the transient data (Wang et al., 2012). In the first classification, the algorithm makes utilization of just movement data or coordinate the shape and movement data to remove the walk characteristic (Sarkar et al., 2005). Suggested algorithm for determining the path of walking based on the temporal-spatial identification. In this technique, the background subtraction and the simple technique are used first for a part and follow the silhouette of a walking figure.
The random forest algorithm was used to arrange the important features (Yeoh et al., 2017) in another research, the entire silhouette was extracted and temporal correlation was used to evaluate the video sequence of the test. The extracted silhouettes are divided into regions and the statistical properties of these regions are extracted. Sequencing of these properties depends on the Fourier analysis where a uniform average of energy spectra is included for all regions characteristics (Lee et al., 2002).
6 The transformation of individual walk by calculating the average of each of the silhouettes in the walk cycle sequence is calculated by averaging the binary-alignment silhouettes to construct a GEI temporal-spatial representation (Yeoh et al., 2017).
A comparative technique was proposed, to portray the characteristics of individual walking in order to identify the individual by walking. In this technique, authentic and synthetic gait designs are made to overcome the limitations of the development kit to improve walking recognition accuracy (Han et al., 2006). This was more skillful than the silhouette based on time regulation (Sarkar et al., 2005 and Liu et al., 2002) performance of human classification by providing a cyclic pattern clarification to solve walk sequences.
A technique was proposed to recognize the gait by creating two configurations: one is to illustrate a motion energy image (MEI) describing the place where the motion occurred in a sequence of images. Another configuration represents an image of the motion history (MHI) that describes how the animation grows. MEI and MHI were successfully used for gait recognition (Bobick et al., 2001).
The walking cycle is the interval between the dynamic cases to initiate the contact from foot to floor ("heel blow") to any foot. Each leg has two unambiguous periods. Start the time situation with a single heel blow on the next heel blow to one of the related parties (Xu et al., 2006). The walking cycles of each video sequence are described by an equal grayscale image animation. A walking cycle in detail is shown in Figure 2.1. The periods of walking cycle are known as stance and swing. The stance is the stage at which the foot touches the ground and swing is where the limbs travel through the air.
7 Wang et al. (2012) proposed a practical planning technique called Chrono-Gait Image (CGI), to identify walking. In this technique, one CGI is derived by encoding each visualization of the contour curve image using a multi-channel layout role (Han et al., 2006). The artificial gait is produced to improve the rigidity of the overall complex situation and then to obtain better execution.
Yang et al. (2014) provided a fictional spatiotemporal imaging, called flow histogram energy image (FHEI) in light of HOF (Dalal et al., (2006). In this technique, HOF descriptors are output for each silhouette of a walk order and the real FHEI walk format is then constructed with the average of all HOF descriptors. A technique was proposed to produce two other synthetic walking layouts to improve FHEI recognition.
Using wavelet-based lift schemes and 5/3 wavelet filtering to save more timed information to the treadmill sequence, which is one of the most time-based techniques currently and to overcome the impact of large variations due to change in clothes and carrying bags on how to identify them (Atta et al., 2017b).
Analyze the images of the moving contour in multiple subscript images with low and high resolution by applying a scheme called 5 / 3GI on the border of a binary silhouette. Each image includes a data subdomain for a particular frequency range. At each stage of the analysis, sub-sub-images are frequently analyzed in the sub-sub-band image and the temporary high-bandwidth sub-image is obtained in the last-time analysis phase. These two sub pictures are noted as the generated time templates. For the best technical experience, the 5/3 wavelet filtering time-out system was not used to identify walking to maintain the temporal data of a walk sequence in a template image (Kusakunniran, 2014).
Decision Tree (DT) is a highly effective technique for supervised learning. It aims to divide a data set into as similar a group as possible in terms of a predictor variable. It is necessary to enter a set of disaggregated data, and to output, a tree that resembles a routing diagram where each end node is a decision and each node is an internal node. Each decision leaf describes the reference to a class of data that supports each path of tests from root to leaf. ID3 and C4.5 algorithms have been introduced which create rational DT. C4.5 was utilized in this study (Hssina et al., 2014).
8 3. MATERIALS AND METHODS
3.1 Database
In this thesis, CASIA-B and OU-ISIR database is used. The baseline algorithm is applied to this data set to derive the silhouette from gait video sequence utilizing some operation Including background subtraction and front alignment and then the next step in this algorithm is such a work is to detect the walking cycle, with the walking method is human walking is cyclic anywhere the human movement is repeated at a stable frequency (Sarkar et al., 2005; Iwama et al., 2012). The walking cycle by calculating the number of frontal pixels in the lower half of each silhouette is estimated. The largest number of pixels is obtained and the smallest is when the legs are the most separated (full walking position) and the closest to each other. The two-step walking cycle is described as continuous. This is estimated by averaging at least two sections, at least avoiding each other.
3.1.1 CASIA database B
CASIA database B is a large Multiview gait database created in January 2005. There are 124 subjects in the database. It is substantial scale database with walking individuals and the gait data was captured from 11 views. There is an irregular frame skipping and outline descriptions, making it difficult to use this database in a three-dimensional direction. There are cameras to capture the walking human from 0 to 180. This covers the prospective area of the individual left side. Despite the fact that full 3D design cannot be performed because of a lack of visibility, the search can be directed in the light of cloned 3D data.
3.1.2 OU-ISIR database
"OU-ISIR Gait, OULP-Age Large Population Data Set" and applied to a statistically reliable performance rating for walking-based gender classification. While the current walk databases include at most 4,000 items, a very extensive database of 63,846 people (31,093 males and 32,753 females) between the ages of 2 and 90 years, I classify males and females from this database (Xu et al., 2017).
9
(a) (b)
Figure.3. 1. Example images of OU-ISIR (Iwama et al., 2012) (a) and CASIA-B (b) ( Xu et al., 2017).
A diagram of gait recognition framework is shown in Fig.3.2 (Makihara et al., 2016). Each member walked along the path from left to right at his/her specific velocity without a load, enabling to examine the upper limit of the performance of the lifetime-based estimate of walking.
Figure.3. 2 captured image sample of the gait measurement system (Makihara et al. 2016).
The USB camera (FMVU-13S2C-CS) is positioned at the 90-degree azimuth to the walking path to capture images from a side view that clearly reflects the contrast between the changing ages in a human image.
Consequently, a sequence of moving images was captured 2.5 seconds per subject, with a 640 x 480-pixel image size and 30 frames per second frame rate. Furthermore, the green chromium background is planned along the walking path to enable clear silhouette extraction.
10 3.2 Method
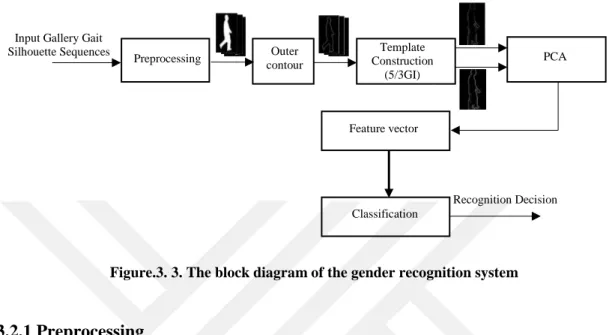
The summary of the spatiotemporal gait recognition system is shown in Figure 3.3 as a block diagram of three main phases: pre-processing, gait representation, and gait recognition.
Figure.3. 3. The block diagram of the gender recognition system
3.2.1 Preprocessing
Like gait recognition systems, a gender recognition system is performed on binary silhouettes. The baseline algorithm performed to extract the silhouette from the video sequence of the gait including background subtraction and foreground alignment, the gait cycle detection is the next step in this baseline algorithm is performed in this study in spite of the differences between walking styles, Normal human walking is a periodic movement where human movement is repeated in a stable frequency.
By the counting, the number of intensity pixels in the bottom half of every silhouette, the gait cycle can be simply estimated of each silhouette. We obtained the maximum and the minimum number of pixels when the two legs are farthest apart and closest together respectively. Therefore, in two consecutive steps, the gait cycle is estimated.
3.2.2 Outer Contour
An important issue in gait recognition is the extraction feature that will effectively capture gait features. In order to be robust to changes of clothing and illumination, it is reasonable to consider binarized the silhouettes of the subject. The width of the outer
Fig 3.1 A block diagram of the gait recognition system Fig 3.1 A block diagram of the gait recognition system Preprocessing contourOuter
Template Construction (5/3GI) PCA Feature vector Classification Recognition Decision Input Gallery Gait
11 contour of the silhouette was chosen as the feature vector. The swing of the limbs and other details of the body this physical structure of the subject are retained in the width vector
3.3. Gait Representation
The main characteristic of the lifting-based wavelet conversion is to separate the high pass and low-pass wavelet filters into a series of small filters. The lifting scheme requires a lower account compared to the conversion-based DWT system. Therefore, arithmetic complexity is reduced to approximately half of what is required with the convolution method illustrating the lifting concept (Mallat, 2008).
3.3.1. Continuous Wavelet Transforms
The definition of the continuous wavelet transform is:
Xw(a. b) = 1/√𝑏 ∫ 𝑥(𝑡)𝜓 (𝑡 −𝑎
𝑏) 𝑑𝑡 (3 − 1) ∞
−∞
Where x(t) is the input, ψ(t) is the mother wavelet, the constant a is location given by a real number, and b is a scaling given by any positive real number. There are many types of mother wavelets that can be utilized.
3.3.2 Discrete Wavelet Transform
The discrete wavelet transform block diagram is shown in Fig.3.4.
Figure.3. 4. The block diagram of discrete wavelet transform
X[n] g[n] h[n] 2 2 X1,L[n] X1,H[n]
12 x [n] is the input, h [n] is the high pass filter, g [n] is a low pass filter, 2 is the sampling factor, X1, L [n] is the low filter output, Output the high pass filter. G [n] is the same wave function in continuous wavelet transform, and h [n] is simply like the scaling function in constant wavelet transform (Balakrishnan, 2013).
The gait cycle (GC) is included in its most direct frame in the position and swing stages. The position phase is further divided into three parts as an initial double position, one-limb position, and an absolute double-limb position (Julio et al., 2016).
Walking cycles are used to extract and recognize the feature. Most regular walk-cycle detection methodologies depend on the sum of the front-end pixels of all frames in a walk sequence. Therefore, installation methods should be applied to the use of this signal in the detection of the walking cycle.
The most crucial information about gait recognition was shown to exist in the outer forms of silhouettes images (Wang et al., 2012).
For every sequence of a gait image, an adaptive silhouette algorithm is first used to divide the sequence frames and a series of subsequent processing is applied to obtain natural silhouettes with less noise. The extraction method of the feature is then performed based on the outer contour.
Intrinsic ability to approximate smooth signals efficiently. Thus, by selecting approprite lifting wavelet filter can approximate such signals with very high accuracy using only a limited of coefficients and don’t use the complex mathmaticall calculation, the resulting decomposition is no longer nonredundant in general.
The wavelet transform is a method in image processing. The first comer to the wavelet was a Hungarian mathematician named Alfred Haar, who introduced the Haar wavelets in 1909.
13 3.3.3 2D Wavelet Transform
2D wavelet transform is the mix of two 1D wavelet transform. First, the 1D wavelet transforms along n, and then 1D wavelet transform along m is performed. 2D wavelet transform block diagram is shown in Fig. 3.5.
Along n Along m
Figure.3. 5. Block diagram of a 2D discrete wavelet transform
When the 2D discrete wavelet transform is performed on a silhouette image, 4 output images which are one-fourth of the original image are obtained. The result of the silhouette image processed by converting two-dimensional separate wavelets is shown in Fig. 3.4. I can see that the x1, L is much the same as the original silhouette image, and the x1, H1, x1, H2, x1, H3 are particularly comparing to the level edges, vertical edges, and corners. I can utilize the characteristic to do silhouette image compression. These four transactions are exactly the first half of the original silhouette image containing different data from the original silhouette image as taken below:
1. X1, L includes the low-frequency silhouette include and is the decreased resolution.
2. X1, H1 includes horizontal data of the silhouette. 3. X1, H2 includes vertical data of the silhouette. 4. X1, H3 includes diagonal data of the Silhouette.
2 2 X [m, n] 2 g[n] v1, L[m, n] v1, H[m, n] h[n] 2 g[m] h[m] g[m] h[m] v1, L[m, n] v1, H1[m, n] v1, H2[m, n] v1, H3[m, n] 2 2
14
X1,L
X1,H1
X1,H2
X1,H3
An example for 2D discrete wavelet transform output is shown in Figure 3.6.
Figure.3. 6. 2D discrete wavelet transform outputs of Silhouette image.
3.4 Wavelet Data Acquisition and Data Pre-Processing
In gender identification, the entire job can be split into four parts: data acquisition, pre-processing, characteristic extraction, and classification.
3.4.1 Data Acquisition
From converting input data that acquired information digitized to a discrete signal suited I derived silhouette images from the video walk sequence take advantage of some process algorithm including background subtraction and front alignment and detecting gait cycle. The technique down till store the data in the memory is a sort of data acquisition.
The silhouette has been extracted from the original human sequences. The foreground process is then connected to a silhouette of the extracted silhouette sequence (Sarkar et al., 2005). This includes normalizing the size (relative size of each silhouette image so that all silhouettes are of similar height) and arranging the level (focusing the upper half Reg_Admin_Passum entropy range estimation (Little et al., 1998) from the time arrangement signal.
Given the pre-processed binary silhouettes St (x, y) at time t in sequence, the grayscale image of gait energy image (GEI) is as follows:
15 𝐺𝑡(𝑚. 𝑛) = ∑ 𝑆𝑡(m. n)
𝑁𝑠
𝑡=1
(3 − 2) where N is the number of frames in the entire cycle (s) of the silhouette sequence, t is the frame number in the sequence, and x and y are 2D image coordinates. Fig. 3.7 illustrates the silhouette of the example in a two-person walk course and the nearest right image is associated GEI. It is clear that the (GEI) of the walk reflects the main forms of the image and its evolution on the walking cycle. I refer to it as a gait energy image for the following reasons:
Each silhouette is the image of energy that is measured for the human path at the moment.
GEI is the cumulative time-scale image of human walking in the full cycles.
High-value pixels in GEI mean that human walking happens more frequently in this situation.
Figure.3. 7. Examples of silhouette and neutral frames are aligned in different sequences of human walking. The image at the far right of each row is the image of the corresponding walking energy (Han et
al., 2006).
3.4.2 Wavelet Data Pre-Processing
One of the main functions of the data pre-processing part is to modify the measured data acquired from the data acquisition segment with the aim of making this data more suitable for further processing in extracting and classifying the parameters. There are many modifications in the pre-processing part of the data. Some of them are listed below (Li, 2003).
16 2. Smoothing and noise elimination.
3. Edge sharpening.
4. Border detection and tracking of contour. 5. Thinning.
6. Segmentation.
7. Morphological processing.
8. Texture object from the textural background. 9. Approximation of curves and surfaces
Border detection and tracking of contour and morphological processing was used in the present study.
3.4.3 Feature Extraction
The derived feature is the core of the pattern identification structure. In pattern identification, the characteristic is utilized to identify one class of style from another. The pattern space is usually of high dimensions. The purpose of the derived property is to define the target and then reduce the dimensions of the estimated space to the appropriate space for the pattern class methods. Feature derive maps the pattern space into a component space.
3.4.4 Wavelet Classification
The classification with the wavelet method, first the feature vector is obtained. Presently the issue is the manner by which to look at the feature vector of input and the feature vector of the databank.
Several tests were a load to estimate the implementation of the HGI algorithm and 5 / 3GI. These tests were conducted on the OU-ISIR walking database Xu et al., (2017) and CASIA walking database (Dataset B) (Okumura et al., 2010). Some pattern images from the two databases have appeared in Fig. 4.1 The OU-ISIR Gait Database contains 200 people taken under various conditions. Positions (left / right), with two bearing conditions (with/without bag), wear different shoes, and with different time and different clothes. A set of video sequences was used as a method. The mean of all feature vectors
17 that are created from a single image sequence or video represents the vector of that video input.
3.4.5 Lifting Scheme Based Wavelet Transform
Sweldens et al., (1998) developed a lifting scheme to construct positive orthogonal wavelets. The lifting scheme is derived in the spatial domain. Lifting scheme is a simple algorithm for calculating wavelet transformations. It is used to generate second wavelet generation, which is not necessarily a translation and extension of a particular function.
It has been initiated as a method to promote certain separate wavelet transformations to acquire certain characteristics. Later it turned into an ingenuity algorithm to calculate any wavelet conversion due to basic lifting steps. The lifting scheme is transformed into a strategy to activate a true wavelet conversion that is reversible.
Wave development consists of a three-phase lifting scheme: the first step is the split phase that divides data into odd and even pairs. The second stage is an expected phase, where an odd group of an even group is expected. Phase prediction ensures multi-boundary cancellation in the high pass. The third step is to update the stage that will be updated until it is adjusted using the wavelet factor to calculate the measurement function. The update phase ensures that the moments in the low pass are preserved.
These steps can be any set (reversible), resulting in a wider lifting scheme. Separate wavelets can be decomposed into a limited series of basic filtering steps (lifting steps). This decomposition relates to the effect of a more multi-phase matrix of wavelet filters in the base matrices. Degradation arbitrarily reduces the computational complexity of conversion by the factor two. The scheme can be generalized to an integer to integer and other nonlinear transformations.
In this thesis, a various issue form method that relies upon Wavelet filters began to get as much help and dynamic information as they could reasonably be required from a walk sequence. Temporary filters through the lifting scheme were as it turned out to be an able expert temporal analysis structure that was used as a piece of the 3D wavelet-based video coding (Chen et al. 2004) and also in scalable video coding (SVC).
In this video encoding method, wavelet filters (such as low partial timers) or long orthogonal latency, such as 5/3 wavelet filters, were implemented by the lifting scheme. The lifting scheme consists of two successive advances called: an estimation step and an
18 updated step. The high-pass subdomain form is created in the estimation step, while in the updated step, the filtered subdomain is made to pass low temporarily using the high-pass filtered outlines from the estimated step. Lifting is a method to design wavelets and result in the discrete wavelet transform (DWT). The first lifting scheme is divided into wavelet conversion into a data set that is processed to half-even and half-odd as shown in figure 3.8.
Figure.3. 8. Lifting scheme block diagram. (Patel et al., 2014).
Lifting scheme forward transforms consists of three steps: Split, predict, and update.
1. Split: In partitioned step, the data is divided into ODD and EVEN elements.
2. Predict step: The difference between odd and even data is the odd elements of the next wavelet conversion step. Step prediction, where the odd value of the next "expected" repeat is described from the even value of the current step by (1). The index "j" represents the iteration and "i" represents the element:
Odd j+1, j= odd j,i+ P(even j,i) (3-3) 3. Update step: The update step replaces the even elements of the next step with the average of the previous step. These results in a smoother entry (even an element) for the next wavelet step conversion. Track the update step of the predicted phase. So in calculating the average, the update phase should work on differences stored in odd elements:
19 A low pass filter and a high pass filter are made by filtering each pair of successive silhouettes in the walking cycle by applying a lift scheme with wavelet filters to the temporal axis of a walk sequence that includes special frequency range data.
To display a pair of temporary low and high subsets resulting from filtering each pixel (x, y) in the binary silhouette s2t + 1 and even binary s2t, assuming L (x, y) and H (x, y) on the steps of lifting two by:
Predict:
𝐻𝑡(𝑥. 𝑦) =
(𝑆2𝑡+1(𝑥.𝑦)−𝑆2𝑡(𝑥.𝑦))2
(3 − 5)
Update: 𝐿𝑡(𝑥. 𝑦) = (𝑆
2𝑡+1(𝑥. 𝑦) + 𝐻
𝑡(𝑥. 𝑦)) (3 − 6)
Individual shadows S2t + 1 and even silhouette S2t bands are calculated in the same positions, sequentially. This account continues until a low-Lt sub-domain is produced and a high-sub-band Ht time.
This analysis made the two temporal gait templates in a recent time-analysis phase called (HGI) shown in Fig. 3.9. Refer to the low and high subband frames in the last time period, such as the low-subscale pedestrians and sub-subdivisions separately and use them for single discrimination. Due to the neglect of algebra, it is clear that the visible segments appear significantly in the low-scroll sub-band and the high-density.
On the other hand, this not only creates important energy in the high-time sub-bands but also disrupts the moving objects in the low temporal sub-band frames.
20
Figure.3. 9. low-range and semi-high walking models frame (Atta, et al. 2017).
The low-sub-band and the high-sub-band step layouts describe the average rate of qualities and the scaled variations of the silhouettes' energy. During the walking cycle, severally. It should be assumed that the low subset step template obtained by wavelet filters is the same as the GEI method since it represents the average total of silhouettes of human walking energy in the walking cycle.
However, in different GEI, wavelet filters can maintain temporal data in the high-sub-band walk form that contains the most important traffic energy and motion data acquired from the previous analysis phases.
An example of building low and high-subband timelines is using Haar wavelet filters used in silhouettes. Thus, the lines of Haar wavelet filters can be increased to create walking templates with long tap filters such as 5/3 wavelet filters to take a lot of time-lapse silhouettes in the walking cycle. For time-time-lapse transformations with 5/3 wavelets, similar to wavelet conversion, high-temporal subbands are placed in similar places of the odd field image S2t + 1 while low subsets are placed at even time places S2t and S2t + 2.
The lifting procedures are performed on the silhouettes in the walking cycle by estimating the silhouettes of the S2t + 1 from the even one i.e, S2t, and S2t + 2 to reach the
21 high sub-scale models. Low subsets are then calculated. The lifting phases of the 5/3 wavelet filters can be written as follows:
Ht (x,y) = S2t+1 (x,y) – 0.5[S2t(x,y) + S2t+2 (x,y)] (3-7) Lt (x,y) = S2t (x,y) + 0.25[ Ht-1(x,y) + Ht(x,y)] (3-8)
It can also be seen Eq. (4), high sub-scale frames created from 5/3 wavelet filters are bi-directional projections precipitation of silhouettes peculiar information and the same for those taken from orthogonal filters 5/3. This usually leads to expectations of much of Haar wavelet filter. Furthermore, the two-dimensional silhouette of energy, zero or 255, over the course of the walking cycle is filtered very low.
This is derived from the enhancement of the optical point of low-bandwidth frames. Moreover, the temporary low-pass subclasses produced by filters of 5/3 wavelets have gray levels more than those produced by Haar filters. To create walking templates using wavelet filters 5/3, wavelet filters are analyzed using 5/3 on the gait cycle silhouette that occurs in low bandwidth and high bandwidth frames. After one phase of analysis, low pass subbands are analyzed in the next phase by Haar filters until the sub-band range and walking models are widely taken (Atta et al., 2017).
Therefore, the use of high 5/3 filters instead of Haar in the initial phase of the time analysis leads to greater representation and a more instructive model of a low-scale platform. This technique is called for the production of two temporary schemas here at 5/3GI.
Because the most important data for walking recognition approaches the outer lines of silhouettes that store more external data with limited projection, external lines are removed instead of silhouettes. There are many edge detection methods, which can be used to remove the edges.
The main benefit of the lifting scheme is that all constructions are derived in the spatial domain. It does not require complex mathematical calculations that are required in traditional methods. Lifting scheme is simple and efficient algorithm to calculate wavelet transforms. It does not depend on Fourier transforms. Lifting scheme is used to
22 generate second-generation wavelets, which are not necessarily translation and dilation of one particular function.
Furthermore, there are different methods that can be used to derive the parameters of binary images, for example, morphological form to derive the edge of targets in the silhouette. Compared with the most existing gait recognition systems, for instance, MEI, GEI is utilized in silhouettes while, HGI and 5 / 3GI are utilizing as a contour for the production of low subband and high subband walk template of HGI and 5/3GI methods are performed on contour images.
Moreover, the 5/3GI timelines contain more time data for walking sequences than those using HGI and after 5/3GI can achieve a lot of completion from HGI. Events for this status will be described in the test section.
3.5 Dimension reduction using PCA
This large amount of information from each template increases the dimensionality of the characteristic vectors, and thus the complexity of the classification increases with the characteristic vector dimensions, which is why the accuracy is low. Thus, to reduce the dimensionality of the characteristic vectors and enhance the classification, PCA was utilized to decrease the dimensions of the input data. The eigenvectors matching to the largest eigenvalues values of the covariance matrix, and the information is then calculated onto those regions is performed in the gallery (Swets et al. 2001). The entire number of distinctive vectors made from each category in the gallery collection is Ng=∑𝑁𝑑𝑖=1𝑁𝑖. PCA is used to calculate high-dimensional vectors on the value of weak dimensions that provide different value information for walking recognition.
The goal of PCA is to locate an ideal space that maintains the best difference between information and reduce dimension vector features. PCA is an unsupervised learning procedure that reduces the dimensionality of information. The directions of the information trends are discovered in the most diverse way, the eigenvectors corresponding to the largest eigenvalues of the covariance matrix, and then the information is then projected onto these directions (Shlens, 2003).
Das Choudhury et al., (2013) PCA is a method to identify patterns in data, and to display data in a way that highlights the similarities and differences between them. Because it is difficult to find data patterns in high-dimensional data, where graphics image is not
23
available, PCA is a powerful data analysis tool. Another key feature of PCA is that once these patterns are found in the data, we compress data by reducing the number of dimensions, without losing a lot of information.
The PCA algorithm consists of these steps:
Subtract the average from all of the data dimensions. The average is the average across all dimension. This produces a data set with a mean of zero.
Calculate the covariance matrix, where V(mxn) is a matrix with all input as a result of calculating the difference between two different dimensions.
Vmxn=(Vi,j,Vi,j=cov(Dimi, Dimj)) (3-9) Calculate the eigenvectors and eigenvalues of the covariance matrix.
Selection components and form a feature vector: Once the eigenvectors of the variance matrix are determined, they are arranged by intrinsic value, from high to low. This assists to sort components by importance. The number of eigenvectors we choose will be the number of dimensions of the new data set. The goal of this step is to build a feature vector (vector matrix). From the eigenvectors list, the selected objects and matrix composition are selected with them in the columns:
FV= (eig_1, eig_2……eig_n) (3-10)
Derivation of the new data set. Take the transpose feature vector to the left of the original data set, transpose it:
FinalData = OriginFV x Origin Data Adjusted (3-11)
Das Choudhury et al., (2013) where original feature vector is the matrix with eigenvectors in the columns that were transposed (the eigenvectors are now in the most important rows at the top) and Original Data Adjusted is the transposed average data (data elements are in all column, with all row holding a separate dimension).
3.6 Coefficients Description
Coefficients are utilized to define the layout proficiently. In Figure 3.10 temporary walk charts that were later renewed to the corresponding PCA application appear on different amounts of larger intrinsic values. Figure 3.10 (b) - (g) shows the low timeline
24 of the contour 5 / 3GI sub-range of the first intrinsic values 1, 15, 25, 50, 75 and eigenvalue and from entire eigenvalues individually. Between them, Figs. 3.10 (f) describe the reconstruction of the time template from the first 75 of the largest self-contained values to store the complete state of the template as if the template is the reconstruction of all eigenvalues values. Thus, a distinctive bus extending to 75 is used to illustrate each pedestrian chart.
(a) (b) (c) (d)
(e) (f) (g)
Figure.3. 10. (a) The low-sub-band gait was created using contour 5/3GI and the reverse radon conversion of the corresponding parallels to the larger (b) one, (c) 15, (d) 25, (e) 50, (f) 75, and (g) all
eigenvalues, respectively (Atta et al., 2017).
C4.5 decision tree classification algorithm.
C4.5 is a classification algorithm utilized to generate a DT. This is by controlling both the persistent and periodic features, the lost values. DT produced by C4.5. Which can be utilized for collection and are usually describe to as a statistical classifier. The DT includes nodes and branches. Every node includes issues based on one or various properties, that is, comparing an attribute value with a constant or comparing more than one property utilizing some functions. The learning data set is often called the result tree for the name of the preference tree. C4.5 is a set of algorithms to implement classifications in machine learning and data mining.
25 C4.5 is performed frequently with this following sequence.
The classification includes of 3-phases process as shown in figure 3.11: 1) Building model (Learning).
2) Evaluation model (Accuracy). 3) Use model (Classification).
Figure.3. 11. Figure 3.10 Classification phase
C4.5 is based on the percentage of information gain that is evaluated through entropy. The access ratio scale is used to determine the test features in each node in the tree. Such a measure is referred to as the property selection measure (characteristic). The best property of the information is selected as a test feature for the current node. As the following steps
1. Verify that the algorithm meets the finish standards.
2. Pick the best property according to theoretical information standards.
3. Build a resolution node based on the best property in the theoretical information. 4. Assign the data set based on the recently constructed purpose node in build resolution. 5. For all sub-datasets in assign the data set, call the C4.5 algorithm to receive a subtree (Recursive Call).
6. Add the tree taken in call the c4.5 to the analysis node in the theoretical information. 7. Repeat the tree.
Data feature
Classification
26 4. RESULTS AND DISCUSSION
4.1 Experimental Implementation
Gait-based human gender classification was done by using the set of 124 subjects including 31 individual for female, consists of 1743 silhouette images, and 93 for male consists of 6007 silhouette images of video sequences taken from the Chinese Academy of Science (CASIA) dataset B. 200 video sequences include 100 subjects for male, consists of 12087 silhouette images, and 100 subjects for female consists of 10939 silhouette images were randomly selected from the OU-ISIR Gait Database Large Population Dataset and used for gender classification.
The features that are extracted from the silhouette are retained in the vector form that points to the feature vector. Feature extraction is repeated in all image sequences of video image sequence to obtain feature vectors for all images.
For gait representation, different consecutive frames of each video sequence are processed. The human walk system analyzes the silhouette image of several spatial accuracy measures. In the representation of silhouettes, high frequencies carry detailed information about the image while low frequencies carry status information. Applying the appropriate wavelet transform can represent a powerful silhouette image because it provides a precise and unified framework for analyzing and characterizing an image on a different scale.
The lifting scheme consists of prediction step and update step. The high-pass subdomain form is created in the prediction step. In the update step, the filter subdomain is made to pass low temporary using the high pass filtered outlines from the estimated step. Low pass and high pass filter are made by filtering each pair of successive silhouette in the gait cycle by applying lifting scheme with wavelet filter to the temporal axis of the walk sequence that includes special frequency range data.
%70 of the input data was used for training and the rest was used for testing. PCA was performed to reduce the dimension from 168,960 to 47,168. The performance of the proposed gender classification using gait pattern based on lifting 5/3 filters technique was evaluated. It is used on an arrangement of contour image removed from the relating gait silhouette sequence.
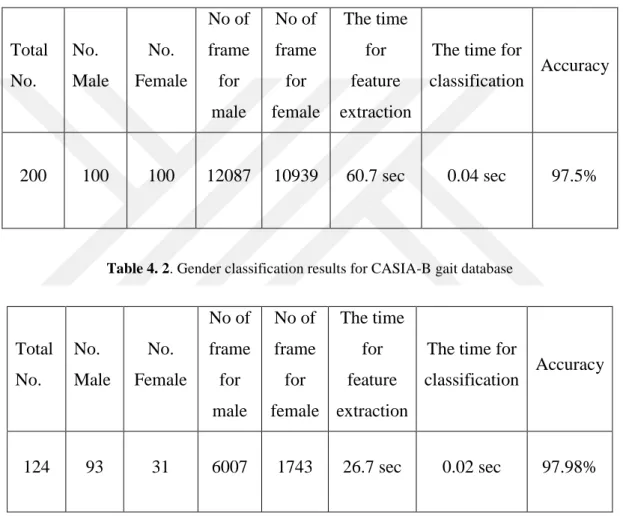
27 An algorithm which includes PCA and C4.5 was implemented and the testing of performance measures using OU-ISIR Gait Database Large Population Dataset and CASIA database B has been obtained. Accuracies of 97.9% for CASIA-B and 97.5% for OU-ISIR were obtained for gender classification from human gait. Summary of the gender classification results from OU-ISIR and CASIA-B are shown in Table 4.1 and Table 4.2
Table 4. 1. Gender classification results for OU-ISIR gait database large population dataset.
Total No. No. Male No. Female No of frame for male No of frame for female The time for feature extraction
The time for
classification Accuracy
200 100 100 12087 10939 60.7 sec 0.04 sec 97.5%
Table 4. 2. Gender classification results for CASIA-B gait database
Total No. No. Male No. Female No of frame for male No of frame for female The time for feature extraction
The time for
classification Accuracy
124 93 31 6007 1743 26.7 sec 0.02 sec 97.98%
Wavelet filters began to get as much help and dynamic information as they could reasonably be required from a walk sequence. Temporary filters through the lifting scheme were as it turned out to be an able expert temporal analysis structure that was used as a piece of the 3D wavelet-based video coding (Chen et al., 2004) and also in scalable video coding (SVC). In the video encoding method, wavelet filters (such as low partial timers) or long orthogonal latency, such as 5/3 wavelet filters, were implemented
28 by the lifting scheme. The lifting scheme consists of two successive advances called: an estimation step and an updated step. The high-pass subdomain form is created in the estimation step, while in the updated step, the filtered subdomain is made to pass low temporarily using the high-pass filtered outlines from the estimated step.
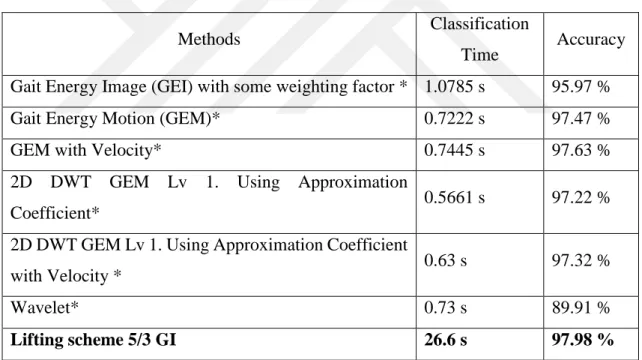
Lifting scheme 5/3 wavelet filters with 2D Discrete Wavelet Transformation base was used to analyze and compare results. The result is given in Table 4.3. A very interesting analysis is the classification time for each method. Each pixel represents to be the feature we want to characterize. The label will cost higher if the image size is larger. GEM is a smaller image compared to GEI because the GEM only takes the energy part, not every part of the image. Using the rounding details in a DWT will reduce the cost of the classification because the image size is smaller than its size four times at level 1. The smaller image reduces the resolution.
Table 4. 3. Gender classification results obtained from CASIA. The present study result is given in bold.
Methods Classification
Time Accuracy Gait Energy Image (GEI) with some weighting factor * 1.0785 s 95.97 %
Gait Energy Motion (GEM)* 0.7222 s 97.47 %
GEM with Velocity* 0.7445 s 97.63 %
2D DWT GEM Lv 1. Using Approximation
Coefficient* 0.5661 s 97.22 %
2D DWT GEM Lv 1. Using Approximation Coefficient
with Velocity * 0.63 s 97.32 %
Wavelet* 0.73 s 89.91 %
29 4.2 Gait cycle detection and feature extraction
We used lifting scheme 5/3 wavelet for decomposition and GEI to extract the feature for gender classification. This approach gives better results on my data with even higher noise due to illumination and surface effects and calculate the foreground silhouette pixel from half lower silhouette when two legs are farther apart and closest together respectively as show in figures 4.1-4.2 and 4.3.
Figure.4. 1. Construct temporal templates for female using GEI CASIA database.
A b
30
Figure.4. 2. Construct temporal templates for male using GEI CASIA database
E F G H I J
Figure.4. 3. Construct temporal templates male and female using GEI for OU-ISIR database.
The number of frame in video sequence raw data and calculation of the gait cycle and feature extraction from every video sequence are shown in Figure 4.4-4.7. The gait cycle is between the two adjacent minima.
A B
31
Figure.4. 4. Cue Walk Period – The number of intensity pixels from the lower half of the silhouettes for female in CASIA dataset
Figure.4. 5. Cue Walk Period - The number of intensity pixels from the lower half of the silhouettes for male in CASIA dataset
32
Figure.4. 6. Cue Walk period – the number of intensity pixel from the lower half of the silhouette for female in OU-ISIR dataset
Figure.4. 7. Cue Walk Period - The number of intensity pixels from the lower half of the silhouettes for male and female in OU-ISIR dataset
33 The average rate of recognition of the contour template technique is higher than the others techniques based on the silhouette image of the carry condition improvement of the accuracy of the contour 5/3 GI compared to other techniques. Figures 4.8-4.12 show wavelet application of the contour technique.
Figure.4. 8. wavelet filters applied on the contour images. L: Low pass filter result; H: High pass filter result
H
H
M d im en sio n M d im en sio n N dimension N dimensionL
N dimension N dimension M d im en sio nL
M d im en sio n34
Figure.4. 9. Constructing Low and High pass subband temporal template 5/3 wavelet lifting scheme
Figure.4. 10. Predict and update subband temporal template 5/3 wavelet lifting scheme
M d im en sio n M d im en sio n N dimension N dimension
L
M d im en sio n M d im en sio nL
N dimension N dimensionH
H
M d im en sio n N dimensionL
L
H
M d im en sio n N dimension M d im en sio n N dimension M d im en sio n N dimension35
Figure.4. 11. Constructing subband temporal template PCA
Figure.4. 12. Compressed subband temporal template PCA
The gait recognition task was performed on an ordinary laptop with Intel i5 processor, 8 GB RAM, and windows 64-bit operating system.
The proposed feature extraction algorithm and classification algorithm and datasets for gender classification as shown in table 4.4. It is important to note that part of the OU-ISIR database was used in this thesis. The gender-classification has one characteristic achieves a feature classification accuracy. One possibility to improve the accuracy of gender classification is to combine several features together to classify multi-factor for gender classification. Multiple multi-factors mean using several features together. Combined a movement and appearance for gender analysis and have received different discrimination rates respectively.
M d im en sio n N dimension M d im en sio n N dimension
36
Table 4. 4. comparison of gender classification with previous researchers.
Dynamic body feature
Feature extraction algorithm
Classification
algorithm Datasets Accuracy
Gait GEI* SVM CASIA 87%
Gait PCA* GMM OU-ISIR 92.2 %
Gait HOG* Nonlinear SVM OU-ISIR 85.49 %
Gait Lifting scheme 5/3
and PCA C 4.5 OU-ISIR 97.5 %
Gait Lifting scheme 5/3
and PCA C 4.5 CASIA 97.98 %
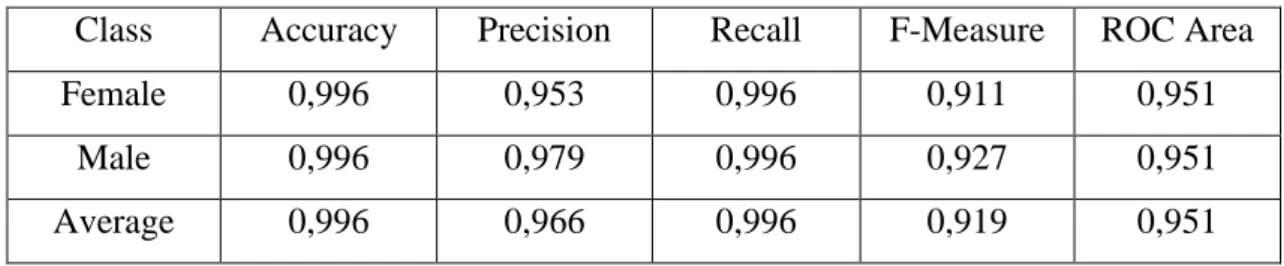
CASIA and OU-ISIR data sets were classified by different machine learning methods according to 10-fold cross validity test. Classification methods such as Functinal Tree (FT), K-nearest neigbour (KNN), Random Forest (RF) and Bayes Net (BN) were used. The success rates obtained are shown in the table 4.5 Looking at the table 4.6, the best results are shown with RF.
Table 4. 5. The best results with RF
Data FT Knn RF BN
CASIA 92.98 87.4659 92.5881 87.7415
OU-ISIR 91.54 96.256 92.0909 85.9773
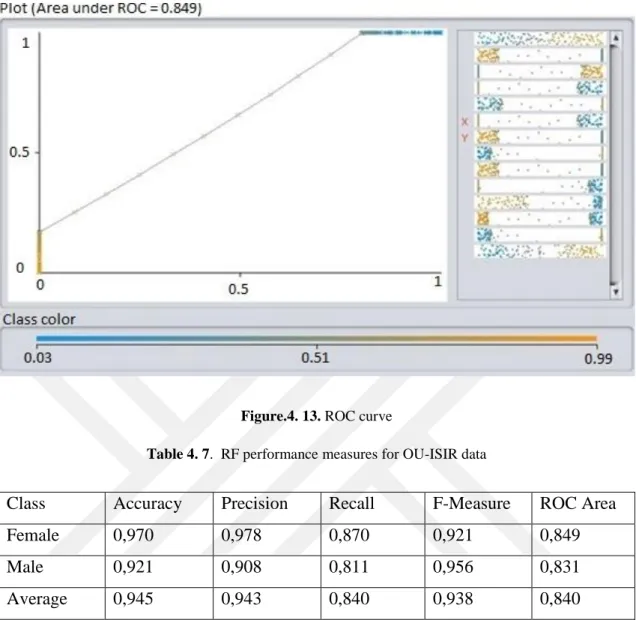
By selecting the best classification method, the performance criteria are shown in the table 4.6. In addition, ROC curves are given figure 4.13.
Table 4. 6. RF performance measures for CASIA data
Class Accuracy Precision Recall F-Measure ROC Area
Female 0,996 0,953 0,996 0,911 0,951
Male 0,996 0,979 0,996 0,927 0,951
37
Figure.4. 13. ROC curve
Table 4. 7. RF performance measures for OU-ISIR data
Class Accuracy Precision Recall F-Measure ROC Area
Female 0,970 0,978 0,870 0,921 0,849
Male 0,921 0,908 0,811 0,956 0,831