Linear and Nonlinear Electrochemical Impedance Spectroscopy
Studies of Li/SOCl
2Batteries
Mohammed Ahmed Zabara, Can Berk Uzundal, and Burak Ulgut ∗,z
Department of Chemistry, Bilkent University, 06800 Ankara, Turkey
Performing accurate, linear and stable Electrochemical Impedance Spectroscopy of Li/SOCl2based batteries (and more generally, all primary batteries) is challenging due to the lack of a (well-defined) charging reaction. The difficulty stems from irreversible operation chemistry (compromising stable operation) and the inconsistent anode passivation of the cell. The very scarce literature examples lack proper measurement protocol and accurate EIS data for Li/SOCl2that can be modeled. In this study, we demonstrate how these challenges can be overcome by performing Galvanostatic-EIS in discharge mode and investigate the details of how experimental parameters influence not only the measurement, but also the cell itself. We present linear and stable data that is compatible with the Kramers-Kronig relations in frequency ranges as wide as 10 kHz to 1 mHz for fully charged to fully discharged cells. Moreover, we utilize Harmonic Analysis to study the nonlinearities in the measurement and further show that the passivation of the anode is a major cause for the nonlinearities.
© 2019 The Electrochemical Society. [DOI:10.1149/2.1231904jes]
Manuscript submitted January 7, 2019; revised manuscript received February 15, 2019. Published March 13, 2019.
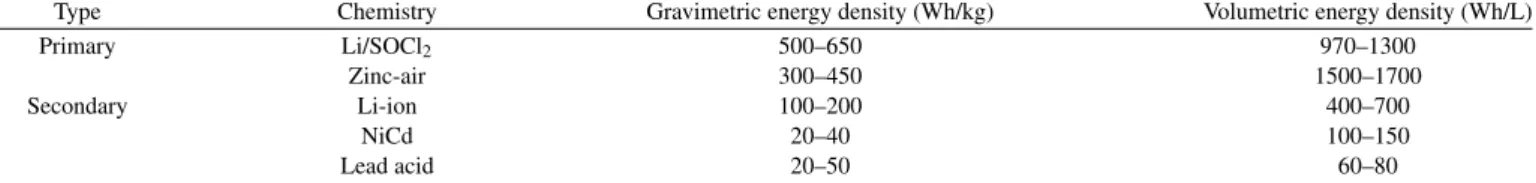
Batteries are getting more center-stage attention across all fields of electronics due to the ever growing needs of current and next genera-tion devices in not only consumer electronics but also in transportagenera-tion, defense and renewable energy harvesting.1,2In designing the battery pack for devices, the main considerations are power and energy den-sities of the available options. Though rechargeable batteries are the main sources used, primary (i.e. non-rechargeable) batteries are the main electrochemical energy storage devices for applications where recharging is impractical or impossible. This is due to the fact that the currently available rechargeable chemistries do not possess the energy densities that the primary batteries offer. The volumetric and gravimetric energy densities of commonly used primary and secondary batteries are summarized in TableI. Due to the importance of volume and weight limitations, military, aerospace and specialty emergency service applications are heavily dependent on primary batteries with different chemistries.3–6Among primary chemistries, Lithium Thionyl Chloride (Li/SOCl2) is the most commonly used due to its high energy
density, high operating cell voltage, voltage stability over 95% of the discharge, large operating temperature range (−55 to 70°C) and long storage life.6–8
In Li/SOCl2batteries, anode consists of a Li foil, cathode consists
of a porous carbon, and electrolyte is a solution of LiAlCl4(Lithium
Aluminum Tetrachloride) dissolved in SOCl2 (Thionyl Chloride).3
The discharge reactions are:
Li(s)→ Li+(dis.)+ e− Anode reaction
4Li+(dis.) + 2SOCl2(l ) + 4e−→ 4LiCl(s)+ SO2(g)+ S(s)
Cathode reaction 4Li(s)+ 2SOCl2(l )→ 4LiCl(s)+ SO2(g)+ S(s) Overall reaction
The overall reaction shown above leads to a highly stable battery volt-age. All the reactants and the products are solids or liquids which possess a unity activity except SO2which escapes the cell with very
small leftover partial pressure.7The resulting Nernst equation is then a constant cell potential as long as these reagents exist and a sudden crash when the limiting reagent is exhausted.16,17
The reaction on the cathode is irreversible because of the formation of the gaseous SO2in addition to the complicated forms of
elemen-tal sulfur. Spectroscopic studies for the formed species with applied currents in the charging direction showed complex reactions. Under conditions where Li and SO2is present, mainly SO2Cl2, SCl2or S2Cl2
are shown to form. Under other conditions where Li amount is small, ∗Electrochemical Society Member.
zE-mail:[email protected]
SOC12will be oxidized initially, producing C12which leads to the
for-mation of SO2Cl2.18,19The charging products are all electrochemically
inactive, in addition to being hard to predict.
Electrochemical Impedance Spectroscopy (EIS) is an important analytical tool that is heavily used in battery analysis20–23along with corrosion, paints, coatings, fuel cells, etc. It is based on an applied excitation with an oscillating voltage or current and measurement of the resulting response in a wide frequency range. From the impedance measured as a function of frequency, individual properties of sub-components can be extracted due to their distinctly different time constants. Valuable information regarding charge transfer resistance, double layer capacitance, mass transport and details of various inter-faces can be separately obtained by such analysis. Therefore, the main advantage of EIS stems from its access to a wide range of timescales. Furthermore, EIS only requires the two terminals of the battery, there-fore, it can gather information about individual interfaces without dis-assembling the battery. Lastly, since EIS is performed around the equi-librium point with small and typically symmetric perturbations, it is non-destructive.
The obtained EIS data has to be linear, stable, causal and finite.20,21 Linearity is achieved in electrochemical systems, which are nonlinear by nature, through minimal deviations from the equilibrium state of the system. Stability is generally ensured by finishing the experiment within a timeframe of stability for the sample. These two properties must be taken into consideration while setting the parameters of the EIS measurementa. Mathematically, Kramers-Kronig transforms are ways to check for all criteria mentioned above. Though it is impossible to apply the fundamental relations directly due to the finite frequency window of measurements, there are methods developed that enable verifying the compatibility.24–26Without an impedance spectrum that is compatible with Kramers-Kronig relations, neither equivalent cir-cuits, nor any other model can fit the data properly, hence, any param-eters obtained from the data will not be valid.
Accurate and Kramers-Kronig compatible EIS datasets are not only crucial for developing a proper understanding of the battery proper-ties, but also for properly predicting their voltage responses under load as was shown in a study by our group and others.27–29Since the pre-dictions of the algorithms are heavily dependent on the quality of EIS data, accurate and linear EIS data is of utmost importance when it comes to modeling the voltage of the battery system.
Accurate EIS measurement of Li/SOCl2primary batteries involve
several challenges. As mentioned above, EIS is typically performed by exciting the system symmetrically with either a current or potential perturbation around the equilibrium point and measuring the response to such excitation. For batteries, in particular, this requires the
ap-aAs long as the measurements are not experimental artifacts or noise, the data is causal and finite.
A812 Journal of The Electrochemical Society, 166 (6) A811-A820 (2019)
Table I. Gravimetric and volumetric energy densities of commercially available batteries.9–15
Type Chemistry Gravimetric energy density (Wh/kg) Volumetric energy density (Wh/L)
Primary Li/SOCl2 500–650 970–1300
Zinc-air 300–450 1500–1700
Secondary Li-ion 100–200 400–700
NiCd 20–40 100–150
Lead acid 20–50 60–80
plied perturbation signal to oscillate between charge and discharge constantly at different frequencies. For Li/SOCl2batteries, as the
ex-periment proceeds, the discharge side of the exex-periment decreases the state-of-charge (SoC), where the charge side of the experiment causes undefined reactions which were mentioned above. Therefore, the cur-rent on the discharge side leads to non-stationarity and the curcur-rent on the charge side causes nonlinearity in the EIS data. The protocol that the current manuscript employs to solve this problem is to keep the complete excitation current waveform in the discharge side for linearity and as small as possible for stationarity.
Further, in Li/SOCl2(like in most batteries), a spontaneous
chem-ical phenomenon taking place at the surface of the highly active metal Li causes further complications in EIS measurement. Li reacts with the solvent SOCl2as soon as it comes into contact, resulting in the
formation of a passivation layer that is called the Solid Electrolyte In-terface (SEI). Studies showed the formation of a compact layer right at the electrolyte/Li interface followed by a thicker and denser layer which slowly forms during storage.7,30–33This two layer structure pas-sivates the anode from further reactions with the electrolyte and helps in its stabilization. However, the passivation layer has disadvantages in the performance of the battery. It causes high internal impedance and results in self discharge and voltage delays.34,35Unlike the SEI in secondary Li ion batteries, the thicker part of the passivation layer in Li/SOCl2demolishes as the cell discharges, allowing the Li to reach
the electrolyte, and re-forms again at open circuit. In order to mitigate the negative effects of the SEI layer on the EIS measurement, a sig-nificant constant discharge current is required to ensure that the SEI layer is demolished and does not reform throughout the measurement. In the literature, studies have attempted to obtain EIS of Li/SOCl2
cells either potentiostatically or galvanostatically.bTo the best of the authors’ knowledge, the first publication regarding an impedance study for a complete cell was done by Hughes et al.36 The conditions in which the impedance measurement was performed was mentioned to be galvanostatic in the range of 10 kHz to 1 Hz. Neither values of the excitation signal, nor any DC level were specified. Impedance data were presented for the cell at various SoC. However, the presented impedance data suffers from clear deviations from ideal behavior in low frequency regions. The presented equivalent circuit model failed to fit the experimental data at the low end of the rather narrow frequency window.
Other studies in the literature utilized P-EIS for investigating the impedance of Li/SOCl2. Popov et al. studied the impedance of the
passivation layer at different storage times.37The voltage excitation was±5 mV in amplitude in a frequency range of 10 kHz to 10 mHz. Another study done by Walsh et al. studied the impedance of the passivation layer to predict the voltage drop in the cell.38±10 mV excitation in a frequency window of 20 kHz to 50 mHz was employed. The impedance data presented in both studies were dominated by the impedance of the passivation layer and showed an increase as the degree of passivation increased.
It should be mentioned that P-EIS cannot provide accurate impedance results for Li/SOCl2cell since any positive deviation from
the equilibrium would cause undefined reactions that do not represent the operation chemistry of the cell. Moreover, in P-EIS, there is no
bGenerally, in potentiostatic-EIS (P-EIS) the voltage is modulated around an equilibrium value and the resulting current is measured. On the flip side, in galvanostatic-EIS (G-EIS) the current is modulated around a zero and the resulting voltage is measured.
known procedure for getting rid of the passivation layer. The passiva-tion reacpassiva-tion would constantly take place during the measurement.
In order to obtain accurate EIS for Li/SOCl2system, two
require-ments must be met. First, the impedance measurement has to be done in the discharge mode to ensure that the current does not venture into the ill-defined, irreversible charge reactions of the system. Second, due to the passivation affecting the cell voltage responses, passiva-tion layer should be removed before the impedance measurement and should be prevented from re-forming while the measurement is taking place. These requirements can be satisfied by performing G-EIS under discharge. The excitation Alternating Current (AC) signal is applied along with a negative Direct Current (DC) offset which ensures that no charging currents are imposed on the system. The value of the dis-charging DC offset is also adjusted to a value that prevents formation of the passivation layer during the measurement. This method have been used in the literature to study fuel cells and other electrochemi-cal systems20c.
In all of the obtained data compatibility with Kramers-Kronig re-lations were checked using the implementation within the Echem An-alyst Software of Gamry Instruments.39This method effectively fits the data to numerous Voigt elements that are combined in series.
In cases where the data comes out to be incompatible with Kramers-Kronig relations, we utilized Harmonic analysis, which involves the analysis of the voltage response signal in the frequency domain, to investigate the nonlinear behavior in Li/SOCl2cells. Harmonic
anal-ysis has been used in the literature to investigate the nonlinear char-acters of different electrochemical systems. Large perturbation exci-tation is used to obtain insight about the nonlinear processes in the studied system by the analysis of the response signal as a function of frequency.40,41Darowicki et al. published a review which described the application of the harmonic analysis to study activation reactions, sim-ple diffusion systems and corrosion systems.42They emphasized that harmonic analysis can be very useful in studying the kinetics of elec-trode processes simultaneously with EIS. Later Bosch et al. developed a new technique named Electrochemical Frequency Modulation which utilizes two sine waves of different frequencies as excitation and ana-lyzes the response in frequency domain for nonlinear characteristics.43 They showed that this technique can be used for instantaneous cor-rosion rate measurements under various corcor-rosion conditions. Other corrosion studies utilized harmonic analysis to study the rate of cor-rosion for different systems.44,45
Harmonic analysis was also utilized to investigate nonlinear processes in fuel cells. It was used for the diagnosis of dehydration, flooding and CO-poisoning processes as well as monitoring oxygen concentration and operation status of PEM fuel cells.46,47
More recently harmonic analysis was used for Li-ion batteries. Krewer et al. investigated the relation of the excitation signal ampli-tude to the observed harmonics for different types of Li ion batteries. Temperature dependency and aging of the battery was related to the ob-tained harmonic responses. Moreover, studies on Li plating showed the ability of its detection utilizing harmonic analysis along with EIS.48,49 In another study, Schwartz et al. utilized harmonic analysis for LiNMC batteries with moderate-amplitude excitation signals. They presented second harmonic spectra for the response signal at different SoCs and with aging of the cells along with the EIS. They showed how second
cFor Fuel Cells, it should be noted that a constant applied discharge current is the steady-state due to the constant supply of fuel.
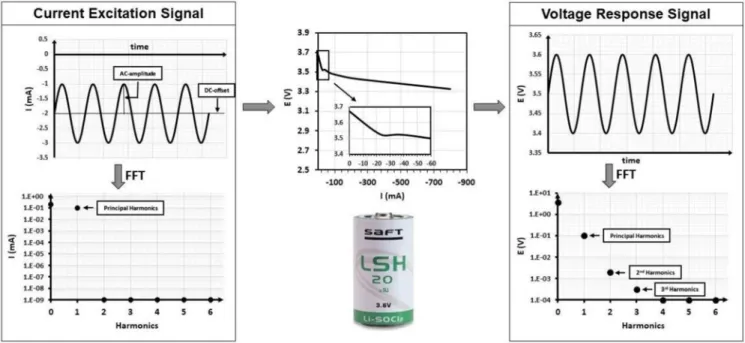
Figure 1. Galvanostatic-EIS while discharge method and harmonic analysis. Time and frequency domain of the current excitation signal (left) and voltage response signal (right).
harmonic at the low frequency regions can provide information about diffusion and charge transfer symmetry.50
In the present report, we used harmonic analysis to study the pas-sivation behavior in Li/SOCl2batteries. We will show that passivation
as a nonlinear process is directly related to higher harmonic responses in the EIS which allow for deeper investigation of passivation. To the authors’ knowledge, there are no previously reported examples of harmonic analysis on primary batteries.
Experimental
Cells.—Commercially available Li/SOCl2(SAFT-LSH20) D-size
spiral cells17and (SAFT- LS 14500)16AA-size bobbin cells were used in all measurements. The D-size spiral cell has 13Ah capacity with 3.67V open circuit potential and the AA-size bobbin cell has 2.6Ah capacity with 3.67V open circuit potential. The Maximum Recom-mended Continuous Currents (MRCC) were 1800mA and 50mA for D-size and AA-size respectively. The negative DC offset (discharge currents) were assigned not to exceed these MRCC values.
Methods – galvanostatic EIS while discharge.—EIS were
ob-tained using Gamry Interface 1000E galvanostatically under dis-charge, in a frequency window of 10kHz to 1mHz with 10 points per decade or 5 point per decade for D-size cells and a frequency window of 10kHz to 4mHz with 5 points per decade for AA-size cells. The measurement script was modified to simultaneously mea-sure the impedance of the system and record the time domain voltage response at each frequency (Appendix A). The voltage responses at each frequency were then used for the harmonic analysis. G-EIS while discharge was achieved by adding a negative DC offset to the excita-tion signal as shown in Figure1. The value of the negative DC offset and the AC excitation were adjusted to ensure no charging currents are imposed on the cell.
In order to demolish the passivation layer, a DC discharge of rel-atively high magnitude needs to be applied. This procedure was nec-essary to obtain accurate impedance of the cell without the adverse effects of the passivation layer.51The cell was discharged with a suit-able current until the voltage was stabilized. The G-EIS measurement was conducted directly after removing the passivation. Furthermore, a 30 second hold period was applied between the frequencies with the
negative DC offset of the measurement to prevent passivation layer formation during the measurement.
Harmonic analysis.—The voltage response signals were analyzed
in the frequency domain at each measured frequency to check for harmonics. This was achieved by Fast Fourier Transform (FFT) of the voltage response signal from the time domain to the frequency domain. The Fourier transforms were done within SciPy v0.15.1 fft module with Spyder v2.3.5.2 as the developing environment.
Figure1shows a generic frequency domain description of both current excitation and voltage response signals, both obtained in a non-averaged fashion in the time domain. After FFT, both signals are plotted as a function of the harmonic index. The zeroth position cor-responds to the DC offset followed by the first, second and third har-monic etc. The first harhar-monic is typically referred to as the principal. The principal harmonic on the current corresponds to the AC excitation signal. The other harmonics have negligible values that correspond to the noise level of the instruments’ signal generator. In a particular case where a nonlinear voltage response is observed, the voltage response shows a DC offset at the zeroth position corresponding to the voltage of the battery as well as the expected principal harmonic, in addi-tion to finite amplitudes over the noise floor of the instrument at the higher harmonics. The higher harmonics are the result of nonlinear behavior of the system and their presence preclude a Kramers-Kronig compatible EIS measurement. We use such analysis to further validate our obtained spectra and to study the passivation phenomena on the anode.
Results and Discussion
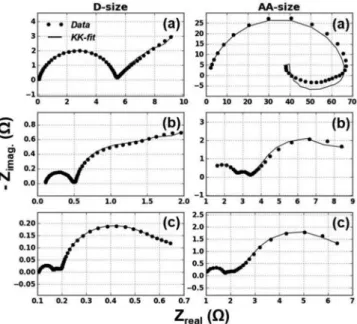
G-EIS of Li/SOCL2while discharging.—Performing G-EIS un-der discharge results in different impedance spectra as a function of varying negative DC offsets. Figure2shows the Nyquist diagrams of the impedance of D-size and AA-size Li/SOCl2at three different DC
offsets. The frequency range is between (10 kHz – 1 mHz) for the D-size cell while (10 kHz – 4 mHz) for AA-size cell.
In Figure 2the top two diagrams (shown in a) are for low off-set measurements with (−2mA DC, 1mA AC) for D-size cell and (−0.5mA DC, 0.2mA AC) for AA-size at 100% SoC. The middle two diagrams (shown in b) are for moderate offset (−10mA DC, 5mA AC) for D-size and (−5mA DC, 2mA AC) for AA-size cell at 100%SoC.
A814 Journal of The Electrochemical Society, 166 (6) A811-A820 (2019)
Figure 2. Nyquist diagrams of LiSOCl2D-size and AA-size cells while dis-charge with three DC offsets. D-cell (DC offset, AC excitation): a) (−2 mA, 1mA), b) (−10 mA, 5mA) and c) (−50 mA, 5mA). AA-cell (DC offset, AC excitation): a) (−0.5 mA, 0.2mA), b) (−5 mA, 2mA) and c) (−10 mA, 2mA).
The bottom diagrams (shown in c) are for high offset measurements with (−50mA DC, 5mA AC) for D-size and (−10mA DC, 2mA AC) for AA-size cell at 98% SoC. These values for the DC offsets and the current excitations were assigned by trial-and-error. Series of experi-ments were done to determine the best parameters which resulted in linear and stable EIS. Kramers-Kronig compatibility and the presence of second and higher harmonics were the tests used for the validation of the used parameters.
In order to study the effect of the passivation layer on the impedance, the layer was not treated for the low DC offset measure-ments (Figure2a) and was treated by discharge prior to EIS measure-ment for the other two with higher DC offset measuremeasure-ments (Figures2b and2c). There is a clear difference in the impedance characteristics among the measurements with and without treatment for the passi-vation layer for either cell. This difference can be related to the high impedance of the passivation layer which dominates over other pro-cesses.
The Nyquist diagrams for the passivated cells (Figure2a) show comparatively larger impedance values than the depassivated ones (Figures2b and 2c) with Kramers-Kronig incompatible regions at the lower frequencies. The regions that are incompatible with the Kramers-Kronig relations can be due to the nonlinearities or insta-bilities caused by the passivation layer. However, the high frequency region is compatible with the Kramers-Kronig relations for all cases. Treatment of the passivation layer by discharge before the measure-ment causes a decrease in the impedance values as can be seen from Figure2. Applying higher DC offsets during the measurement was necessary to prevent passivation layer formation during impedance measurement. Nyquist diagrams for the case of no passivation and moderately higher offsets are shown in Figure2b. The compatibil-ity with Kramers-Kronig transform is better for these offsets but still deviate at the very low frequency regions. This deviation shows non-linearity or instability effects of the passivation layer that forms during measurement at this frequency region. Unlike the passivated cells (Fig-ure2a), the Nyquist diagrams for the depassivated cells (Figures2b and2c) show more than one time-constant region that is compatible with the Kramers-Kronig relations.
Increasing the magnitude of the DC negative offset causes the ap-pearance of three time-constants and shows excellent compatibility with the Kramers-Kronig relations for the full frequency range as
shown in Figure2c. The first semicircle at the high frequency region between 10kHz and 250Hz, the middle semicircle at mid frequencies between 250Hz and 1Hz, and the third semicircle at the low frequency region between 1Hz to 1mHz. These three semicircle could not be re-solved in the previous measurements due to the dominant passivation effects.
In order to understand the characteristics of the three displayed time constants, we investigated the change in impedance at different SoCs. We also employed equivalent circuit models to fit the obtained impedance with proper equivalent circuit components and studied the changes with SoC. The changes can enable us to make speculations about the nature of these three semicircles and their relations to the chemistry of the cell.
Figure3shows the EIS vs. %SoC for Li/SOCl2(100%–20% SoC)
D-size cell and (100% - 45% SoC) AA-size cell. D-size cell mea-surements were done with (−50mA) DC offset and (5mA) AC while AA-size were with (−10mA) DC offset and (2mA) AC excitation. The frequency range was from 10 kHz to 1 mHz for D-size and 10kHz to 4mHz for AA-size with 5 points/decade for both. D-size cell was discharged with (−300 mA) and AA-size with (−50mA) between the measurements to reach the desired %SoC. These discharge current values allowed for the discharge of the D-size cell until 20%SoC and 45%SoC for the AA-size cell. Discharging the cells further resulted in a fast voltage drop below 3.0V indicating the fully discharged state of the cells.
It can be seen from Figure3that for both D-size and AA-size cells, the three time constants appear at all SoCs with differences in size at different SoCs. At 100% SoC the first semicircle at the high frequency region is the largest which shrinks as the SoC decreases. The second semicircle at the middle frequency region on the other hand, is the smallest at 100% SoC and grows by discharging the cell. The size of the third semicircle stays almost constant and decreases at the lower SoCs.
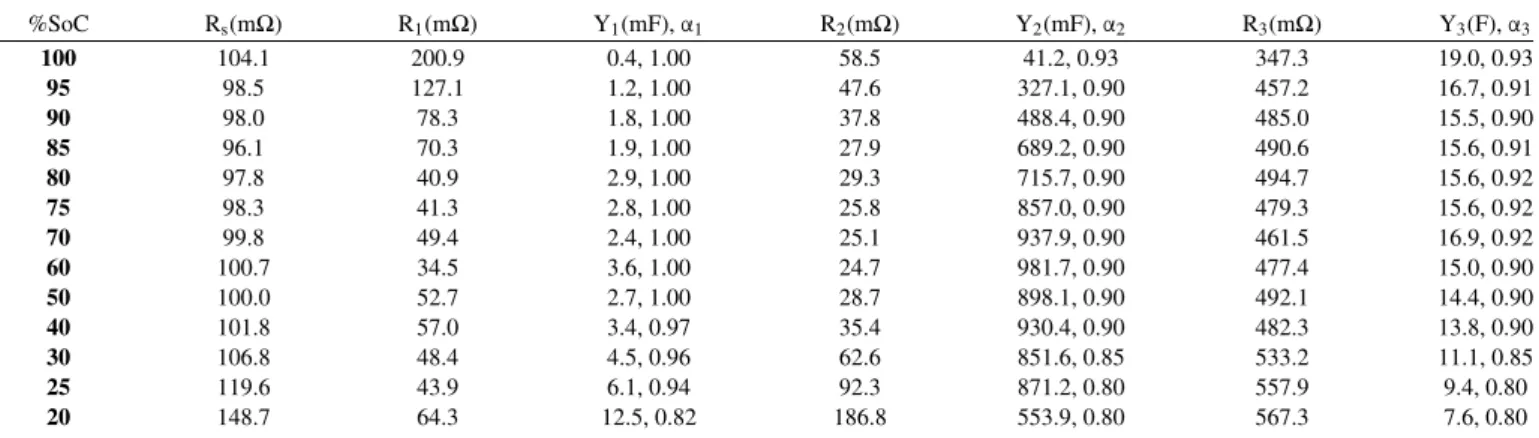
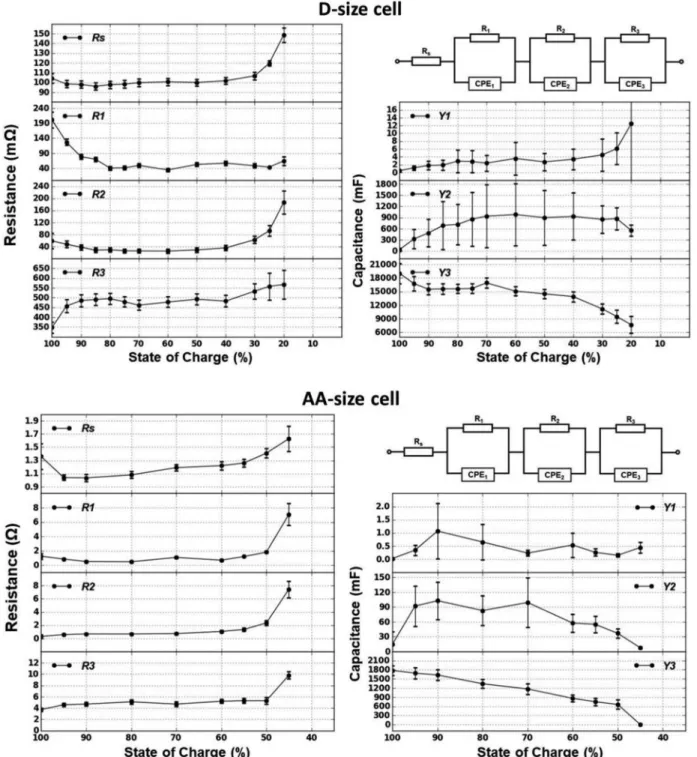
For equivalent circuit modeling, a three time-constant model shown in Figure4was employed for all SoCs of both cells. The values of the model components are listed in TablesIIandIII. Figure4shows the behavior of the model components vs. SoC with their errors.
Starting from the fully charged state, the electrolyte resistance of the D-size cell was around 100mΩ until 40% SoC which then gradually increased up to 150mΩ at 20% SoC. In the case of the AA-size cell the resistance was around 1.1Ω at the early SoCs and similarly increased to 1.6Ω after 60% SoC. This increase is expected by the depletion of the electrolyte with the discharge of the cell and accumulation of the reaction products.
The values of the parallel resistance of the first semicircle, which lies at the high frequency region, decreases at the first stages of dis-charge and later shows a constant behavior. At the same time the capacitance increases as the cell discharges. This behavior can be re-lated to the compact Solid Electrolyte Interphase (SEI) at the anode which degrades as the cell is discharged, resulting in the drop in the resistance and increase in the capacitance.
On the other hand, the values of the third semicircle, which is found in the low frequency region, shows an increase in the charge transfer resistance and a decrease in the capacitance with discharging the cell. Moreover, the capacitance shows larger values than the other two semicircles. This behavior can be related to the highly porous carbon cathode which adsorb the products of the cell reaction as the cell discharges. The cathode surface area decreases as a result of the adsorption causing a decrease in the capacitance.
Finally, the middle semicircle which shows a gradual decrease fol-lowed by an increase in its parallel resistance and an increase in the capacitance followed by gradual decrease, can be related to the Li anode. The consumption of Li as the cell discharges causes a small decrease in the charge transfer resistance at the earlier stages. As the consumption continues, small amounts of Li is left at the later stages resulting in an increase in the charge transfer resistance. The capaci-tance on the other hand, increases due to the increase in the Li mor-phology as the cell discharges. The increase in mormor-phology causes high surface area and thus higher capacitance. However, as the cell
Figure 3. Nyquist diagrams for Li/SOCl2at different SoCs with Kramers-Kronig compatibility for D-size cell and AA-size cell.
discharges Li quantity decreases resulting in the observed capacitance decrease.
Harmonic analysis.—In performing harmonic analysis, we first
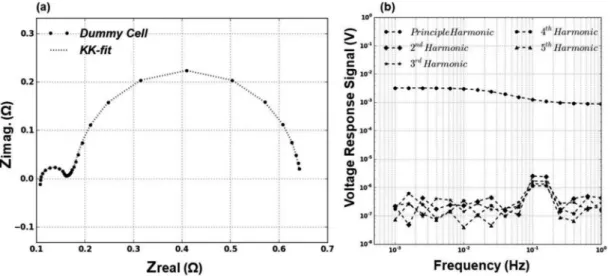
ensured that there are no nonlinear contributions from the instrument or the applied excitation signal. This was achieved by constructing a dummy cell with the equivalent circuit components that are cho-sen to be as close as possible to the fit results of the D-size cell at 80% SoC. The dummy cell composed of one resistance connected in series to three resistor and capacitor in parallel combinations. G-EIS was performed with the same parameters used for the D-size cell and the harmonics of the voltage response signals were analyzed. The re-sulting EIS is shown in Figure5a. As can be seen from the Nyquist diagram, the dummy cell impedance resembles the Li/SOCl2 with
three distinctive regions. The harmonics of the voltage response sig-nal is also shown in Figure5bin which only the principal harmonic occur between (10−3 – 10−4V) with other harmonics at a negligibly low level between (10−6– 10−7V).
This result shows that there are no harmonics coming from the instrument or as a result of the amplitude of the applied excitation signal when the sample is linear. The distinction between the harmonic spectra of the dummy cell and the ones shown in Figure6for the Li/SOCl2 cells is the higher noise level. The higher noise level is
expected due to the electrochemical reactions taking place during the discharge of the cell which does not exist in the passive components of the dummy cell.
Harmonic analysis of the voltage response signals for passivated and depassivated D-size and AA-size cells are presented in Figure6. Harmonic spectra for measurements in which the cell is passivated are shown in Figure6a. Spectra for measurements with passivation treated cells and with moderate and high negative DC offset are shown in Figures6band6crespectively.
It should be mentioned that the change in the voltage of the cells during the measurement due to the applied DC offset was not enormous. This is related to the unique chemistry of the Li/SOCl2 which shows very stable voltage throughout discharge.
Considering the entire spectrum the DC Voltage difference between the beginning and the end of the measurement with low DC off-set (i.e. where passivation layer is present) was 50mV for D-size and 30mV for AA-size cells. The same for the passivation treated cells with moderate DC offset(when passivation layer reforms) was 70mV for D-size and 30mV for AA-size cells while less than 2mV drift was observed for the high DC offset(no passivation layer) measurements.
When a single frequency is considered, voltage drifts of the mea-sured voltage signal at 4 mHz for all measurements also show small
Table II. Parameters of the equivalent circuit model between 100 – 20%SoC for D-size.
%SoC Rs(mΩ) R1(mΩ) Y1(mF),α1 R2(mΩ) Y2(mF),α2 R3(mΩ) Y3(F),α3 100 104.1 200.9 0.4, 1.00 58.5 41.2, 0.93 347.3 19.0, 0.93 95 98.5 127.1 1.2, 1.00 47.6 327.1, 0.90 457.2 16.7, 0.91 90 98.0 78.3 1.8, 1.00 37.8 488.4, 0.90 485.0 15.5, 0.90 85 96.1 70.3 1.9, 1.00 27.9 689.2, 0.90 490.6 15.6, 0.91 80 97.8 40.9 2.9, 1.00 29.3 715.7, 0.90 494.7 15.6, 0.92 75 98.3 41.3 2.8, 1.00 25.8 857.0, 0.90 479.3 15.6, 0.92 70 99.8 49.4 2.4, 1.00 25.1 937.9, 0.90 461.5 16.9, 0.92 60 100.7 34.5 3.6, 1.00 24.7 981.7, 0.90 477.4 15.0, 0.90 50 100.0 52.7 2.7, 1.00 28.7 898.1, 0.90 492.1 14.4, 0.90 40 101.8 57.0 3.4, 0.97 35.4 930.4, 0.90 482.3 13.8, 0.90 30 106.8 48.4 4.5, 0.96 62.6 851.6, 0.85 533.2 11.1, 0.85 25 119.6 43.9 6.1, 0.94 92.3 871.2, 0.80 557.9 9.4, 0.80 20 148.7 64.3 12.5, 0.82 186.8 553.9, 0.80 567.3 7.6, 0.80
A816 Journal of The Electrochemical Society, 166 (6) A811-A820 (2019)
Figure 4. Equivalent circuit model and its components (Rs, R1, Y1, R2, Y2, R3, Y3) vs. SoC for D-size and AA-size cell.
Table III. Parameters of the equivalent circuit model between 100 – 45%SoC for AA-size.
%SoC Rs(Ω) R1(Ω) Y1(μF), α1 R2(Ω) Y2(mF),α2 R3(Ω) Y3(F),α3 100 1.36 1.26 27, 0.97 0.29 14.9, 0.75 3.7 1.78, 0.75 95 1.04 0.86 346, 0.87 0.58 91.9, 0.75 4.6 1.69, 0.79 90 1.04 0.52 1070, 0.78 0.67 102.9, 0.80 4.7 1.63, 0.80 80 1.08 0.48 654, 0.84 0.67 82.9, 0.75 5.1 1.34, 0.75 70 1.19 1.09 236, 0.89 0.72 99.2, 0.75 4.7 1.17, 0.75 60 1.22 0.70 541, 0.82 1.05 57.6, 0.75 5.2 0.86, 0.75 55 1.26 1.21 261, 0.86 1.34 55.0, 0.75 5.3 0.75, 0.75 50 1.41 1.82 152, 0.87 2.33 36.8, 0.75 5.3 0.66, 0.75 45 1.63 7.07 446, 0.75 7.44 7.7, 0.75 9.8 0.001, 0.75
Figure 5. (a) Nyquist diagram for the dummy cell measured with 5mA AC excitation, (b) Harmonic spectrum for the voltage response of the dummy cell.
values. Drift of 2.5mV was observed for both passivated cells. 3.8mV and 7.5mV were seen for D-size and AA-size cells respectively with moderate DC offset whereas less than 1mV for high DC offset mea-surement for both cells. These values were not corrected prior to FFT for the harmonic analysis.
The harmonic spectra show linear behavior for the measurements where passivation was treated and a high negative DC offset was ap-plied, see Figure6c. The response contains the principle harmonic
component at (10−3) with remaining harmonics at negligible levels (10−5) for both cells.
The nonlinear responses shown in Figure6awere obtained for both cells while maintaining a high degree of passivation. The response contained the principal harmonic accompanied with appreciable am-plitudes of the second harmonic. The remaining harmonics were at undetectable amplitudes. We refer this behavior to the passivation ef-fect on the anode. The presence of the passivation layer during the
Figure 6. Harmonics spectrum for the voltage response signal from 1Hz to 1mHz for D-size cell and from 1Hz to 4mHz for AA-size cell. (a) passivated cell(D-size: −2mA, AA-size: −0.1mA), (b) moderated DC offset (D-size: −10mA, AA-size: −5mA), (c) high DC offset(D-size: −50mA, AA-size: −10mA).
A818 Journal of The Electrochemical Society, 166 (6) A811-A820 (2019)
measurement causes nonlinear behavior which results in the appear-ance of the second harmonic.
The second nonlinear response was observed for the cells in which the passivation layer was treated before the measurement however, moderate DC offsets were applied during the measurement, see Fig-ure6b. In this case, the second harmonic shows appreciable amplitudes at the lower end of the frequency range (<10mHz) for the D-size cell and at frequencies lower than (<1Hz) for AA-size cell. This analysis shows that the moderate offset was not high enough to prevent passi-vation layer formation while the measurement is being performed.
These results show the ability of harmonic analysis as well as the accurate measurement of EIS for Li/SOCl2. They demonstrate the
ability of SEI (passivation) layer detection using the harmonic analysis accompanied with the EIS of the cell and especially highlights that the nonlinear part of the impedance response contains information regarding the SEI. Further studies are underway to gain deeper insights regarding the nature of the passivation layer formation using harmonic analysis along with EIS.
One concern about the harmonic response is regarding the drift. Voltage drift would also manifest itself in the harmonic response, es-pecially in the low frequency region. As can be seen in Figure6bfor both cells, the lower frequency harmonics are larger, slowly decaying toward the higher frequencies. This drift is due to the passivation layer forming through the experiment and is not visible in the high or low offset cases since the passivation layer is not present or always present in the high and low offset cases respectively.
Conclusions
Accurate EIS for Li/SOCl2primary batteries can only be obtained
galvanostatically under discharge. It can be achieved by applying a negative DC offset along with the AC excitation signal such that the total current is always negative. The obtained EIS data show three characteristic frequency regions. These are represented in the Nyquist diagram as three time-constants at high, moderate and low frequen-cies. Fitting the data with a proper equivalent circuit model enabled for speculations relating the EIS to the electrochemical process of the cell. Harmonic analysis of the voltage response signals showed linear behavior for the cells treated for passivation and nonlinear behavior for the passivated cells. Confirmation of such response was obtained by the harmonic analysis of a constructed dummy cell representing the impedance of the Li/SOCl2battery. These observations show the
appli-cability of nonlinear harmonic analysis to the investigation of primary batteries along with EIS. Further studies elucidating the relationships between the total harmonic content of the cell, the passivation kinetics and the overall voltage response needs to be pursued to achieve a full description of the system using both linear and non-linear EIS.
Appendix A. Measurement Script
The standard measurement script in the Gamry Framework software was modified to record the current and the voltage during a sine wave application. This involved setting up a sine wave signal and recording the raw data with the same settings as the actual EIS mea-surement. The modification to the standard Galvanostatic EIS.exp script is shown below.
;Starting from line 338
NUMBEROFCYCLES = 5 NUMBEROFPOINTS = 16 DDSCutoff = 100.0 Pstat.SetVoltage (0.0)
Output.Close() ; Close the main file, so that doesn't get corrupted if (ReadZGalv.Zfreq() gt DDSCutoff)
Pstat.SetDDSAmpl(1.41*Sac) ; Setup the sine wave application Pstat.SetDDSFreq(ReadZGalv.Zfreq()) Pstat.SetDDSEnable(TRUE) Signal = ICONST.New("SIGNAL",Pstat,IDCReq.Value(),NUMBEROFCYCLES*1.0/Freq, & 1.0/(NUMBEROFPOINTS*Freq)) ; else Pstat.SetDDSEnable(FALSE) Mysignal = VectorNew(Index(NUMBEROFCYCLES*NUMBEROFPOINTS)) VectorRLE = VectorNew(VectorCount(Mysignal)) SampleTime = 1.0/(ReadZGalv.Zfreq()*NUMBEROFPOINTS) i=0 while(i lt VectorCount(Mysignal))
MyPhase = ((i*SampleTime)*ReadZGalv.Zfreq()- Index((i*SampleTime)
& * ReadZGalv.Zfreq())) * 2.0*PI
Mysignal[i] = IDCReq.Value() + IACReq.Value()*Sin(MyPhase) VectorRLE[i] = 1
i=i+1
Signal = IARRAY.New("SIGNAL", Pstat, IDCReq.Value(), 1 , SampleTime,
& Mysignal, VectorRLE, BIASMODE_INPUT)
Pstat.SetSignal(Signal)
Curve = IVT.New ("CURVE", Pstat)
Curve.SetPlotView(0.05, "Time", IVT_Vf, 0.0, "V", "V", IVT_Im, 0.0, "I", "A") Pstat.SetCell (CellOn)
Curve.Activate() Curve.Run()
Pstat.SetDDSEnable(FALSE) Filename = Sprint(".\\LissGalv\\",Freq)
LissOutput = OUTPUT.New ("OUTPUT",Filename, "Output &File") LissOutput.Open()
Curve.Printl() LissOutput.Close() Output.Append() Pstat.SetVoltage (Sdc)
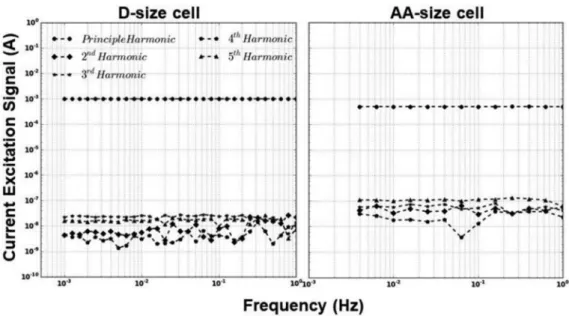
Figure B1. Harmonics spectrum for the current excitation signal from 1Hz to 1mHz for D-size cell and from 1Hz to 4mHz for AA-size cell.
This script is set to collect 5 cycles of 16 points each after the standard measurement that the script already performs. The standard script performs optimization of the hardware, in addition to the measurement. The hardware settings are preserved from the standard measurement to the additional measurement. In between every frequency, 30 seconds of stabilization time is added for equilibration. For analysis shown above, the first two cycles (i.e. 32 points) were ignored before the FFT.
Appendix B. Harmonic Analysis of the Current Excitation Signal FigureB1shows the harmonics in the frequency domain of measured current exci-tation signals for frequencies between 1 Hz to 1 mHz for D-size and between 1Hz to 4 mHz for AA-size cell. The principal harmonic which represent the AC excitation signal is shown with the resulting harmonics up to its fifth multiple. It is clear from FigureB1 for both cells that only the fundamental signal at (10−3A) is present with the others at levels that are five orders of magnitude lower (10−8A) which is the noise level of the mea-surement. The AA-size harmonics spectrum shows higher noise level than the D-size due to the smaller DC offset and AC excitation signals used. This analysis demonstrates that there cannot be any harmonics in the response signal forming as a result of our excitation signal.
ORCID
Burak Ulgut https://orcid.org/0000-0002-4402-0033
References
1. D. Larcher and J. M. Tarascon, “Towards greener and more sustainable batteries for electrical energy storage,”Nature Chemistry, 7(1). Nature Publishing Group, pp. 19, 17-Jan-2015.
2. V. Etacheri, R. Marom, R. Elazari, G. Salitra, and D. Aurbach, “Challenges in the development of advanced Li-ion batteries: a review,”Energy Environ. Sci., 4(9), 3243 (2011).
3. T. B. Reddy and D. Linden, Linden’s handbook of batteries, McGraw-Hill, 2011. 4. C. A. Vincent, “Lithium batteries: A 50-year perspective, 1959–2009,”Solid State
Ionics, 134(1–2), 159 (2000).
5. B. Ratnakumar, M. Smart, A. Kindler, H. Frank, R. Ewell, and S. Surampudi, “Lithium batteries for aerospace applications: 2003 Mars Exploration Rover,”J. Power Sources, 119–121, 906 (2003).
6. R. Gangadharan, P. N. N. Namboodiri, K. V. Prasad, and R. Viswanathan, “The lithium—thionyl chloride battery — a review,”J. Power Sources, 4(1), 1 (1979). 7. A. J. Hills and N. A. Hampson, “The Li/SOCl2cell — a review,”J. Power Sources,
24(4), 253 (1988).
8. K. M. Abraham, “Chemical and electrochemical processes in some lithium-liquid cathode batteries,”J. Power Sources, 34(2), 81 (1991).
9. C. Julien, A. Mauger, A. Vijh, and K. Zaghib, Lithium Batteries, Cham: Springer International Publishing, 2016.
10. T. R. Crompton, Battery Reference Book, Elsevier, 2000.
11. J.-S. Lee et al., “Metal-Air Batteries with High Energy Density: Li-Air versus Zn-Air,”
Adv. Energy Mater., 1(1), 34 (2011).
12. M. A. Rahman, X. Wang, and C. Wen, “High Energy Density Metal-Air Batteries: A Review,”J. Electrochem. Soc., 160(10), A1759 (2013).
13. M. M. Thackeray, C. Wolverton, and E. D. Isaacs, “Electrical energy storage for transportation—approaching the limits of, and going beyond, lithium-ion batteries,”
Energy Environ. Sci., 5(7), 7854 (2012).
14. B. Scrosati, “History of lithium batteries,”J. Solid State Electrochem., 15(7–8), 1623 (2011).
15. J. W. Choi and D. Aurbach, “Promise and reality of post-lithium-ion batteries with high energy densities,”Nat. Rev. Mater., 1(4), 16013 (2016).
16. Saft, “Primary lithium battery LS 14500 Data Sheet,” 2006. 17. Saft, “Primary lithium battery LSH 20 Data Sheet,” 2006.
18. K. Bum Soo and P. Su Moon, “Spectroelectrochemical Studies on the Reduction of Thionyl Chloride,”J. Electrochem. Soc., 142(1), 34 (1995).
19. S. Surampudi, G. Halpert, and I. Stein, “Safety Considerations of Lithium- Thionyl Chloride Cells Safety Considerations of Lithium- Thionyl Chloride Cells,” 1986. 20. E. Barsoukov and J. R. Macdonald, Impedance Spectroscopy: Theory, Experiment,
and Applications, Hoboken, NJ, USA: John Wiley & Sons, Inc., 2005.
21. M. E. Orazem and B. Tribollet, Electrochemical Impedance Spectroscopy, Hoboken, NJ, USA: John Wiley & Sons, Inc., 2008.
22. A. Lasia, Electrochemical Impedance Spectroscopy and its Applications, New York, NY: Springer New York, 2014.
23. T. Osaka, D. Mukoyama, and H. Nara, “Review—Development of Diagnostic Pro-cess for Commercially Available Batteries, Especially Lithium Ion Battery, by Electrochemical Impedance Spectroscopy,” J. Electrochem. Soc., 162(14), A2529 (2015).
24. J. M. Esteban and Mark E. Orazem, “On the Application of the Kramers-Kronig Relations to Evaluate the Consistency of Electrochemical Impedance Data,”J. Elec-trochem. Soc., 138(1), 67 (1991).
25. M. E. Orazem, J. M. Esteban, and O. C. Moghissi, “Practical applications of the Kramers-Kronig relations,”Corrosion, 47(4), 248 (1991).
26. B. Boukamp, “Practical application of the Kramers-Kronig transformation on impedance measurements in solid state electrochemistry,”Solid State Ionics, 62(1–2), 131 (1993).
27. E. Özdemir, C. B. Uzundal, and B. Ulgut, “Zero-Free-Parameter Modeling Approach to Predict the Voltage of Batteries of Different Chemistries and Supercapacitors under Arbitrary Load,”J. Electrochem. Soc., 164(6), A1274 (2017).
28. A. Farmann and D. U. Sauer, “Comparative study of reduced order equivalent circuit models for on-board state-of-available-power prediction of lithium-ion batteries in electric vehicles,”Appl. Energy, 225, 1102 (2018).
29. Y. Shen, “A chaos genetic algorithm based extended Kalman filter for the avail-able capacity evaluation of lithium-ion batteries,” Electrochim. Acta, 264, 400 (2018).
30. R. V. Moshtev, Y. Geronov, and B. Puresheva, “The Primary Passive Film on Li in SOCl2Electrolyte Solutions,”J. Electrochem. Soc., 128(9), 1851 (1981). 31. D. Kek, M. Gaberšˇcek, and S. Pejovnik, “All-Solid-State Measurements of
Elec-trical Properties of Passive Films on Lithium,”J. Electrochem. Soc., 143(5), 1690 (1996).
32. I. Nainville, A. Lemarchand, and J.-P. Badiali, “Passivation of a lithium anode: A simulation model,”Electrochim. Acta, 41(18), 2855 (1996).
33. R. M. Spotnitz, G. S. Yeduvaka, G. Nagasubramanian, and R. Jungst, “Modeling self-discharge of Li/SOCl2cells,”J. Power Sources, 163(1), 578 (2006). 34. A. Meitav and E. Peled, “Solid electrolyte interphase (SEI) electrode,”J. Electroanal.
Chem. Interfacial Electrochem., 134(1), 49 (1982).
35. V. E. Kazarinov and V. S. Bagotzky, “Properties of a passivating film on the surface of lithium electrodes,”J. Power Sources, 20(3–4), 259 (1987).
A820 Journal of The Electrochemical Society, 166 (6) A811-A820 (2019)
36. M. Hughes, S. A. G. R. Karunathilaka, N. A. Hampson, and T. J. Sinclair, “The impedance of the lithium-thionyl chloride primary cell,”J. Appl. Electrochem., 13(5), 669 (1983).
37. R. E. Popov, B. N. Zhang, E. C. Darcy, and E. C. White, “Impedance Spectroscopy as a Nondestructive Health Interrogation Tool for Lithium-BCX Cells,”J. Electrochem. Soc., 140(11), 3097 (1993).
38. F. Walsh, M. Pozin, A. Cherniy, and K. Tikhonov Jr„ “Characterization of lithium-thionyl chloride cells by impedance techniques,”J. Power Sources, 97–98(98), 714 (2001).
39. B. A. Boukamp, “A Linear Kronig-Kramers Transform Test for Immittance Data Validation,”J. Electrochem. Soc., 142(6), 1885 (1995).
40. F. Fasmin and R. Srinivasan, “Review—Nonlinear Electrochemical Impedance Spec-troscopy,”J. Electrochem. Soc., 164(7), H443 (2017).
41. M. Kiel, O. Bohlen, and D. U. Sauer, “Harmonic analysis for identification of non-linearities in impedance spectroscopy,”Electrochim. Acta, 53(25), 7367 (2008). 42. K. Darowicki and J. Majewska, “Harmonic analysis of electrochemical and corrosion
systems - a review,” Corros. Rev., 17(5–6), 383 (1999).
43. R. W. Bosch, J. Hubrecht, W. F. Bogaerts, and B. C. Syrett, “Electrochemical Fre-quency Modulation: A New Electrochemical Technique for Online Corrosion Moni-toring,”Corrosion, 57(1), 60 (2001).
44. R. Vedalakshmi, S. Manoharan, H. W. Song, and N. Palaniswamy, “Application of harmonic analysis in measuring the corrosion rate of rebar in concrete,”Corros. Sci., 51(11), 2777 (2009).
45. W. Durnie, R. De Marco, A. Jefferson, and B. Kinsella, “Harmonic analysis of carbon dioxide corrosion,”Corros. Sci., 44(6), 1213 (2002).
46. T. Kadyk, R. Hanke-Rauschenbach, and K. Sundmacher, “Nonlinear frequency re-sponse analysis of PEM fuel cells for diagnosis of dehydration, flooding and CO-poisoning,”J. Electroanal. Chem., 630(1–2), 19 (2009).
47. X. Zhang, D. Moosbauer, A. Kojevnikov, and M. Yaffe, “(Invited) Total Harmonic Distortion for PEM Fuel Cell,”ECS Trans., 75(38), 17 (2017).
48. N. Harting, N. Wolff, F. Röder, and U. Krewer, “Nonlinear Frequency Response Analysis (NFRA) of Lithium-Ion Batteries,”Electrochim. Acta, 248, 133 (2017). 49. N. Harting, N. Wolff, and U. Krewer, “Identification of Lithium Plating in
Lithium-Ion Batteries using Nonlinear Frequency Response Analysis (NFRA),”Electrochim. Acta, 281, 378 (2018).
50. M. D. Murbach, V. W. Hu, and D. T. Schwartz, “Nonlinear Electrochemical Impedance Spectroscopy of Lithium-Ion Batteries: Experimental Approach, Anal-ysis, and Initial Findings,”J. Electrochem. Soc., 165(11), A2758 (2018). 51. A. Leef and A. Gilmour, “Voltage delay in lithium non-aqueous battery systems,”J.