LIBRARIES AND TOOLS FOR VIEWING
AND EDITING BIOLOGICAL MAPS IN
SBGN
a thesis submitted to
the graduate school of engineering and science
of bilkent university
in partial fulfillment of the requirements for
the degree of
master of science
in
computer engineering
By
Metin Can Siper
July 2017
LIBRARIES AND TOOLS FOR VIEWING AND EDITING BIO-LOGICAL MAPS IN SBGN
By Metin Can Siper July 2017
We certify that we have read this thesis and that in our opinion it is fully adequate, in scope and in quality, as a thesis for the degree of Master of Science.
U˘gur Do˘grus¨oz(Advisor)
Erc¨ument C¸ i¸cek
Tolga Can
Approved for the Graduate School of Engineering and Science:
Ezhan Kara¸san
ABSTRACT
LIBRARIES AND TOOLS FOR VIEWING AND
EDITING BIOLOGICAL MAPS IN SBGN
Metin Can Siper
M.S. in Computer Engineering Advisor: U˘gur Do˘grus¨oz
July 2017
Information about cellular processes and pathways is becoming increasingly avail-able in detailed, computavail-able standard formats including Systems Biology Graphi-cal Notation (SBGN). Effective visualization of this information is a key recurring requirement for biological data analysis, especially for -omic data. Biological data analysis is rapidly migrating to web based platforms; thus there is a substantial need for sophisticated web based pathway viewing and editing tools that support these platforms and other use cases.
We propose to develop a modular software architecture to meet this need. This proposed architecture includes reusable web based libraries and easily customiz-able and embeddcustomiz-able tools developed using these libraries. Our libraries include SBGNViz.js, a Cytoscape.js based library providing a renderer and an API to develop tools visualizing pathway models represented by SBGN Diagrams, and ChiSE.js, an SBGNViz.js based library to visualize and construct pathway mod-els represented in SBGN Diagrams, and miscellaneous Cytoscape.js extensions. Our tools are built using these libraries and include SBGNViz Viewer and Newt, which are sample applications for SBGNViz.js and ChiSE.js, respectively.
Newt is being developed to become a first web based, open source SBGN editor with full support for compound structures such as molecular complexes and compartment, advanced diagramming facilities including grid and alignment guidelines, static and incremental layout, and complexity management of large maps.
Keywords: Biological maps, pathways, information visualization, web based tools, systems biology, pathway layout, complexity management, pathway viewer, path-way editor, pathpath-way curator, SBGN.
¨
OZET
SBGN ˙ILE B˙IYOLOJ˙IK HAR˙ITALARIN G ¨
OSTER˙IM˙I
VE D ¨
UZENLENMES˙I ˙IC
¸ ˙IN K ¨
UT ¨
UPHANE VE
ARAC
¸ LAR
Metin Can Siper
Bilgisayar M¨uhendisli˘gi, Y¨uksek Lisans Tez Danı¸smanı: U˘gur Do˘grus¨oz
Temmuz 2017
H¨ucresel prosesler ve yolaklar hakkında bilgi Systems Biology Graphical Notation (SBGN) gibi hesaplanabilir standart formatlarda artarak daha ula¸sılabilir bir hale geliyor. Bu bilginin etkin olarak g¨orselle¸stirilmesi biyolojik bilgi analizi i¸cin temel bir gereklilik. Biyolojik bilgi analizi hızla web tabanlı platformlara ta¸sınmakta; bu y¨uzden bu platformları ve diger kullanım senaryolarını destekleyen ¸cok y¨‘ on¨u web tabanlı yolak g¨orselleyici ve d¨uzenleyicilere b¨uy¨uk bir ihtiya¸c var.
Bu ihtiyacı kar¸sılamak i¸cin mod¨uler bir yazılım mimarisi geli¸stirmeyi ¨
oneriyoruz. Onerilen mimari yeniden kullanılabilir web tabanlı k¨¨ ut¨uphaneler ve bu k¨ut¨uphaneleri kullarak geli¸stirilen kolaylıkla uyarlanabilir ve g¨om¨ulebilir ara¸clar i¸ceriyor. K¨ut¨uphanelerimiz SBGNViz.js, SBGN diyagramlarıyla g¨osterimlenen yolak modellerini g¨orselle¸stirmek i¸cin bir i¸sleyici ve uygulama pro-gramlama aray¨uz¨u saglayan Cytoscape.js tabanlı bir k¨‘ ut¨uphane, ve ChiSE.js, SBGN diyagramlaryla g¨osterimlenen yolak modellerini g¨orselle¸stirmek ve in¸sa etmek i¸cin SBGNViz.js tabanlı bir k¨ut¨uphane, ve ¸cok y¨onl¨u Cytoscape.js eklenti-lerinden olu¸smakta. Bu k¨ut¨uphaneleri kullanarak geli¸stirilen ara¸clarımız sırasıyla SBGNViz.js ve ChiSE.js i¸cin birer ¨ornek uygulama olan SBGNViz Viewer ve Newt’i i¸cermekte.
Newt, molek¨uler kompleksler ve kompartımanlar gibi bile¸sik yapıları, ¨
org¨u ve hizalama y¨onergeleri gibi ileri ¸semala¸stırma olanaklarını, durgun ve artımlı yerle¸stirme algoritmalarını, ve b¨uy¨uk haritalarda karma¸sıklık y¨onetimini destekleyen ilk web tabanlı ara¸c olarak geli¸stirilmekte.
Anahtar s¨ozc¨ukler : Biyolojik haritalar, yolaklar, bilgi g¨osterimi, web ta-banlı ara¸clar, sistem biyolojisi, yolak yerle¸stirme, karma¸sıklık y¨onetimi, yolak
v
Acknowledgement
I would like to express my special thankfulness to Prof. U˘gur Do˘grus¨oz for his guidance and support throughout my graduate study. I have learned lots of things from him in this period.
I would like to thank to Assist. Prof. Dr. Erc¨ument C¸ i¸cek and Assoc. Prof. Dr. Tolga Can for reviewing and commenting on the manuscript of this thesis.
I would like to thank T ¨UB˙ITAK for their financial support during my thesis within the context of the project numbered 113E161.
I would like to express my deepest thanks to my parents, ˙Ibrahim and Kadriye, my brother Alper, and all other members of my family because they always supported me.
I would like to thank all of my friends for their great friendship during and before my graduate life.
Contents
1 Introduction 1
1.1 Motivation . . . 3
1.2 Contribution . . . 3
2 Background Information and Related Work 5 2.1 Graph Visualization . . . 5
2.2 Biological Standards . . . 9
2.3 Related Tools, Libraries, and Resources . . . 15
2.3.1 Cytoscape . . . 15 2.3.2 Pathway Commons . . . 19 2.3.3 PCViz . . . 19 2.3.4 ChiLay . . . 19 2.3.5 BioGene . . . 20 2.3.6 CySBGN . . . 21
CONTENTS viii
2.3.7 VISIBIOweb . . . 22
2.3.8 Biographer . . . 23
2.3.9 SBGN-ED . . . 24
3 Tools and Libraries For Visualizing and Editing SBGN Maps 26 3.1 Cytoscape.js Extensions . . . 27
3.2 SBGNViz.js . . . 27
3.3 ChiSE.js . . . 33
3.4 SBGNViz Viewer . . . 41
3.5 Newt . . . 47
3.6 Overall System Architecture . . . 54
4 Conclusion 56 4.1 Future Work . . . 59
List of Figures
1.1 Textual representation of a biological pathway (Activation of NOXA and translocation to mitochondria) in PathwayCommons [1] 2 1.2 Visual representation of a biological pathway (Activation of NOXA
and translocation to mitochondria) in PathwayCommons [1] . . . 2
2.1 A sample directed (left) and undirected (right) graph with three vertices: A, B, C and two edges that connects vertices to each other. 6 2.2 A compound graph with multiple levels of nesting . . . 6
2.3 Graph representation of a social network [2] . . . 7
2.4 Graph representation of a biological pathway . . . 8
2.5 Visualization of the same graph before (left) and after (right) ap-plying layout . . . 8
2.6 Visual representation of SBGN PD elements [3] . . . 10
2.7 Metabolical pathway of IFN regulation visualized in PD. . . 12
LIST OF FIGURES x
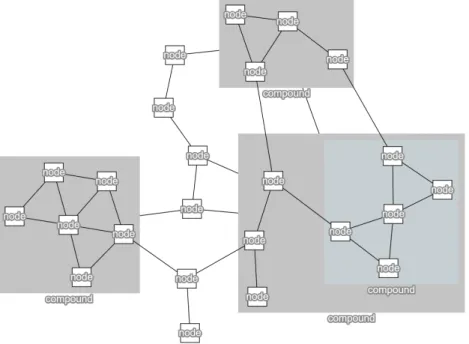
2.9 A sample SBGN-PD map (left) and its relevant representation in SBGN-ML (right) . . . 14 2.10 Cytoscape.js architecture visualized by Cytoscape.js itself [5] . . 16 2.11 An example Cytoscape.js initialization code . . . 18 2.12 A sample scene from PCViz . . . 20 2.13 Edge representation comparison between SBGN and CySBGN [6] 21 2.14 Random ordering of the nodes may affect the visualization of the
diagram [7] . . . 22 2.15 SBGN-PD representation of Amaranthin Biosynthesis pathway
produced by VISIBIOweb [8] . . . 23 2.16 SBGN-PD representation of the MAP kinase cascade in
Biogra-pher [9] . . . 24 2.17 SBGN-ED with two PD maps and the respective panel for editing
these type of SBGN maps [10] . . . 25
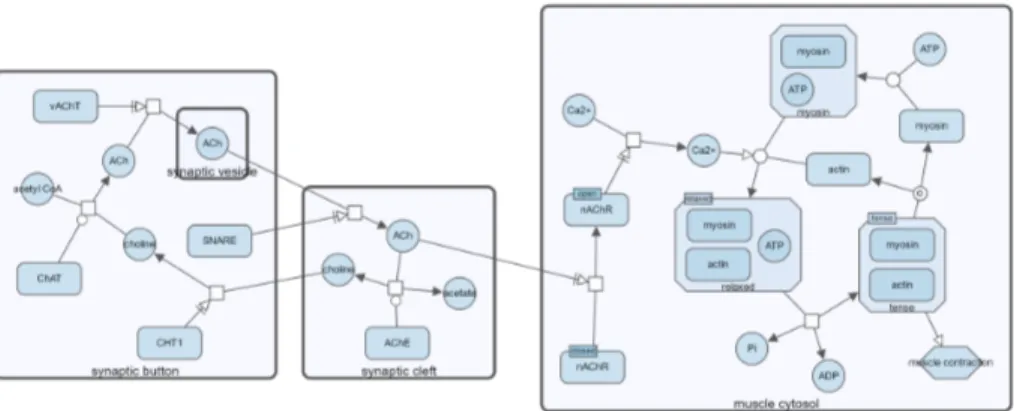
3.1 SBGNViz.js Architecture . . . 28 3.2 Visualization of neuronal muscle signalling pathway before (top)
and after (bottom) molecular compartment Synaptic Cleft is col-lapsed through SBGNViz.js API . . . 29 3.3 Neuronal muscle signalling pathway before (top) and after (bottom)
the selected macromolecule is hidden through SBGNViz.js API. . 30 3.4 A molecular reaction from CaM-CaMK dependent signaling to the
nucleus pathway when ports are considered (top) and omitted (bot-tom) by SBGNViz.js renderer. . . 32
LIST OF FIGURES xi
3.5 Neuronal muscle signalling pathway before (top) and after (bottom) myosin with blue background color is cloned using ChiSE.js API. 35 3.6 A group of nodes before (left) and after (right) creating a
compart-ment for them using ChiSE.js API. . . 36 3.7 A reaction created from template where four macromolecules are
combined together to create a complex using ChiSE.js API. . . 37 3.8 Neuronal muscle signalling pathway before (left) and after (right)
changing background color of all macromolecules to blue using ChiSE.js API. . . 39 3.9 ChiSE.js Architecture . . . 40 3.10 A sample screen from SBGNViz Viewer . . . 42 3.11 Visualization of a graph that includes many edge bend points in
SBGNViz Viewer. The bend point positions of the selected edge are highlighted. . . 44 3.12 Further information about myosin obtained from BioGene [11] . . 44 3.13 Dialog box that enables querying Pathway Commons [1] web
ser-vice to get the paths between particular set of genes inside a specific length limit . . . 45 3.14 SBGNViz Viewer Architecture . . . 46 3.15 A sample view from Newt . . . 48 3.16 Newt supports alignment guidelines by utilizing Cytoscape.js
grid-guide [12] extension . . . 49 3.17 Palette tab of Newt inspector . . . 50
LIST OF FIGURES xii
3.18 Map tab of Newt inspector . . . 51
3.19 Object tab of Newt inspector . . . 53
3.20 Newt Architecture . . . 54
List of Tables
4.1 Comparison of more advanced visualization and/or editing tools that provide support for SBGN . . . 58
Chapter 1
Introduction
A graph is a data structure which represents a set of objects as nodes and the relations between those objects as edges. Graphs are regarded as one of the most popular way of modelling complex relational information. Modeling relational information using graphs promotes data validation, integration, querying, and visualization.
Textual representation of relational information is easy but it generally ob-structs deriving information (Figure 1.1). Therefore, there is a substantial need for visualizing information which eases analysis and comprehension of data (Fig-ure 1.2).
Systems Biology Graphical Notation (SBGN) [13] has been developed by a community of biologists, curators and software developers to develop high qual-ity, standard graphical languages for representing biological processes and inter-actions. SBGN consists of process description (PD), entity relationship (ER), and activity flow (AF) languages.
Information about cellular processes and pathways is becoming increasingly available in detailed, computable standard formats including SBGN. The increase in size of information creates a demand for powerful tools to visualize and edit pathways.
Figure 1.1: Textual representation of a biological pathway (Activation of NOXA and translocation to mitochondria) in PathwayCommons [1]
Figure 1.2: Visual representation of a biological pathway (Activation of NOXA and translocation to mitochondria) in PathwayCommons [1]
1.1
Motivation
There are plenty of tools that visualize biological pathway information. While some of these tools support visualization of networks with simplified notation [14, 15, 16], some others support SBGN [17, 18, 19, 20, 21, 22]. However, most of these tools are desktop applications [18, 20, 23, 22], which require installation or plugins for desktop use [21]. As for the ones which work on web browsers, they lack interactive graph editing features [19], or are not designed to work on touch enabled devices [17]. Furthermore, none has detailed diagramming capabilities such as advanced editing of topology, style of map objects through an inspector and, grid and alignment guidelines for easy manual layout of maps. Only a few [17] has been designed as a library for easily developing an application for viewing and editing of maps in SBGN and embedding in a web page. Last but not least, these tools do not have full support for compound based structures such as molecular complexes or compartments. Therefore, there is a need for an open source, web based tool that enables visualizing and editing SBGN diagrams while having full support for compound structures and utilizing advanced complexity management techniques. This need led us to conduct this work.
1.2
Contribution
We designed and developed web based software libraries and tools based on these libraries to visualize, analyze and edit SBGN diagrams. The main concern for us was to ease research for scientists who work with SBGN diagrams. Our tools and libraries are based on Cytoscape.js core and its extensions [24, 25, 26, 27, 28, 29, 12, 30, 31, 32, 33, 34, 35]. Some of these extensions are provided by us to be used in this work [25, 26, 27, 29, 12, 30, 32, 33, 34, 35]. However, as they are suitable for miscellaneous types of usage, many other Cytoscape.js users have already started utilizing them in their Cytoscape.js based applications.
We turned a previously developed tool [36] into SBGNViz.js, a JavaScript li-brary to visualize SBGN-PD and SBGN-AF diagrams. SBGNViz.js is based on Cytoscape.js [5], an open-source JavaScript graph library for analysis and visual-ization, which works with data in JSON format. Therefore, SBGNViz.js includes an SBGN-ML [37] to JSON converter to load graphs from SBGN-ML files and it includes a JSON to ML converter to export the current network in SBGN-ML format. The other main component in SBGNViz.js is the SBGNViz renderer. SBGNViz renderer extends the renderer of Cytoscape.js to enable rendering of SBGN specific nodes and edges. SBGNViz.js provides an easy to use API which enables its users to create their own customized applications based on it. We also created a sample application for SBGNViz.js called SBGNViz Viewer. Users are free to edit and customize SBGNViz Viewer source codes as an alternative to creating their applications based on SBGNViz.js from scratch.
SBGNViz.js is not merely a library for viewing SBGN diagrams, it also has many features to enable complexity management operations on these diagrams. These features includes hide-show, highlighting, expand-collapse of sub-maps to enable the end users to focus on specific parts of the network, and ignore the rest. These complexity management operations become vital especially in large diagrams. In that sense, SBGNViz.js provides enough facilities to develop an SBGN viewer application, but the editing facilities provided by SBGNViz.js does not go beyond enabling the interactive repositioning of the nodes in the diagram. Hence, we developed ChiSE.js, another JavaScript library to edit SBGN-PD and SBGN-AF diagrams, by extending SBGNViz.js with advanced editing features. ChiSE.js provides an API, which is structurally close to SBGNViz.js API. We also created Newt, which is a sample application for ChiSE.js. ChiSE.js users have options of creating their own SBGN editor application from scratch or modifying the source code of Newt to customize it.
Chapter 2
Background Information and
Related Work
2.1
Graph Visualization
A graph G = (V, E) is a set of vertices (nodes) V and edges E. An edge e ∈ E connects a pair of vertices (u, v) where u, v ∈ V .
In a directed graph G = (V, E) each edge e = (u, v) connects an ordered pair of vertices u, v ∈ V where u is the source vertex and v is the target vertex. However, in an undirected graph edges are associated with an unordered pair of vertices (Figure 2.1).
An edge e = (u, v) is called a loop or self edge if u = v. If there is a group of multiple edges connecting the same source and target vertices these edges are called multi edges.
An edge e = (u, v) is in the outgoing edge list of vertex u and incoming edge list of vertex v where u is the source of e and v is the target of e.
inside itself. A graph is called a compound graph if it contains any compound vertex . Compound graphs have child-parent relationship. A compound vertex v is parent of the vertices inside it and each vertex inside v is child of v. In a compound graph a compound vertex may be child of another compound vertex, such graphs define multiple levels of nesting (Figure 2.2).
Figure 2.1: A sample directed (left) and undirected (right) graph with three ver-tices: A, B, C and two edges that connects vertices to each other.
Figure 2.2: A compound graph with multiple levels of nesting
Graphs are abstract structures which are not associated with any kind of ge-ometric information required for visualization. However, visualization of graphs is crucial to comprehend the underlying relational information in them. The
complexity and size of relational information represented by graphs has been in-creasing. Therefore, the need for effective graph visualization techniques increases to provide fine analysis and comprehension of underlying relational information in graphs (Figure 2.3 and Figure 2.4).
Figure 2.3: Graph representation of a social network [2]
Graph visualization concerns with drawing graphs by defining geometry for graph elements. This geometric information includes location, width, height, and border along with its topological structure. Many aesthetic properties including color, transparency, edge arrow shapes, border shapes are also regarded as as-pects of graph visualization. Indeed, any visual attribute that affects viewers’ comprehension can be regarded as a graph visualization concept.
Figure 2.4: Graph representation of a biological pathway
Graph layout is another important concept of graph visualization. Graph lay-out corresponds to the geometry of a graph, aiming visualization with aestheti-cally pleasing results. The concept of aesthetiaestheti-cally pleasing changes from one to another. However, in the literature there are some commonly accepted criteria for an aesthetically pleasing visualization of a graph [38]. According to the cri-teria, the main aesthetics to obtain attractive drawings of graphs are inheriting the topological symmetry of the graph, minimizing the crossing of edges, having uniform edge lengths, distributing the vertices uniformly and avoiding bends in edges. However, optimization of each individual criteria leads to an NP-hard problem. Also, optimizing one of these aesthetics usually obstructs optimizing the another one. Therefore, graph drawing approaches are usually heuristic. A poor graph layout obstructs the analysis of a graph, while a good one enables comprehension of the underlying relational information of the graph (Figure 2.5).
Figure 2.5: Visualization of the same graph before (left) and after (right) applying layout
2.2
Biological Standards
Biological Pathway Exchange (BioPAX) has been developed to standardize the representation of biological pathways at the molecular and cellular level and to provide an opportunity for the exchange of pathway data [39].
Standard visual languages aid to speed up work by substantiating regular-ity, eliminating ambiguregular-ity, and enabling software tool support for transmission of complicated information. Circuit diagrams and Unified Modeling Language diagrams are two well known standard visual language examples. Biology is one of the fields having utmost rate of graphical to textual information, but it is still destitute of standard graphical notations. Systems Biology Graphical Nota-tion (SBGN) was developed as a visual language by a community of biochemists, modelers and computer scientists to fill this deficiency [40, 13].
SBGN is formed by three complementary languages: process description (PD), entity relationship (ER), activity flow (AF). Together these three languages pro-vides scientists with facility of representing networks of biochemical interactions in a standard, unambiguous way.
PD language indicates the temporary courses of biochemical interactions in a network. In that sense it is convenient for showing all the molecular interactions participating in a network of biochemical entities, with the same entity found multiple times in the same diagram. ER language enables to show all relationships where a given entity takes place. It does not consider temporary aspects. AF language demonstrates the information flow between biochemical entities in a network. It ignores information with regard to the state transitions of entities. It is used to reflect the influence of perturbations. In this work we focused on PD and AF languages.
In PD language, graphical elements are represented as demonstrated in Fig-ure 2.6. Entity Pool Nodes (EPN) represents any physical or conceptual entity.
Unspecified entity, simple chemical, macromolecule, nucleic acid feature, and com-plex are EPN glyphs representing material entities, while source, sink and per-turbing agent are the ones representing conceptual entities [41].
PD defines auxiliary units that can be carried by EPNs. Auxilary units are the gylphs that provide extra information about EPNs. There are 3 type of auxiliary units in PD:
• Unit of Information: A decoration that is used to add some abstract infor-mation about the entitys function that is not related to its structure. • State variable: A decoration that represents different physical or
informa-tional structure of an entity.
• Clone marker : Indicates that an EPN is cloned and another occurrence of it can be found in the map [42].
One or more EPNs can be transformed into one or more EPNs by process nodes. Process, omitted process, uncertain process, association, dissociation, and phenotype are process node types defined in SBGN PD language.
In PD language, compound structures are represented by complex and com-partment nodes. A complex node is a biochemical entity that is composed of other biochemical entities such as macromolecules, simple chemicals, multimers, or other complexes. A compartment node is a logical or physical structure that contains EPNs [41, 42].
In PD language, edges are defined to connect the nodes to each other. There are 9 type of edges in PD. Symbols at the far end of edges indicates the sense of edges in diagram (Figure 2.6).
Figure 2.7 represents a gene regulatory network where initially a complex is associated with IRF1-GAS through an association to produce another complex containing both of them. The input complex and IRF1-GAS are connected to the association with a solid line representing a consumption while the output
complex is connected to the association with a solid line and a filled triangle at the end of this line representing a production.
Figure 2.7: Metabolical pathway of IFN regulation visualized in PD. In AF language, graphical elements are represented as demonstrated in Fig-ure 2.8. An activity node (AN) represent the activities of an entity or an entity pool. There are two defined ANs in AF namely, biological activity and pheno-type [43].
A biological activity represents molecular activities of all types of biological entities. The essence of the molecule from which the activity is derived can be represented by the units of information. Therefore, the units of information asso-ciated with a biological activity can be in form of macromolecule, simple chemical, nucleic acid feature, unspecified entity, complex, of perturbation (Figure 2.8). On the other hand, a phenotype is the type of biological process that is needed to indicate observable or gaugeable outcome of the network.
Compartment is the merely container node type in AF. An AF compartment is same with a PD compartment in shape (Figure 2.6 and 2.8). It represents a physical structure where the function or activity is found. In contrast to a PD compartment an AF compartment is not allowed to include another compart-ment [43].
In AF edges are defined to connect the nodes like it was in PD. There are 6 defined types of edges in PD namely, positive influence, negative influence, unknown influence, necessary stimulation, logic arc, and equivalence arc.
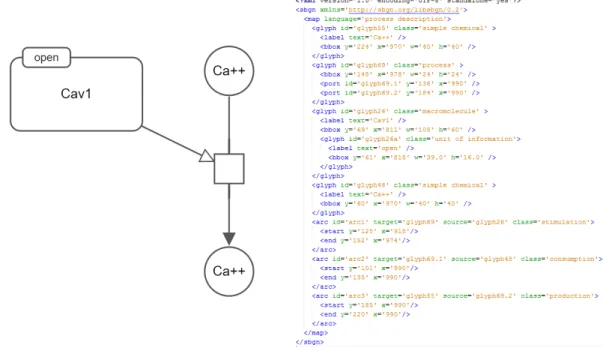
Although, SBGN offers a standard to represent biological pathways informa-tion in an unambiguous way, it does not present a model to store diagrams. Therefore, the diagrams can not be exchanged between tools that supports SBGN. SBGNML, a dedicated, lightweight XML-based file format, is developed with the hope of solving this problem [37]. SBGNML format covers all necessary informa-tion to render the SBGN entities (Figure 2.9).
Figure 2.9: A sample SBGN-PD map (left) and its relevant representation in SBGN-ML (right)
2.3
Related Tools, Libraries, and Resources
2.3.1
Cytoscape
Cytoscape project includes three well known graph visualization software, Cy-toscape, Cytoscape Web, and Cytoscape.js.
Cytoscape [44] is an open source desktop application that is introduced to visualize molecular interaction networks and biological pathways and integrating these networks with annotations, gene expression profiles and other state data. Although, Cytoscape was initially created to be used in biological research, cur-rently it is converted into a general platform for complex network analysis and visualization. Cytoscape core presents fundamental features to visualize and an-alyze networks, and also extended features are presented by plugins, which are called as app in Cytoscape context.
Cytoscape Web [45] was developed as an effort to create a basic web based version of Cytoscape that acts as a reusable library rather than being a tool. It is based on Flex/Flash technologies. Cytoscape Web project is no more maintained, it is replaced by Cytoscape.js.
Cytoscape.js [5] is developed as the successor of Cytoscape Web. It is a plain JavaScript library that visualizes interactive graphs on web browser without re-quiring any third-party application. Cytoscape.js can be run headlessly or as a visualization component using HTML5 canvas. Therefore, Cytoscape.js is conve-nient to be used as both a client side and server side component [46].
Cytoscape.js enables users to visualize and regulate graphs interactively in both desktop and touch enabled browsers. Interactive features of Cytoscape.js includes panning, zooming, selecting/unselecting elements (nodes and edges), and repositioning nodes.
Cytoscape.js provides an event driven core API. Cytoscape.js architecture in-cludes core and collection components. Core is the base entrance into the library
for the developers. It stands for the whole graph. A Cytoscape.js user can per-form operations on the graph as a whole with the help of core component. Core component also includes functions to access graph elements as a collection. Cy-toscape.js collections have their own API including facilities to traverse, filter and perform operations on elements inside them. Also, Cytoscape.js introduces an extension concept to provide users with the facility of extending its behaviours. Layout, core and collection functions can be introduced with the help of exten-sions without modifying library code directly. Figure 2.10 reflects the general architecture of Cytoscape.js [46, 5].
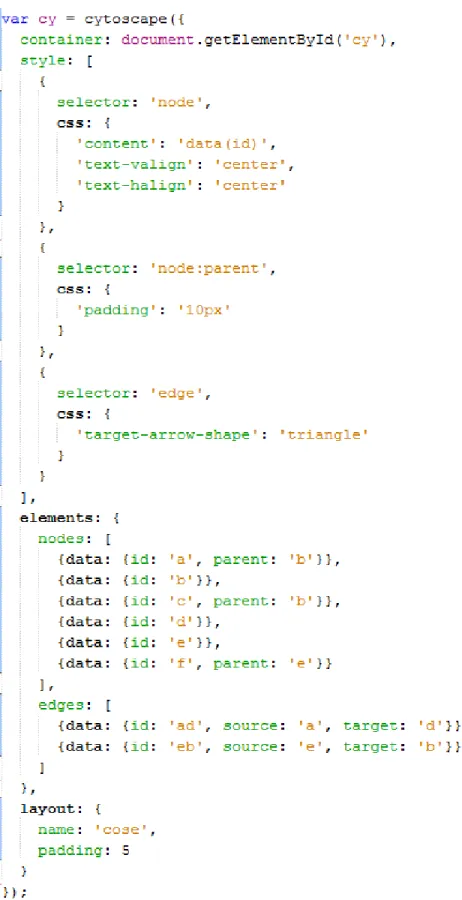
Cytoscape.js can easily be integrated into web application thanks to its plain interface. Cytoscape.js defines cytoscape() function that enables users to initialize the library. Cytoscape.js utilizes JSON format to exchange data with users. Figure 2.11 reflects an example code segment which initializes a Cytoscape.js instance.
Cytoscape.js adopts selector concept of CSS. In Cytoscape.js, selectors works on Cytoscape.js elements similar to how CSS selectors works on HTML DOM elements. Cytoscape.js selectors can be used in a collective way to create more comprehensive queries. Cytoscape.js selectors are utilized in defining stylesheet of a graph and filtering elements based on their properties. Also, some popular graph theory algorithms such as breadth first search, depth first search, Dijkstra, and page rank are adopted to Cytoscape.js to be operated on a collection of elements [5, 46].
Cytoscape.js introduces parent-child relationship to support compound node structures. Therefore, it is a favorable library for the applications where the data to be visualized can be hierarchically structured.
Cytoscape.js provides several functions to perform a layout on the whole graph or a set of elements. Users can choose between various layout algorithms including Bread First, Grid, and CoSE.
Cytoscape.js is a library that is designed to analyze and visualize graphs. It provides some basic graph editing facilities such as adding and removing elements, as well as moving nodes to new parents, attaching edges to new source and target nodes and interactively replacing nodes. However, the facilities that are provided by Cytoscape.js are not enough to build a graph editor. They should be extended with advanced editing techniques to build an editor around Cytoscape.js.
2.3.2
Pathway Commons
Pathway Commons [1] is a platform, where publicly available pathway data is gathered from multiple organizations. It consist of a web-based interface to browse and search a collection of pathways from multiple sources, a web site to download integrated pathway information, a web service to access and query all data. Pathway Commons provides access to data collected from 21 databases with more than 4,000 pathways, and 1,300,000 interactions, while it is consistently growing [47, 1].
2.3.3
PCViz
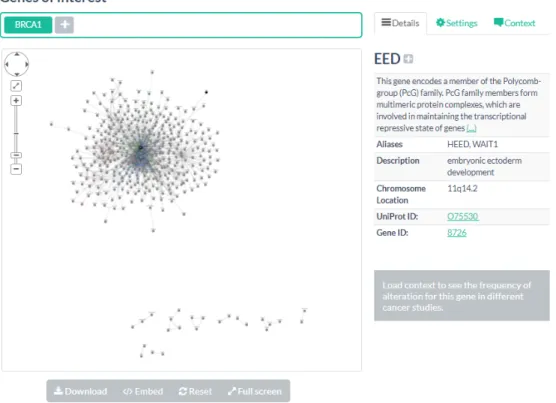
PCViz [48] is an open-source web-based biological network visualization tool that can be utilized to make queries to PatwayCommons and retrieve specifications of genes and interactions between them (Figure 2.12). PCViz users are able to extend the network by introducing new genes of interest, simplify the network by filtering genes or interactions according to various criteria, see the frequency of alteration for a gene by loading a cancer context, and export networks in different formats.
PCViz uses a simplified non-starndard notation that yields very dense graphs and it does not utilize compound structures to organize content. Therefore, PCViz networks usually look like an hairball where there is a large number of edge crossings.
2.3.4
ChiLay
Chisio Layout (ChiLay) is an open source Java component which provides an automated layout facility for compound, clustered and simple graphs. Currently, Compound Spring Embedder (CoSE) [49], Circular Spring Embedder (CiSE) [50], and several other well known layout algorithms are available in ChiLay. ChiLay
Figure 2.12: A sample scene from PCViz
is available to be used locally, as a part of Java applications, or remotely through an HTTP web server. As a part of this work, we ported CoSE layout from Java to JavaScript to develop a Cytoscape.js extension of it [32].
2.3.5
BioGene
BioGene [11] provides a web-based tool and a web service to enable biological researchers making queries about a gene function. Gene information can be queried using a gene symbol or gene name as the key. The content for BioGene is provided by Entrez Gene, a gene database provided by NCBI [51]. Some gene details provided by BioGene are official symbol, name, aliases, chromosome location and gene id.
2.3.6
CySBGN
CySBGN [21] is a Cytoscape plugin that enables visualization, editing and val-idation of SBGN maps for Cytoscape users. It supports all of three SBGN lan-guages: Process Description, Entity Relationship, and Activity Flow. Cytoscape is a desktop application, so CySBGN is not available for online usage.
Figure 2.13: Edge representation comparison between SBGN and CySBGN [6] CySBGN uses Cytoscape renderer to represent SBGN nodes and edges. How-ever, Cytoscape support is not enough to present all SBGN nodes and edges properly. Therefore, CySBGN does not totally satisfy SBGN specifications (Fig-ure 2.13). CySBGN is not compatible with latest version of Cytoscape and this limits its usability for Cytoscape users. More importantly, it lacks compound node support, which is needed by an SBGN viewer and editing tool to represent molecular complexes and compartments.
Also, CySBGN does not have a proper support for auxiliary units. In CySBGN users need to represent auxiliary units by independent nodes. Therefore, when a
node is re-positioned its auxiliary units do not follow it. Besides this CySBGN does not support setting z-index of elements that may obstruct properly rendering auxiliary units and compound structures (Figure 2.14).
Figure 2.14: Random ordering of the nodes may affect the visualization of the diagram [7]
2.3.7
VISIBIOweb
VISIBIOweb [19] is an open source software that offers web-based visualization and layout support for BioPAX pathway models. It utilizes Google MAPS [52] API on client side and Eclipse Graphical Editing Framework [53] in server side. It renders the pathway models in SBGN-PD format and enables to save them in the same format. It also provides facilities to navigate pathways by using zoom and scroll tools and to inspect elements in the pathway (Figure 2.15). However, it uses static images, and does not support interactive editing of pathways.
Additionally, VISIBIOweb offers an automatic layout component that can be accessed by other tools through an HTTP web service that uses XML format to exchange data.
Figure 2.15: SBGN-PD representation of Amaranthin Biosynthesis pathway pro-duced by VISIBIOweb [8]
2.3.8
Biographer
Biographer [54, 17] is a web-based tool and library that offers rendering and editing facilities for SBGN diagrams. Biographer introduces jSBGN, a JSON-based exchange format. jSBGN format does not require to specify all properties of all visible elements, unlike SBGNML format. In this manner, jSBGN files can be created lightly and integrating Biographer into other software become easier under favor of using jSBGN. Biographer enables importing files in SBML and SBGNML formats as well.
Biographer supports all of three languages defined in SBGN: SBGN-PD, SBGN-AF, and SBGN-ER. It also enables exporting a graph in jSBGN, SVG, PDF, PNG and TIFF formats [54].
Biographer provides a partial support for compound node structures. When a compound node is repositioned its children are also repositioned along with it. However, when a node, which is inside a compound, is repositioned the geomet-rical borders of the compound node are not updated accordingly. Therefore, the child node stay out of its parent, like there is no parent-child relationship between them. Also, Bigrapher does not offer any automatic graph layout facility that
respects compound structures.
Figure 2.16: SBGN-PD representation of the MAP kinase cascade in Biogra-pher [9]
2.3.9
SBGN-ED
SBGN-ED [18] is a tool that offers to create and edit SBGN diagrams (Fig-ure 2.17). It is compatible with all 3 SBGN languages: SBGN-PD, SBGN-AF, SBGN-ER. Other utilities provided by SBGN-ED are validation of SBGN maps in terms of syntax and semantics, transformation of networks which are obtained from biological databases to SBGN, and exporting SBGN maps to specific file formats. However, it does not provide a proper support for compound node structures. In SBGN-ED nodes can be visually represented inside molecular com-plexes, compartments or submaps. However, a parent-child relationship can not be established between the nodes.
SBGN-ED is developed as an extension to VANTED, a Java desktop appli-cation for the visualization and analysis of networks with related experimental data [55]. Therefore, SBGN-ED is not available for online usage.
Figure 2.17: SBGN-ED with two PD maps and the respective panel for editing these type of SBGN maps [10]
Chapter 3
Tools and Libraries For
Visualizing and Editing SBGN
Maps
Different user groups may have different needs and concerns while working on pathway maps. For example, while complexity management operations are vital for someone who works on large and complex diagrams, it might not be a big concern for someone who works with simpler and smaller diagrams. Similarly, having interactive editing facilities is essential for a pathway curator, while it makes no sense for a person who just needs to view and analyze SBGN maps. In that sense, for some group of users, certain parts of a tool only slows down the initialization of the tool in a web browser, obstructing ease of use in vain. With this motivation in mind, we decided to develop reusable libraries and tools based on these libraries for viewing and editing of biological maps in SBGN instead of just creating a tool that includes every feature that may be needed. Developers can utilize our libraries to develop web-based tools according to basic needs of their user profile. Also, we provide tools (sample applications) that can be utilized directly or simplified and customized according to the needs of users.
3.1
Cytoscape.js Extensions
As it is mentioned before, Cytoscape.js introduces an extension concept to provide users with the facility of extending its behaviours. These extensions can provide visual cues at the top of Cytoscape.js canvas to enable user interaction, as well as offering their own APIs accessible through Cytoscape.js.
Some general purpose Cytoscape.js extensions are designed and developed by our research group to be used in this work [25, 26, 32, 27, 29, 35, 34, 12, 30, 33]. Some features of these extensions are dependant on each others.
Utilization of undo-redo extension [34] is a nice example of this. Many of the extensions developed to be used in this work introduces a user option called undo-able. Operations are performed in an undo-able way if this option is set as true. However, to perform these operations in an undo-able way undo-redo extension is needed, so it should be registered to Cytoscape.js. For example, expand-collapse extension enables expanding and collapsing nodes by means of visual cues rendered around nodes or through its API. In both cases, when a group of nodes is to be expanded or collapsed undo-able option is considered and the operation is performed accordingly.
3.2
SBGNViz.js
SBGNViz.js is a JavaScript library based on Cytoscape.js and its extensions for visualization and complexity management of SBGN diagrams in PD and AF lan-guages. It introduces SBGNViz renderer, an extension of Cytoscape.js renderer component, to visualize SBGN specific shapes and offers set of functions to build an SBGN viewer tool through its extendable API (Figure 3.1).
SBGNViz.js provides a set of functions to expand and collapse nodes. In collapse operation, which operates on a node N , initially the inter-graph edges whose one end is connected to any children of N are temporarily connected to N
Figure 3.1: SBGNViz.js Architecture
as meta edges and the children of N are removed. Also, the data of the removed children and their inter-graph edges are attached to N to be restored back on expand operation. Expand operation includes restoring the removed children of N , removing meta edges connected to N , and restoring the removed inter-graph edges of the children of N . In SBGNViz.js, style for collapsed nodes and meta edges can be defined by users to differentiate them from regular elements in the diagram (Figure 3.2). SBGNViz.js users are not only able to operate expand-collapse operations on a set of nodes in a simple manner, but also they are able to operate these operations on all complexes or all nodes in the map in a recursive way. Expand-collapse facilities of SBGNViz.js can be customized by user defined options such as performing layout after operation, requesting more screen space for node to be expanded before expand operation by utilizing a fisheye lens paradigm based approach that preserves orthogonal and proximal relationships between nodes [56], rendering visual expand-collapse cues on nodes. Expand-collapse facilities of SBGNViz.js use Cytoscape.js expand-Expand-collapse extension [29] also written by our group.
sbgnviz.collapseNodes(nodes) sbgnviz.expandComplexes() sbgnviz.collapseComplexes() sbgnviz.collapseAll()
sbgnviz.expandAll()
Figure 3.2: Visualization of neuronal muscle signalling pathway before (top) and after (bottom) molecular compartment Synaptic Cleft is collapsed through SBGN-Viz.js API
In SBGN-PD language a process should be regarded with its inputs and out-puts, similarly a complex is invalid without its members. The complexity man-agement operations such as hiding, showing, emphasizing a group of nodes should consider these rules. Before, applying these complexity management operations
on a group of nodes, the node group should be expanded to satisfy the rules above. SBGNViz.js offers functions to overcome this problem [36]. By using these functions SBGNViz.js users can hide, show or emphasize a submap based on selected nodes according to PD rules (Figure 3.3).
sbgnviz.hideNodesSmart(nodes) sbgnviz.showNodesSmart(nodes) sbgnviz.showAll() sbgnviz.highlightNeighbours(nodes) sbgnviz.highlightProcesses(nodes) sbgnviz.removeHighlights()
Figure 3.3: Neuronal muscle signalling pathway before (top) and after (bottom) the selected macromolecule is hidden through SBGNViz.js API.
Cytoscape.js uses JSON format to exchange data. Therefore, SBGNViz.js in-cludes SBGN-ML to JSON Converter and JSON to SBGN-ML Converter com-ponents. File Utilities component in SBGNViz.js uses these components to offer functions for saving and loading SBGN maps. SBGN-ML to JSON converter is utilized to load SBGN-ML graphs in SBGNViz.js while JSON to SBGN-ML con-verter can be used to export the existing SBGN diagram into SBGN-ML format. SBGNViz.js enables saving graphs as images in PNG and JPG formats as well by means of file utilities component (Figure 3.1).
sbgnviz.loadSBGNMLFile(file)
sbgnviz.loadSample(filename, folderpath) sbgnviz.saveAsSbgnml(filename)
sbgnviz.saveAsPng(filename) sbgnviz.saveAsJpg(filename)
SBGNViz.js renderer can omit or consider ports for PD maps according to user preferences. Users can switch between omitting and considering ports dy-namically by using functions provided SBGNViz.js API (Figure 3.4).
sbgnviz.enablePorts() sbgnviz.disablePorts() sbgnviz.arePortsEnabled()
Though SBGNViz.js offers functions to create an SBGN viewer application rather than an editor, it provides interactive node replacing and complexity man-agement operations. Some users may want to perform these operations in an undo-able way. Therefore, SBGNViz.js offers an option to set undo-able mode where undo and redo operations are available. This feature is dependent on Cytoscape.js undo-redo extension [34].
Element utilities is one of the most basic components in SBGNViz.js. It in-cludes functions related to Cytoscape.js elements in SBGNViz. The functions
provided by it are utilized by other components such as main utilities, undo-redo functions and renderer. Renderer needs to know about the features of elements such as their expected shape, label, and label size to render them. It utilizes element utilities to access such information. Undo-redo functions component in-troduces undo-able versions of the functions in element utilities which alters data field of an element group. In that sense, it uses the functions in element utilities internally. If undo-able mode is active then SBGNViz.js registers undo-able ac-tions to Cytoscape.js undo-redo extension. Acac-tions registered to this extension includes an action name, an operation to be performed when the operation is undone, and an operation to be performed when the operation is done and re-done. These operations are taken from undo-redo functions component. Main utilities includes the main functions which will be exposed directly to be utilized by SBGNViz.js users. Functions that are exposed in main utilities checks if undo-able mode is active. If it is active the operation should be performed through Cytoscape.js undo-redo extension. Otherwise, it should be performed through an-other Cytoscape.js extension or calling the related function from element utilities (Figure 3.1).
Figure 3.4: A molecular reaction from CaM-CaMK dependent signaling to the nucleus pathway when ports are considered (top) and omitted (bottom) by SBGN-Viz.js renderer.
3.3
ChiSE.js
ChiSE.js is a JavaScript library based on SBGNViz.js, which in turn is based on Cytoscape.js, to visualize and edit SBGN diagrams represented by PD and AF languages. ChiSE.js is developed by extending SBGNViz.js API with advanced editing features for SBGN diagrams.
ChiSE.js keeps the map type of the SBGN diagram, which may be PD, AF or unknown. In unknown mode the topological structure of the graph can be changed without any validation as long as an edge is between a pair of nodes. If a loaded file has both AF and PD elements or an AF element is added to a PD map (or vice versa), then the map type is set to unknown. If the diagram is in PD or AF mode, a validation test is performed before changing the topological structure of graph. The validation test checks if the change to be done breaks PD or AF rules and the changes can be applied if the test is successful. These are basically regarding:
• if an interaction has valid source and target node type (e.g. a consumption edge needs to have a source that is an EPN and a target that is a process node).
• if a node is nested with a valid compound node
ChiSE.js offers many functions to change graph topology. ChiSE.js users can add a new node to the root graph or inside a molecular complex or compartment in the graph. They can add new edges which connects the the desired source and target nodes. For deletion of elements ChiSE.js offers two facilities. In ChiSE.js nodes can be removed from the map in a simple manner, or they can be removed by considering SBGN-PD specific rules according to user preferences.
chise.addNode(id, x, y , nodeType, sbgnLanguage, parentId , visibility)
, visibility)
chise.deleteElementsSimple(eles) chise.deleteNodesSmart(nodes)
Map curators often need to add elements with the same properties many times to their diagram, because, especially in PD diagrams, it is heavily observed that the same entity appears multiple times. To ease editing in that cases ChiSE.js supports copy, paste and clone operations (Figure 3.5) by using Cytoscape.js clipboard extension [33] and enables users to set default properties for a node type. For example when default background color for macromolecules is set to blue, then new macromolecules which will be added to the diagram later will have blue background color by default.
chise.cloneElements(eles) chise.copyElements(eles) chise.pasteElements(eles)
chise.setDefaultProperty(elementType, propertyName, defaultValue)
ChiSE.js supports parent-child relationship between nodes upon elements cre-ation and afterward. It delivers a function that enables creating a molecular complex or compartment for a group of nodes (Figure 3.6) and a function that enables moving a node inside another molecular complex or compartment.
chise.createCompoundForGivenNodes(nodes, compoundNodeType) // posDiffX and posDiffY parameters indicates how the nodes // should be replaced in x and y coordinates respectively after // being moved to their new parent
chise.changeParent(nodes, newParent, posDiffX, posDiffY)
Process node types are vital in PD language because they represent processes that converts an entity pool group into another entity pool group. Therefore,
Figure 3.5: Neuronal muscle signalling pathway before (top) and after (bottom) myosin with blue background color is cloned using ChiSE.js API.
Figure 3.6: A group of nodes before (left) and after (right) creating a compartment for them using ChiSE.js API.
ChiSE.js offers functions that ease creation of group of elements, at the center of which a process takes place. ChiSE.js users have facility of creating a reaction from template where an association combines a group of macromolecules into a molecular complex, or a dissociation breaks a molecular complex into a group of macromolecules (Figure 3.7). Also, ChiSE.js offers a method to enable creation of a process with valid edges between an input and output node. In both of these functions the edges created between input node and the process are in consumption type while the edges between the process and the output nodes are in production type.
chise.addProcessWithConvenientEdges(source, target , processType) chise.createTemplateReaction(processType, macromoleculeList,
complexName, processPosition, edgeLength)
In SBGN-PD language, process nodes can have input and output ports where source edges are attached to the input port and target edges are attached to the output port. Hence, ChiSE.js offers a function to add, remove and set orientation of ports.
// If ports orientation is ’none’ it means that the node has // not any port. Hence, this function enables adding ports when
Figure 3.7: A reaction created from template where four macromolecules are combined together to create a complex using ChiSE.js API.
// current orientation is ’none’ and removing existing ports // when orientation parameter is ’none’.
chise.setPortsOrientation(nodes, orientation)
ChiSE.js supports auxiliary units in SBGN diagrams. In both PD and AF languages, elements can have units of information, while PD elements can have state variables, and clone markers as well. ChiSE.js offers functions to add a new state variable and unit of information to a group of nodes. It also enables removing state variables and units of information from a group of nodes and updating properties of these auxiliary units. In PD language, a clone marker indicates that an EPN is duplicated in the map. In ChiSE.js, users are provided with the facility of setting status of a group of nodes to cloned or not cloned. Besides having auxiliary units SBGN elements can be multimer as well. ChiSE.js provides a function to convert a group of nodes into multimer or removing their multimer status as well.
// Introduces a new state variable or unit of information chise.addStateOrInfoBox(nodes, stateOrInfoBox)
// Removes state variable or unit of information at given index chise.removeStateOrInfoBox(nodes, index)
// Updates state variable or unit of information at given index // A state variable consists of value and variable fields.
// fields is subject to update
chise.changeStateOrInfoBox(nodes, index, value, type) chise.setMultimerStatus(nodes, status)
chise.setCloneMarkerStatus(nodes, status)
Styling of elements is important for SBGN diagrams. Style properties are different for nodes and edges. Background color, border color, border with, back-ground opacity, and label are the well known style properties of nodes, while line color and line width are popular style properties of edges. ChiSE.js provides functions to change these style properties of elements (Figure 3.8). Along with these basic style properties, ChiSE.js enables alteration of node labels, label font properties, and node dimensions as well.
// In ChiSE.js elements are rendered according to their data // fields. Hence, all basic style properties of elements can // be updated by changing their data fields through this // function.
chise.changeData(elements, name, value)
// Enables updating one or more font properties together // in a batch
chise.changeFontProperties(nodes, properties)
In SBGN-PD language, edges can have cardinality labels that represent the stoichiometry of the nodes which are connected to them, which are positive val-ues. In SBGNViz.js there is a data field reserved for cardinality label. ChiSE.js supports updating cardinality labels through chise.changeData() method.
ChiSE.js is developed as a library to support editing of SBGN diagrams. There-fore, it provides an undo-able mode option, by which users are able to undo and redo operations they performed before.
ChiSE.js is developed by extending SBGNViz.js API and its architecture is very close to SBGNViz.js architecture (Figure 3.9 and Figure 3.1).
Figure 3.8: Neuronal muscle signalling pathway before (left) and after (right) changing background color of all macromolecules to blue using ChiSE.js API.
Figure 3.9: ChiSE.js Architecture
Element Utilities is one of the most basic components in ChiSE.js. It extends element utilities component in SBGNViz.js and offers more functions to access and update data fields of Cytoscape.js elements. It is utilized by undo-redo action functions and main utilities component (Figure 3.9). Editing of elements are done through this component in ChiSE.js.
Undo-Redo Functions component is responsible for providing functions that should be registered to Cytoscape.js undo-redo extension, if undo-able mode is active. It extends undo-redo functions component of SBGNViz.js by introduc-ing new functions that are undo-able versions of the functions in element util-ities. Therefore, it uses the functions provided by element utilities internally (Figure 3.9). As it is stated before, actions registered to Cytoscape.js expand-collapse extension are supposed to include an action name, an operation to be performed when the operation is undone, and an operation to be performed when the operation is done and redone. These operations are provided by undo-redo functions component.
Main utilies includes the main functions that are exposed directly to be utilized by ChiSE.js users. It works similar to main utilities component of SBGNViz.js. Functions that are exposed in this component checks if undo-able mode is active. If it is active, the operation is performed through Cytoscape.js undo-redo exten-sion. Otherwise, it is performed through another Cytoscape.js extension or by calling the related function from element utilities component (Figure 3.9).
3.4
SBGNViz Viewer
SBGNViz Viewer is a web-based tool that enables visualization and complexity management for SBGN diagrams represented by PD and AF languages (Fig-ure 3.10). SBGN Viewer is based on SBGNViz.js and consequently Cytoscape.js. It exposes pretty much all the functionality available in SBGNViz.js library.
SBGNViz Viewer accepts SBGN diagrams in SBGN-ML format by means of SBGNViz.js. When a file is loaded in SBGNViz Viewer, data inside that file is transmitted to SBGNViz.js. SBGNViz.js converts that data into JSON for-mat from SBGN-ML forfor-mat, because Cytoscape.js accepts data in JSON forfor-mat. Eventually, a Cytoscape.js graph is created using JSON representation of ele-ments. Also, existing diagrams can be exported to SBGN-ML, JPG, and PNG files.
SBGNViz Viewer supports interactive pan and zoom facilities under favor of basic mouse events provided by Cyoscape.js core and a navigation bar provided by Cytoscape.js panzoom extension [31].
Figure 3.10: A sample screen from SBGNViz View er
As it is discussed before, size of data in SBGN diagrams has been grow-ing excessively and complexity management operations become vital to analyze such data. Therefore, SBGNViz Viewer provides complexity management facil-ities for SBGN diagrams by utilizing SBGNViz.js library, Cytoscape.js expand-collapse [29], and Cytoscape.js view-utilities [35] extensions. Complexity man-agement facilities offered by SBGNViz Viewer includes expanding, collapsing, hiding, showing, and emphasizing a group of elements without destroying SBGN-PD rules.
SBGNViz Viewer uses Cytoscape.js context-menus extension [26] to provide a context sensitive menu that appears by right clicking on the graph root or elements. The content of context menu is different for the root graph, and various types of elements.
SBGN-ML file format provides geometrical information about edge bend points. Therefore, a tool that accepts data in SBGN-ML format is incomplete without having full support for edge bend points. Therefore, SBGNViz Viewer provides facilities for rendering and interactive editing of edge bend points by utilizing Cytoscape.js edge-bend-editing extension [27]. That extension renders visual cues that represents bend point positions on a selected edge and users can interactively edit bend point positions by dragging these cues (Figure 3.11). They can also add and remove bend points by using context sensitive menu that appears by right clicking on a selected edge.
Users may want to have further information about a specific gene. SBGNViz Viewer accesses that information by querying BioGene [11] by gene name. The information is available to users by right clicking on a gene and selecting ”BioGene Properties” option from the context menu (Figure 3.12). Also, SBGNViz Viewer provides users with the option of displaying full names of nodes or truncating them so that they fit into node shape. Users can left click a node to see its full name in case of it is truncated. SBGNViz Viewer uses Cytoscape.js qtip extension [24] for both of these facilities.
Figure 3.11: Visualization of a graph that includes many edge bend points in SBGNViz Viewer. The bend point positions of the selected edge are highlighted.
of genes inside a specific length limit with the help of Pathway Commons web service [1]. The resulting pathway is visualized by using rendering facilities of SBGNViz.js. Users can make queries through a simple dialog that allows them to specify the list of gene symbols in a space delimited way and the length limit (Figure 3.13).
Figure 3.13: Dialog box that enables querying Pathway Commons [1] web service to get the paths between particular set of genes inside a specific length limit
SBGNViz Viewer provides an automated layout facility to automatically lay-out the nodes in SBGN diagrams. On the other hand, one major characteristic of SBGNViz Viewer is that it provides full support for compound nodes. In SBGNViz Viewer, children of a compound node are always rendered inside its boundaries, this rule is not broken when the compound node itself or a group of its children are repositioned. Therefore, the layout algorithm that is utilized by the tool should handle compound structures. CoSE [49] is such an algorithm and we created and used a Cytoscape.js extension [32] that implements the CoSE al-gorithm for this purpose. CoSE provides many user options including whether to tile disconnected nodes to save space, whether to consider initial node positions in layout to respect the users mental map and whether to perform an animation during the layout. SBGN Viewer prompts the users to choose their layout options through a convenient dialog box.
Operations are done in an undo-able way in SBGNViz Viewer by means of Cytoscape undo-redo extension [34]. That is the operations can be undone and redone. Whether the tool should work in undo-able mode is controlled by a flag in a configuration file, the tool can be configured not to work in undo-able mode by setting the value of that flag as false.
Figure 3.14: SBGNViz Viewer Architecture
SBGNViz Viewer is a tool that is based on SBGNViz.js library; hence on Cytoscape.js. It needs to use Cytoscape.js API to register Cytoscape.js extension libraries such as Cytoscape.js panzoom, Cytoscape.js undo-redo, Cytoscape.js cose-bilkent, Cytoscape.js qtip, Cytoscape.js view-utilities, Cy-toscape.js expand-collapse, CyCy-toscape.js edge-bend-editing, and CyCy-toscape.js context-menus. SBGNViz.js library extends functions provided by API of these extensions to be used in an SBGN specific way. SBGNViz Viewer uses HTML5/CSS along with well known front end libraries including jQuery [57], Backbone.js [58], Underscore.js [59], Bootstrap [60] and some other little
JavaScript libraries. Eventually, SBGNViz Viewer uses SBGNViz.js API to per-form operations requested by the users, such as loading an SBGN-ML graph, exporting the current network to various file formats, applying complexity man-agement operations on graph elements, and running an automated layout on the graph (Figure 3.14).
3.5
Newt
Newt is a web-based tool that offers editing facilities, in addition to visualiza-tion capabilities, for SBGN diagrams represented by PD and AF languages (Fig-ure 3.15). Newt is dependent on ChiSE.js, and indirectly dependant on SBGN-Viz.js and Cytoscape.js.
Newt can be regarded as an SBGN editing tool that extends the features in SBGN Viewer with advanced editing features with help from ChiSE.js. In that sense, many facilities provided by SBGNViz are available in Newt with the same user interface as well. Loading diagrams from SBGN-ML files, exporting current network into various file formats, interactive panning and zooming, SBGN specific complexity management operations, visualization and editing of edge bend points, automated graph layout, querying the paths between particular set of genes, context sensitive menus, and undo-able graph operations are among such features.
Newt inherits maintaining map type feature from ChiSE.js as well. That is, similar to ChiSE.js, map type may take values of unknown, PD or AF in Newt. A user who attempts to add an AF element to a PD map or add a PD element to an AF map is prompted with a warning informing that the map type will be switched to unknown. If the user insists on adding the element then the map type is switched to unknown. In unknown mode, SBGN rules specific to PD and AF languages are omitted.
Figure 3.15: A sample view from Newt
Newt enables creating a molecular complex or compartment for the selected elements, creating a reaction from template, copying, pasting and cloning selected elements, and removing selected elements from the map through simple menu interactions. Since these facilities are introduced by ChiSE.js further information about them can be found in earlier related section.
Users may need to align a set of nodes in horizontal or vertical order. Therefore, Newt provides a facility to align selected nodes so that one of their horizontal top, middle, bottom or vertical left, center, right positions become the same. Also, often users need to align a node according to some nearby nodes manually, or align some nodes in vertical or horizontal order in equal intervals. To meet this need Newt supports alignment guidelines by utilizing Cytoscape.js grid-guide [12] extension (Figure 3.16).
Figure 3.16: Newt supports alignment guidelines by utilizing Cytoscape.js grid-guide [12] extension
select mode users can select and interactively reposition the elements. Add node and add edges modes enable creation of new nodes and edges, respectively.
Newt introduces an inspector that allows alteration of properties of SBGN elements and the general map, along with creation of new elements. The inspector consists of palette, object and map tabs. Users can add new AF or PD elements using palette tab of inspector (Figure 3.17).
Figure 3.17: Palette tab of Newt inspector
Map tab enables alteration of map properties such as enabling and disabling ports, allowing compound node resize, fitting labels to nodes, rearranging af-ter complexity management operations and applying color schemes on elements according to their types (Figure 3.18).
Object tab allows visualization and alteration of properties of selected ele-ments. It enables inspection of multiple elements together when more than one element is selected in Newt. The node properties that can be updated by object
tab are label, width, height, border color, background color, border width, back-ground opacity, font properties, list of state variables and units of information, along with multimer and cloned status. As for edges, their line color, line width and cardinality label can be updated from object tab. In addition, users can view details about a gene provided by EntrezGene [51] database and attach custom properties or MIRIAM [61] annotations to an element in object tab (Figure 3.19). Newt enables transferring a node inside or outside of a molecular complex or compartment interactively. Also, it offers an interactive user interface for creating new edges, that is activated on edge creation mode and utilizes Cytoscape.js edgehandles [28] extension. Besides these, Newt provides an interactive user interface for utilizing convenient process creation operation that is offered by ChiSE.js.
As mentioned before Newt enables resizing of nodes from the inspector. How-ever, interactive node resize is a more straightforward way of resizing nodes when the desired node sizes are not known explicitly. Therefore, Newt offers interac-tive node resize facility under favor of Cytoscape node-resize [30] extension. In interactive node resize, resize grapples are rendered around the node corners and users can resize the node by dragging these grapples. In SBGN, some node types such as processes, logical operators and source and sink should have the same width and height dimensions. Considering this, Newt does not provide active resize grapples in cardinal points for these type of nodes to disable resizing them in only one direction.
Newt is a tool that is based on ChiSE.js, consequently dependant to SBGN-Viz.js and Cytoscape.js as well. Its architecture is very close to SBGNViz Viewer architecture. Newt utilizes many Cytoscape.js extensions [31, 26, 24, 25, 27, 28, 30, 34, 29, 12, 33, 32, 33] and it should access Cytoscape.js API to register these extensions. SBGNViz.js and ChiSE.js libraries extends functions provided by API of these extensions to be used in an SBGN specific way. Newt uses HTML5/CSS together with popular front end libraries including jQuery [57], Backbone.js [58], Underscore.js [59], Bootstrap [60] and some other relatively smaller JavaScript libraries. Eventually, Newt uses ChiSE.js API to perform operations requested by
the users such as, adding new elements to the map, removing a group of elements, changing parent of a node (Figure 3.20).
Figure 3.20: Newt Architecture
3.6
Overall System Architecture
In the previous sections the internal software architectures of the tools and li-braries are discussed. This section explains the software architecture of overall system.
In this work, we use Cytoscape.js for rendering SBGN diagrams. However, Cytoscape.js renderer does not support some of SBGN specific shapes. Therefore, we were in need of extending Cytoscape.js renderer.
SBGNViz.js renderer extends Cytoscape.js renderer to offer visaulization of SBGN diagrams. It also provides an API for complexity management of SBGN diagrams. ChiSE.js API extends SBGNViz.js API with advanced editing func-tions. Both of ChiSE.js and SBGNViz.js utilizes Cytoscape.js API to manage
SBGN diagrams.
SBGNViz Viewer and Newt uses SBGNViz.js and ChiSE.js APIs respectively. SBGN Viewer and Newt register Cytoscape.js extensions to Cytoscape.js core. SBGNViz.js and ChiSE.js extend API functions provided by these extensions with SBGN specific features. In this manner, SBGN Viewer and Newt utilize these APIs implicitly, because they use SBGNViz.js and ChiSE.js APIs (Figure 3.21).
Chapter 4
Conclusion
In this thesis, we designed and developed tools and libraries that enable visual-ization and editing of SBGN diagrams represented in AF and PD languages.
We turned a previously developed tool SBGNViz [36] into SBGNViz.js, a Cy-toscape.js based library providing a renderer and an API for visualization and complexity management of SBGN Diagrams represented by AF and PD lan-guages. Then, we developed ChiSE.js, an SBGNViz.js based library to visualize, create and edit SBGN diagrams represented by AF and PD languages. We also developed SBGNViz Viewer and Newt that are sample applications for SBGN-Viz.js and ChiSE.js, respectively.
There are many tools that offer visualization and editing facilities for SBGN diagrams. SBGN-ED [18] is an SBGN editor that enables creation and editing of pathways in all of three SBGN languages. It supports all SBGN symbols in SBGN specifications as well as offering transition of non-SBGN networks from various biological databases to SBGN. However, it is a Java desktop application that is not open source and does not provide support for compound structures, attaching custom annotations to nodes, and alignment guidelines. It provides complexity management facilities such as hiding and showing nodes, but it does not offer any facility for expanding and collapsing nodes. Biographer [54] is an
![Figure 1.2: Visual representation of a biological pathway (Activation of NOXA and translocation to mitochondria) in PathwayCommons [1]](https://thumb-eu.123doks.com/thumbv2/9libnet/5859672.120473/15.918.201.757.611.1023/figure-visual-representation-biological-activation-translocation-mitochondria-pathwaycommons.webp)
![Figure 2.3: Graph representation of a social network [2]](https://thumb-eu.123doks.com/thumbv2/9libnet/5859672.120473/20.918.194.771.302.874/figure-graph-representation-social-network.webp)

![Figure 2.10: Cytoscape.js architecture visualized by Cytoscape.js itself [5]](https://thumb-eu.123doks.com/thumbv2/9libnet/5859672.120473/29.918.237.756.438.1055/figure-cytoscape-js-architecture-visualized-cytoscape-js.webp)
![Figure 2.14: Random ordering of the nodes may affect the visualization of the diagram [7]](https://thumb-eu.123doks.com/thumbv2/9libnet/5859672.120473/35.918.332.631.271.450/figure-random-ordering-nodes-affect-visualization-diagram.webp)
