Red Emitting, Cucurbituril-Capped, pH-Responsive Conjugated
Oligomer-Based Nanoparticles for Drug Delivery and Cellular
Imaging
Jousheed Pennakalathil,
†,‡Ermira Jahja,
§E. Sıla Özdemir,
§Özlen Konu,*
,§and Dönüs Tuncel*
,†,‡ †Department of Chemistry,‡Institute of Materials Science and Nanotechnology, National Nanotechnology Research Center(UNAM), and§Department of Molecular Biology and Genetics, Bilkent University, 06800 Ankara, Turkey
*
S Supporting InformationABSTRACT: Here we report the synthesis of nanoparticles based on a conjugated oligomer which is synthesized through Heck-coupling of divinylfluorene and dibromobenzothiodiazole monomers. These water dispersible nanoparticles emit in the region of red tailing to the near-infrared region of the spectrum with highfluorescent quantum yield and brightness. The nanoparticles were found to be stable in water for a prolonged time without forming any aggregates and could carry camptothecin, an anticancer drug with high loading efficiency. MTT cell viability studies performed with breast cancer cell lines showed that half-maximal inhibitory concentration (IC50) values of nanoparticles for MCF7 and MDA-MB-231 were 44.7 μM and 24.8 μM,
respectively. In order to further decrease the cytotoxicity and increase the stability of nanoparticles, amine groups were disguised by capping with cucurbit[7]uril (CB7). Drug release studies showed that drugs were released at low pH (at 5.0) faster than physiological pH (7.4) confirming the pH-responsive nature of the nanoparticles. On the other hand, CB7-capped drug-loaded nanoparticles regulated the release rate by providing slower release at pH 7.4 than the nanoparticles in the absence of CB7s. IC50
values for camptothecin in the presence of nanoparticles with or without CB7 were significantly reduced in MCF7 and MDA-MB-231 cells.
■
INTRODUCTIONConjugated polymer nanoparticles (CPNs) are highly appealing for various advanced applications such as in vivo imaging, cell labeling, and delivery of therapeutic agents, as well as nanophotonics, owing to their high quantum yields and molar absorptivity, tunable properties, easy functionalization, photo-stability, and so forth.1−7To date, the use of CPNs has been demonstrated successfully in cell imaging, oxygen sensing, drug delivery, and nucleic acid delivery.8−16
When these nanostructures are judiciously designed, they can be utilized in theranostic applications by combining more than one functionality to deliver therapeutic and imaging agents.17−21 For the controlled delivery of therapeutic agents to the targets the nanoparticles could also include responsive groups that will respond to stimuli such as pH, oxidation−reduction, and enzymes. However, in the literature, examples are scarce regarding the multifunctional conjugated polymer nanoparticles (CPNs) and even less with conjugated oligomer-based nano-particles (CONs).22,23Recently, Schenning et al. compared the capabilities of conjugated polymer nanoparticles to self-assembled oligomer-based nanoparticles in terms of their fluorescent quantum yields, stabilities, molar absorptivity,
guest-holding, and releasing.24They demonstrated that oligomer nanoparticles have higher fluorescent quantum yields and comparable stabilities and molar absorptivity, but they release the guest faster than the conjugated polymer nanoparticles. Thus, this feature should be considered for the further design of oligomer-based nanoparticles for theranostic applications. CONs also offer some useful additional features compared to CPNs such as having well-defined molecular weight and easier metabolism and excretion from body after delivery due to their smaller size compared to large polymeric species.
In this context, here we developed a strategy to utilize conjugated oligomer-based nanoparticles in controlled drug delivery and cellular imaging by designing and synthesizing nanoparticles which are pH-sensitive, emitting in the region of red tailing to infrared. Most importantly, the cytotoxicity of the nanoparticles could be reduced and the drug release rate could be regulated by capping the nanoparticles with cucurbituril as demonstrated in the selected breast cancer cell lines. Cucurbituril
Received: June 8, 2014
Revised: July 29, 2014
Published: July 30, 2014
(CB) is a rigid macrocyle which is constructed from an acid catalyzed condensation of glycoluril with formaldehyde.25−28CB homologues can vary as CB5, CB6, CB7, CB8, and CB10 depending on the number of glycoluril units which they contain. Among the CB homologues, CB5 and CB7 have good solubility in water. CB homologues have a hydrophobic cavity and two identical hydrophilic portals; owing to these features, they have high affinity toward ammonium and metal ions and form host− guest complexes with suitable organic molecules mainly through ion−dipole and hydrophobic interactions. CB homologues have been used extensively in the construction of supramolecular structures and more recently as vehicles for drug delivery due to their nontoxic nature.29−31
■
EXPERIMENTAL SECTIONMaterials. All reagents were purchased from Sigma-Aldrich Chemical Co. and were used as received. Morphological character-ization was achieved by transmission electron microscopy (TEM, FEI Tecnai G2 F30) and scanning electron microsocopy (SEM). The size of the nanoparticles was measured by dynamic light scattering (DLS, Zetasizer Nano-ZS). Measurements were carried out at 633 nm and the laser, as the light source, was used at room temperature. The time-dependent autocorrelation function of the scattered light intensity was measured at an angle of 90°. The average particle diameter was calculated by the Marquardt method. The DLS measurements were usually repeated at least three times and the average values are reported. For the optical characterization, a UV−vis spectrophotometer (Cary UV−vis) and a fluorescence spectrophotometer (Cary Eclipse Fluorescent spectrophotometer) equipped with a xenon lamp as the excitation source were used. For the structural characterization, nuclear magnetic resonance (NMR, a Bruker Avance III 400 for1H and a 100
MHz spectrometer for13C) and FT-IR (Bruker TENSOR 27) spectra were obtained. Mass spectra were obtained under high resolution (HRMS, Agilent, Model: 7890A/5975C) and elemental analysis were carried out by a CHNS/O elemental analyzer (Thermo Scientific, Model: Flash 2000). Deionized water was used to prepare the nanoparticles.
Synthesis of 9,9-Bis(3-bromopropyl)-2-vinyl-9H-fluorene, M2. 2-Bromo-9,9-bis(3-bromopropyl)-9H-fluorene, M1,3,4 (700 mg, 1.43 mmol) and 2,6-ditertiary butyl phenol (4.54 mg, 0.022 mmol) were placed in a 2-necked RBflask and dried under vacuum for 30 min. Degassed toluene (20 mL) was added to it, followed by tributyl vinyl tin (1.72 mmol, 544 mg, 0.6 mL), and the mixture was stirred for a while to dissolve the contents of theflask completely. Then the reaction mixture was subjected to three freeze−pump−thaw cycles to remove oxygen, and PdCl2(PPh3)2(0.022 mmol, 15.4 mg) was added under N2flow.
The reaction mixture was then refluxed for 24 h while stirring. After completion of the reaction, the solvent was removed by rotary evaporator under reduced pressure. The crude product was purified by column chromatography using cyclohexane/DCM (9:1) as eluent to isolate the pure product as a pale yellow solid. Yield: 560 mg; 90%. IR: (solid state, KBr);ν (cm−1) 3100, 3000, 2850, 1650, 1470.1H NMR (CDCl3, 400 MHz, 25°C) δ ppm: 1.15 (m, 4H, −CH2), 2.18 (t, J = 5.2 Hz, 4H,−CH2), 3.14 (t, J = 7.3 Hz, 4H,−CH2), 5.30 (d, J = 5.4, 1H, −CHCH2), 5.84 (d, J = 2.8 Hz, 1H,−CHCH2); 6.80 (dd, J = 4.1 Hz, 1H,−CHCH2), 7.38 (m, 5H, Ar-H), 7.59 (m, 2H, Ar-H).13C NMR (CDCl3, 100 MHz, 25°C) δ ppm: 27.1, 38.7, 53.6, 113.6, 120.0, 120.4, 122.8, 125.9, 127.5, 127.6, 137.1, 140.7, 149.7, 149.1. Elemental analysis: calcd.: C, 58.09; H, 5.11; Br, 36.80; observed: C, 57.75; H, 5.11; Br, 37.14. Mass (m/z) M+= 433.0, 432.0, 436.2, 437.0.
Synthesis of 3,3 ′-(2-Vinyl-9H-fluorene-9,9-diyl)bis(N,N-dime-thylpropan-1-amine), M3. 9,9-Bis(3-bromopropyl)-2-vinyl-9H- fluo-rene, M2, (550 mg, 1.27) was dissolved in 15 mL of dried and degassed THF in a 2-neckedflask, and the resulting solution was cooled down to −78 °C and then 2 M solution of dimethyl amine in THF (16.5 mmol, 8 mL) was added. Then, the reaction mixture was allowed to warm up to room temperature and kept 24 h while stirring. After completion of the reaction, the solvent and excess dimethyl amine were removed by rotary
evaporator, and the crude product was purified by column chromatography using cyclohexane/DCM (7:3) mixture as eluent to isolate the pure product as a pale yellow waxy solid. Yield: 418 mg, 91%.
1H NMR (CDCl 3, 400 MHz, 25°C) δ ppm: 0.75 (m, 4H, −CH2), 2.02 (m, 20 H,−CH2and−CH3), 5.25 (d, J = 5.2 Hz, 1H,−CHCH2), 5.78 (d, J = 2.8 Hz, 1H,−CHCH2), 6.80 (dd, J = 4.0 Hz, 1H,−CH CH2), 7.35 (m, 5H, Ar-H), 7.66 (m, 2H, Ar-H).13C NMR (CDCl3, 100 MHz, 25°C) δ ppm: 22.0, 37.8, 45.3, 54.6, 59.8, 113.0, 119.8, 120.4, 121.1, 122.8, 125.4, 126.1, 127.6, 130.1, 136.6, 140.2, 140.8, 149.7, 150.8, 152.4. IR (solid state, KBr),ν (cm−1): 3100, 1470, 3000, 1700, 2800, 1250. Elemental analysis calc. for C25H34N2·H2O: C, 78.91; H, 9.53; N,
7.36; O, 4.20; observed: C, 78.72; H, 9.61; N, 7.22. Mass (m/z) M+=
363.28, 364.28.
Synthesis of Oligomer, 3,3 ′,3″,3‴-{[(1E,1′E)-2,1,3-benzothia-diazole-4,7-diylbis(ethene-2,1-diyl)]-bis(9 H-fluorene-9,9,2-triyl)}-tetrakis(N,N-dimethylpropan-1-amine). 4,7-Dibromo-2,1,3-benzothiadiazole (322 mg, 1.10 mmol) and 3,3′-(2-vinyl-9H-fluorene-9,9-diyl)bis(N,N-dimethylpropan-1-amine), M3, (788 mg, 2.25 mmol) were placed in a 2-necked RB and dried under vacuum for 30 min. Then, degassed DMF (10 mL) was added to it and stirred for a while to dissolve the contents completely. An aqueous solution of K2CO3(5.5 mmol, 756 mg in 10 mL H2O) was added to the reaction
mixture. Then, the reaction mixture was subjected to 3 freeze−thaw− pump cycles to remove oxygen completely. A catalytic amount of Pd(OAc)2(25.3 mg, 0.113 mmol) and Pd(PPh3)4(26 mg, 0.023 mmol)
were added to it and the reaction mixture was heated to 90°C for 24 h while stirring under N2. After completion of the reaction, the solvent was
evaporated under reduced pressure and the crude product was extracted by chloroform. Then, the solvent was evaporated and the resulting residue was washed with cyclohexane to get a brown-colored sticky solid which was further dissolved in THF and precipitated into cold MeOH to yield a brownish sticky solid. Yield: 621 mg; 80%. IR (solid state, KBr)ν (cm−1): 3100, 3000, 2850, 1650, 1470, 1240.1H NMR (CDCl 3, 400 MHz, 25°C) δ ppm: 0.90 (m, 8H, CH2), 2.01 (m, 40H,−CH2and −CH3), 7.02 (d, J = 7 Hz, 4H,−CHCH), 7.41 (m, 6H, Ar-H), 7.70 (m, 10H, Ar-H).13C (CDCl 3,100 MHz, 25°C) δ ppm: 22.0, 37.8, 45.2, 54.7, 59.7, 120.1, 121.1, 123.8, 125.5, 126.4, 127.1, 129.4, 133.8, 136.7, 140.8, 150.5, 150.7, 154.0. IR (solid state, KBr)ν (cm−1): 3100, 3000, 2850, 1650, 1470, 1240. Elemental analysis: calcd.: C, 78.45; H, 8.00; N, 9.80; S, 3.74; observed: C, 78.49; H, 8.21; N, 9.99; S, 3.31. Mass (m/z) M+= 857.51, 858.52, 859.53, 860.53, 861.53.
Nanoparticle Preparation. For preparation of nanoparticles of oligomer, a stock solution of oligomer in THF (10 mg/mL) was prepared before dilution with THF to get different concentrations. One milliliter of oligomer solution was injected into 20 mL of deionized water under sonication. After the nanoparticle preparation THF was removed from the dispersion by rotary evaporator under reduced pressure. Then the nanoparticles were characterized by zeta sizer, SEM, and TEM.
CB7-Capped Nanoparticles. To prepare CB7-capped NPs, we mixed the aqueous solution of CB7 (by taking into consideration the number of amine groups on the oligomer) with preprepared NPs. The mixture was stirred gently and dialyzed using a 14 kDa MWCO regenerated cellulose membrane for about 5 h against water to remove uncomplexed CB7.
Synthesis of Drug Loaded Nanoparticles. In a typical procedure to prepare drug loaded NP with a drug to oligomer ratio of 1:25 (w/w), oligomer (4.0 mg, 4.66× 10⁻³ mmol) was dissolved in 1 mL THF. Camptothecin, CPT, (160μg, 0.46 × 10⁻³mmol) was dissolved in 320 μL THF. Then these two solutions were well dissolved by sonication for 10 min. The resulting solution was injected rapidly into 20 mL of deionized water while sonicating, and sonication was continued for 30 min. THF was removed under reduced pressure, and the nanoparticle dispersion was concentrated to 10 mL and dialyzed against 100 mL deionized water using a 14 kDa MWCO regenerated cellulose membrane for 24 h to remove any remaining unloaded CPT. Tween 20 (0.2% v/v) was added to dialysate to solubilize the free CPT. UV−vis absorbance spectrum (λmax= 366 nm) of the dialysates were recorded to
of CPT dissolved in water containing Tween 20 (0.2%,v/v) were used to obtain a calibration curve of CPT.
In Vitro Drug Release Studies. Concentrated (5 mL) drug encapsulated NP dispersion was mixed with 5 mL of phosphate (pH 7.4) or acetate (pH 5.0) buffer for neutral or acidic medium release, respectively. Phosphate buffer (10 mM, 100 mL, pH = 7.4) or acetic buffer (10 mM, 100 mL, pH = 5) containing 0.2% Tween 20 was used as the release medium. Drug encapsulated NP dispersion mixed with phosphate or acetate buffer transferred into a cellulose tubular membrane with a molecular weight cutoff 14 kDa. These were placed in a beaker containing phosphate or acetate buffer medium, respectively, and shaken at 60 rpm and 37°C in an incubator. Two milliliters of aliquot was taken from dialysate at different time intervals. At each time, equal amount of fresh PBS or acetate buffer was added to the dialysate beaker to keep the dialysis conditions constant. The release medium was completely replaced by fresh buffer solution at specific time intervals to keep different concentration gradients inside and outside the tubular membrane.
MTT Cell Viability Assay. Breast cancer cell lines (MCF7 and MDA-MB-231; ATCC) were cultured in 10% FBS at 37°C with 5% CO2. For cell viability assays, 2× 10³cells were seeded in 96-well tissue
culture plates, and the next day cells were treated with different concentrations of Dulbecco’s Modified Eagle Medium (DMEM; control), NP, CPT, CB, NP+CB, CPT+NP, CPT+CB+NP, and DMSO (Supporting Information Table S2), each with four replicas. After 72 h, culture media was removed and 10μL filtered 12 μM MTT stock solution (Sigma-Aldrich) was added to 100μL fresh medium in each well. After 4 h the formazan crystals were dissolved in SDS solution (0.3 M in 0.01 M HCl) and maintained in a 37°C incubator for 18 h. Color absorbance was measured using a microplate reader (uQuant, Biotek) at a wavelength of 570 nm. Results were analyzed upon normalization with respective DMEM control replicas.
Statistical Analysis. Differences in MTT relative cell viability (normalized to DMEM control group) were analyzed for each dose in
each cell line separately using one-way ANOVAs followed by multiple comparisons (Tukey’s at α = 0.05; Matlab). IC50 values of different
formulations in breast cancer cell lines were calculated based on four-parameter polynomial model (Graphpad).
Microscopy Experiments. Breast cancer cell lines, MCF7 and MDA-MB-231, were cultured on 22× 22 mm2coverslips in 6-well tissue culture plates at a density of 2× 10⁵per well in DMEM/low glucose (HyClone). The next day, cells were treated with 1μM of NP or 1 μM/4 μM of NP+CB to compare with a no-treatment control group. After 72 h cells were washed in PBS,fixed 10 min in 4% paraformaldehyde, and permeabilized in 0.1% Triton X-100. They were then incubated with phalloidin (Alexa Fluor 488, Molecular Probes) for 40 min at room temperature. Nuclei were stained with DAPI solution for 10 min at room temperature. After washings in PBS, coverslips were mounted on slides. Images were captured usingfluorescent microscope (Axio Imager A1, Zeiss) with 40× and 100× objectives. Moreover, to assess whether 24 h treatment with NP and NP+CB was effective for internalization of nanoparticles in the absence as well as the presence of camptothecin (0.03μM), we performed experiments with MCF7 cells seeded at a density of 5× 10⁵in 6-well plates onto coverslips for three experimental groups in duplicate, namely, only DMEM control, 0.5μM NP, and NP +CB (0.5μM and 2 μM, respectively). After 24 h of treatment and fixation with 4% PFA, staining with DAPI was performed as described previously. The experiment was repeated for MCF7 cells seeded at a density of 2× 10⁵and treated for 72 h with drug loaded NP and NP+CB.
Images were captured using the 100× objective (Axio Imager A1, Zeiss).
■
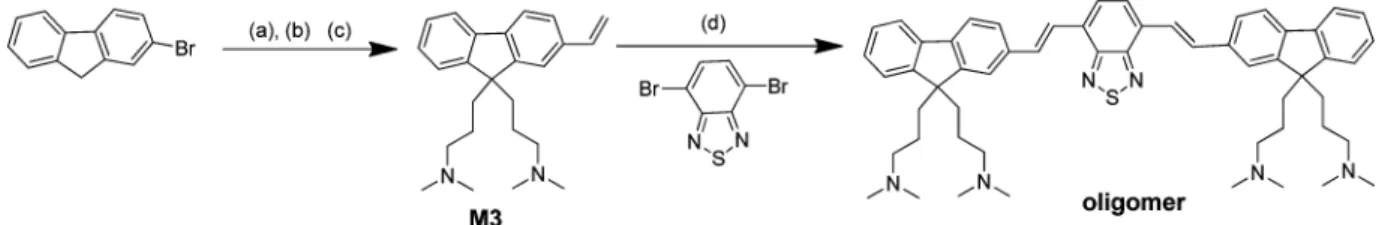
RESULTS AND DISCUSSIONOligomer, namely, 3,3 ′,3″,3‴-{[(1E,1′E)-2,1,3-benzothiadia-zole-4,7-diylbis(ethene-2,1-diyl)]-bis(9H- fluorene-9,9,2-triyl)}-tetrakis(N,N-dimethylpropan-1-amine) was synthesized accord-ing to Scheme 1. Briefly, the reaction of 2-bromofluorene with 1,3-dibromopropane in the presence of aqueous solution of Scheme 1. Synthetic Route to Oligomer, 3,3 ′,3″,3‴-{[(1E,1′E)-2,1,3-Benzothiadiazole-4,7-diylbis(ethene-2,1-diyl)]-bis(9H-fluorene-9,9,2-triyl)}-tetrakis(N,N-dimethylpropan-1-amine)a
a(a) 1,3-Dibromopropane, aq. NaOH (50%, w/w), tetra-butyl ammonium bromide (TBAB), 80 °C, 1 h, 64%;3,4 (b) tributyl vinyltin, Pd(Cl2)(PPh3)2, 2,6-di-tert-butyl phenol, toluene, 100°C, 24 h, 90%; (c) dimethyl amine, THF, 0 °C−RT, 24 h, 91%; (d) aq. K2CO3, Pd(OAc)2,
Pd(PPh3)4, DMF, 90°C, 24 h, 80%.
NaOH afforded 2-bromo-9,9-bis(3-bromopropyl)-9H-fluorene (M1).3,4The reaction of M1 with tributylvinyltin in toluene in the presence of palladium catalyst gave 9,9-bis(3-bromo-propyl)-2-vinyl-9H-flourene, M2. Then, the compound M2 was reacted with dimethyl amine to yield 3,3′-(2-vinyl-9H-flourene-9,9-diyl)-bis(N,N-dimethylpropane-1-amine), M3. Oligomer was synthe-sized by the Heck coupling of 3 with 4,7-dibromo-2,1,3-benzothiadiazole and purified by the precipitation of its THF solution in cold methanol. It was characterized by spectroscopic techniques (FT-IR,1H NMR,13C NMR) including elemental
analysis and mass spectrometer. Figure 1 shows the1H NMR
spectrum of oligomer which confirms its expected structure. The oligomer exhibits good solubility in chloroform, THF, acetonitrile, and DMF but not in methanol, ethanol, and water. Synthesis of Nanoparticles and Investigation of Their Stabilities. Oligomer contains a large hydrophobic backbone (divinyl fluorene and benzothiodiazole) and side chains with hydrophilic amine groups owing to the structural features these self-assembled nanoparticles could form in water. In order to investigate the effect of oligomer concentration on the nanoparticle formation and optimize the sizes of the nano-particles, oligomer solution in THF with varying concentrations of 1, 2, 3, 4, and 5 mg/mL were selected to prepare nanoparticles. The hydrodynamic diameter of the prepared nanoparticles (NPs) was determined by dynamic light scattering (DLS) measurements. For each concentration, the experiments were repeated at least 3 times by keeping the same preparation conditions. It was observed that, by increasing oligomer concentration, the size of NPs increased gradually ranging from 48.97± 0.34 nm for 1 mg/mL to 90.75 ± 0.96 nm for 5 mg/
mL. The zeta potential values were found to be ranging from +20 ± 1.4 to +57.2 ± 0.6 for concentrations between 1 mg/mL to 5 mg/mL. This positive value of zeta potential was due to the amine functional group in the pendant chain of oligomer indicating the formation of stable nanoparticle dispersion caused by repulsion between the nanoparticles. SEM and TEM images showed a good agreement with the DLS data with a particle size of∼50 nm. Supporting Information Table S1 and Figures S11, S12 show the average zeta size, polydispersity index (PDI), and zeta potential of NPs for different concentration of oligomer solution. For further investigation we selected the oligomer concentration as 4 mg/mL with the NP size of 57.0± 0.69 nm with PDI of 0.185± 0.031 and zeta potential of 52.5 ± 1.3. Figure 2a,b,c shows the SEM, TEM images and DLS histogram, respectively, of oligomer with concentration of 4 mg/mL THF. The stability of NPs over time was investigated in water and phosphate buffer (pH 7.4). During this period, the NPs were highly stable and no precipitation occurred. On the other hand, nanoparticles precipitated in acetate buffer (pH 5.0) within a short time period of∼5 h, indicating the protonation of amine groups on the nanoparticles; once the amine groups are protonated, nanoparticles start to swell leading to the disassembly of nanoparticles. The stability of NPs was also investigated in different biological media including milk protein, bovine serum albumin, DMEM, and human serum albumin. For these experiments, 1 mL of NP dispersion was mixed with an equal amount of medium and shaken at 60 rpm at 37°C for 24 h. As can be seen from Figure 3a, NPs were highly stable in DMEM maintaining their initial size. Although in BSA and milk no precipitate formation was observed, the sizes of nanoparticles
Figure 2.(a) SEM (scale 1μm), (b) TEM (scale 50 nm) images and dynamic light scattering (DLS) histogram of oligomer nanoparticles.
slightly increased (Figure 3b). On the other hand, NPs precipitated in human serum albumin during the incubation possibly due to the nonspecific interaction of amine groups of nanoparticles with blood serum proteins causing the aggregate formation.
In order to circumvent the nonspecific interactions of amine groups with proteins and increase the stability of NPs in the biological media, we developed a simple strategy by taking advantage of the high binding affinity of amine groups toward cucurbiturils26−30(CBs) (Scheme 2). CB7 was selected in this study due its good water solubility. To prepare CB7-capped NPs, we mixed the aqueous solution of CB7 (by taking into consideration the number of amine groups on the oligomer) with preprepared NPs. The mixture was stirred gently and dialyzed briefly against water to remove uncomplexed CB7.
DLS measurement showed that the sizes of CB7-capped nanoparticles have increased only by∼5 nm to get 62.13 ± 2.11 nm (Supporting Information Figure S16). The SEM data also support the result obtained from DLS experiment (Supporting Information Figure S16-c). However, the zeta potential of CB7 capped oligomer NPs were decreased to +24.4± 2.31 mV from its original value (without CB addition) of +52.5 ± 1.3 mV indicating the complexation between CB7 and amine groups (Supporting Information Figure S17).
Furthermore, CB-capped NPs have remained stable in water and in phosphate buffer (pH 7.4) solutions over a period of 35 days, but precipitated in the acetate buffer as observed with the nanoparticles without CB7s. We have also found that CB-capped NPs were highly stable without any precipitation in blood serum proteins over 24 h incubation period; this clearly indicates that CB7s have been preventing the interaction of nanoparticles with proteins by capping amine groups.
To gain insight into the location of CB7 on the NPs, we have conducted 1H NMR experiments. For these experiments,
samples were prepared by freeze−drying the aqueous dispersions of NPs with CB7 and without CB7. In both cases, the freeze− dried NPs redispersed well in water and D2O. Only a slight
increase was observed in their sizes according to DLS
measurements. Although the peaks in the1H NMR spectra of NPs are quite broad due to self-assembly of oligomer chains, we can still differentiate the differences in the spectra of CB-capped NPs and NPs without CBs (Supporting Information Figure S15). In the1H NMR spectrum of CB-capped NPs, the peaks for
the protons of pendant groups of oligomer are downfield shifted comparing to the peaks in the spectrum of NPs in the absent of CB7. Especially, the downfield-shifting is more significant (approx. 0.2 ppm) in the case of dimethylamine protons, indicating that pendant groups are not encapsulated by CB7 but CB7 is in close proximity to the pendant group and there is an interaction between the nitrogen of the dimethyl amine and the carbonyl groups of CB7; because of this interaction the protons of dimethylamine groups were deshielded and the signal due to these protons shifted downfield.
Optical Properties of Oligomer and Its Nanoparticles. The optical properties of oligomer in THF, chloroform, and the nanoparticle dispersion in water were studied by UV−visible and fluorescence spectroscopy (Figure 4) and tabulated in Table 1. UV−vis absorption wavelengths of oligomer in chloroform, THF, and DMF were not significantly different (λmaxat 473, 466,
and 473 nm, respectively), while for the nanoparticle dispersion in water, UV−vis absorption wavelength (λmax) appeared at 455
nm exhibiting an 11−18 nm blue-shift compared to the aforementioned solutions of oligomer. Fluorescence spectra showed that the emission of oligomer in chloroform, THF, and DMF and NPs in water were 595, 605, 602, and 615 nm, respectively. Nanoparticles in water exhibited a red shift compared to its solution in organic solvents.
The changes in the optical properties can be explained by both inter- and intrachain interaction, as well as the solvent polarity.12,20 Fluorescent quantum yields of oligomer in chloroform, THF, DMF, and nanoparticles of oligomer in water were calculated as 51.3%, 46.8%, 36.1%, and 15.6%, respectively.
Drug Loading Study of Oligomer Nanoparticles. To investigate the drug loading and drug release properties of nanoparticles, camptothecin (CPT) was used as the model Scheme 2. Overview of the Preparation of CB-Capped Drug-Loaded Nanoparticles and pH-Triggered Drug Release Mechanism of the Nanoparticles
anticancer drug. The amount of loaded drug was calculated by measuring the drug concentrations before and after being loaded by nanoparticles. The absorption of dialysate was recorded for λmaxof CPT at 366 nm and the concentration of loaded CPT was
computed using a standard calibration plot that was prepared under identical conditions for known concentrations of CPT. The entrapment efficiency (EE) and drug loading efficiency (DLE) were calculated according to the following eqs 1 and 2.
= ×
EE% Amount of loaded drug/total amount of drug 100
(1)
=
+ ×
DLE% Amount of loaded drug/(amount of loaded drug amount of oligomer) 100 (2)
Four sets of drug loaded NPs were prepared with drug to oligomer ratios of 1:25 (w/w), 17.2:1 (w/w), 12.5:1 (w/w), and 6.25:1 (w/w) to investigate the entrapment and drug loading efficiency of nanoparticles. After encapsulation of drug, the nanoparticles retained their spherical shape with a small increment of ∼5−10 nm in the average hydrodynamic size. The drug loading content (EE) increased and reached a maximum value 95.8± 0.7% with an increase of feed amount ratio of CPT to oligomer at 17.2:1 (Figure 5). The entrapment ratio was dropped to 40.0 ± 1.1 by further increase of feed amount of CPT to oligomer by 6.25:1. Figure 6 showed that the entrapment efficiency and drug loading efficiency of nano-particles varied with different drug to oligomer ratios.
The drug loading efficiency increased by augmentations on the drug to oligomer ratio and reached an optimum value of 5.86± 0.04% for 17.2:1 (Figure 6). Further increase of the feeding amount of drug did not greatly affect the drug loading efficiencies. By considering both the entrapment and drug loading efficiencies, the ratio of drug to oligomer was fixed at 17.2:1 for further studies. Hydrophobic effect and π−π interactions between the aromatic moiety of oligomer and the aromatic rings of CPT might be a possible driving force for the encapsulation of drug molecules to the nanoparticles.21
In Vitro Drug Release Study of Oligomer Nanoparticles. The in vitro drug release studies of oligomer nanoparticles were carried out in two pH media, viz., in phosphate buffer (pH 7.4) and in acetate buffer (pH 5.0) as described in the Experimental Section. For drug release studies the drug to oligomer ratio was
Figure 4.UV−vis absorption and emission spectra of oligomer in THF, chloroform, and oligomer NPs in water.
Table 1. Optical Properties of Oligomer in Different Solvents and Dispersion of Oligomer Nanoparticles in Water
solvent (nm)λabs (nm)λem Φf a (%) ε b(cm−1 M−1) brightnessc (cm−1M−1) CHCl3 473 595 51.3 25728 13198 THF 466 605 46.8 27598 12916 DMF 473 602 36.1 44097 15917 Water 455 615 15.6 19548 3050
aFluorescent quantum yields are calculated using Rhodamine B in ethanol as standard (Φf: 98%).bMolar absorptivity.cProduct of molar
absorptivity andfluorescent quantum yield.
Figure 5.(a) SEM (scale 1μm), (b) TEM (scale 100 nm), and (c) DLS histogram of CPT loaded oligomer nanoparticles.
Figure 6. Entrapment efficiency and drug loading efficiency of nanoparticles with different drug to oligomer ratios.
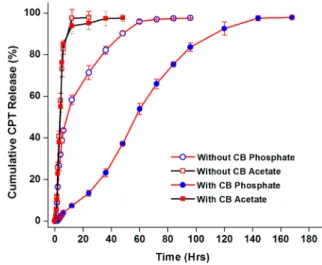
kept at 17.2:1 as optimized in drug loading studies. Release of the CPT from the nanoparticles in acetate buffer was relatively faster than that in the phosphate buffer (Figure 7). About 97% of the
CPT was released from the nanoparticle at pH 5.0 in thefirst 12 h, but only 46% of CPT was released in a neutral environment in the same time period. CPT release from the nanoparticles in phosphate buffer was completed (∼98%) only in 84 h. The faster release of CPT from the nanoparticles in an acidic environment can be explained by the disassembly of nanoparticles by the positive charge formation at amino group (to ammonium ion) in the presence of an acidic environment as shown in Scheme 2.
Further, drug release studies of CB7-capped NPs were conducted using the same drug to oligomer ratio. Scheme 2 illustrates the preparation of CB-capped drug loaded nano-particles and the pH-triggered drug release mechanism of these nanoparticles. Release of CPT at pH 5.0 from CB7-capped NPs was found to be almost similar to that in the absence of CB. However, in the case of phosphate buffer (pH 7.4), the release of drug was much slower; in thefirst 12 h, only 7.5% and around 60 h 50% of the CPT were released. The CPT release from the CB capped nanoparticles was completed (∼98%) by 144 h, at a rate slower than that obtained from CB uncapped nanoparticles.
The results clearly show that the presence of CBs provides a sustained drug release in the physiological pH but enables fast
release at low pH, which can be found in the tumor micro environments.32,33
In Vitro Cell Assays. MTT assays have been frequently used to test the cytotoxic activity of nanoparticles in breast cancer cell lines.34,35In our study, MCF7 and MDA-MB-231 breast cancer cells treated with NP exhibited significant reductions in relative cell viability dose-dependently (Figure 8). MDA-MD-231 cells were more resistant to NP treatment at lower concentrations 0.125−0.5 μM (0.332−0.934; log10 μM) but exhibited similar reductions in cell viability as obtained for MCF7 cells. At the given concentrations a subpopulation of cells remained alive in both cell types (Figure 8). IC50values of NP, calculated based on
four-parameter polynomial model, were 44.7μM and 24.8 μM for MCF7 and MDA-MB-231, respectively. Viabilities in CB alone and NP+CB treatments were similar and comparable to DMEM control group. These results demonstrated that NP driven toxicity could be reversed in NP+CB complex suggesting that toxicity of NP was reduced in the presence of CB at the given 1:4 (NP:CB) ratio.
Increased efficiency in drug delivery is another functionality nanoparticles can offer. Drug delivery capacity of NP and NP +CB treatments was measured in MCF7 and MDA-MB-231 breast cancer cell lines in response to CPT in a dose-dependent manner (Figure 9). Both cell lines exhibited reduced cell viability when given together with NP or NP+CPT in comparison to CPT treatment alone. DMSO treatment had no significant effect on cell viability when normalized to DMEM untreated controls. IC50 values for treatments, calculated using a four-parameter polynomial fit on logarithmically transformed CPT concen-trations, showed that CPT+NP and CPT+NP+CB complexes resulted in significant reductions in cell viability when compared with that obtained by treatment with CPT alone (Figure 10). One-way ANOVA of the relative cell viability performed for each cell line at each dose followed by multiple test comparisons revealed significant pairwise differences between CPT+NP/CPT +NP+CB and CPT alone (Figure 9).
MCF7 and MDA-MB-231 breast cancer cell lines have been effective models to estimate toxicity as well as drug delivery capacity of nanoparticles. For example, emodin (EMO) loaded solid lipid nanoparticles (SLN) exhibited higher cytotoxicity with respect to EMO solution using MTT tests in MCF7 and MDA-MB-231 cells.35In our study, MCF7 and MDA-MB-231 cells had IC50 values for camptothecin (CPT) at 0.541 and 0.615μM, respectively. In both cell lines, complex formation of NP with CB (NP+CB) effectively reduced IC50 values by 35% and 23%, Figure 7.CPT release profile of oligomer nanoparticle in phosphate
(pH 7.4) and acetate buffer (pH 5.0).
Figure 8.Relative cell viability (%) measurements obtained from MTT analyses at the given concentrations (log10,μM) of NP, CB, and NP+CB treatments upon normalization with DMEM control group in MCF7 and MDA-MB-231 breast cancer cell lines (Supporting Information Table S2). Experimental groups with significant multiple pairwise test differences were indicated in comparison with NP group at p < 0.05.
respectively, for MCF7 and MDA-MB-231. The dose dependent cytotoxic effect of NP/NP+CB encapsulating CPT was relatively greater for MCF7 than for MDA-MB-231 (Figure 9).
Dual-fluorescent staining in microscopy plays an important role for obtaining insight into the location of nanoparticles taken up in the cell. We used phalloidin cytoskeletal staining together with nuclear DAPI staining in MCF7 and MDA-MB-231 breast cancer cells to overlay with the images obtained for the NP and NP+CB (Figure 10).
Merged images indicated that nanoparticles were relatively enriched near the nuclear membrane and mostly located in cytoplasm as diffused or relatively aggregated specks (as in the case of MCF7 and MDA-MB-231, respectively; Figure 10) raising the possibility of NPs being enriched in intracellular compartments including endosomes and/or lysosomes. Similar studies performed with other nanoparticle types indeed showed that nanoparticles might be trapped in cytosolic vesicles upon uptake.36 For example, distribution of quantum dots differed from phase to phase in a time dependent manner, and phase 3 was characterized by perinuclear vesicular enrichment of these dots.36,37 Xiao et al. have suggested that the route taken by quantum dots into the cell could be through endocytosis followed with sequestration into early endosomes and then targeting to late endosomes or lysosomes.38pH values of early endosomes (5.9−6.0) and lysosomes (4.0−5.5) vary, and thus translocation of nanoparticles from one compartment to another also might have an effect on visibility of nanoparticles that exhibit
sensitivity to pH.38,39The NP in the present study exhibited pH sensitivity, and at low pH values NP had lower emission intensity as we also studied the pH sensitivity of NPs by fluorescence spectroscopy (see SI for discussion and Figure S13). Therefore, intracellular pH sensitivity and differential targeting of naïve and drug-loaded NP and NP+CB should be tested over time in future studies by simultaneously tracing the particles for colocalization with early endosomal and late endosomal/lysosomal markers.
Our findings also demonstrated that naive as well as camptothecin-loaded NP and NP+CB were taken up by MCF7 cells as early as 24 h of exposure (SI, Figure S18). Naive NP upon complexation with CB produced weaker signals in the cell at 72 h (Figure 10) but not at 24 h (SI Figure S18). Florescent signals from drug-loaded NP and NP+CB were detected densely in the cytoplasm potentially due to reduced cytoplasmic volume, and at times overlapped with the signal obtained from nuclear stain DAPI at both 24 and 72 h time points (SI Figure S18). Expectedly, drug loaded NP and NP+CB resulted in cytotoxicity as evidenced by reduced cell number and nuclear size when compared with DMEM control groups at 24 and 72 h treatments (SI Figure S18). These results suggest that intracellular targeting, metabolism, pH sensitivity, and intensity of NP and NP+CB might be affected by the batch of NP/NP+CB, absence/presence of drugs in NP, as well as cell type and dose/time of the exposure. Hence, future studies should focus on quantitative analysis of differences in the uptake and intensity of fluorescence signals emitted by NP and NP+CB in a time and drug-dose dependent
Figure 9.Relative cell viability (%) measured by MTT in response to camptothecin (CPT) at the given concentrations (log10,μM) of DMSO control, CPT alone, CPT+NP, and NP+CB+CPT treatments upon normalization with DMEM control groups in MCF7 and MDA-MB-231 breast cancer cell lines (Supporting Information Table S2). IC50values were calculated based on four-parametric polynomialfit model separately for each treatment
group. Experimental groups with significant multiple pairwise test differences were indicated in comparison with CPT group at p < 0.05.
Figure 10.MCF7 and MDA-MB-231 cells treated with NP and NP+CB complexes and compared with Control (DMEM) group. Nuclei were stained with DAPI (blue; LP420) while phalloidin antibody was used for staining F-actin (green; FITC; LP515). Emission from nanoparticles was obtained using LP590 redfilter, and images from all three channels were overlaid (Axio Imager A1, Zeiss).
manner using differential organelle markers and high resolution microscopy.
■
CONCLUSIONIn this paper we have demonstrated the use of red emitting conjugated oligomer in the nanoparticle synthesis. These conjugated oligomer-based self-luminescent, pH-responsive nanoparticles could be used for controlled-drug delivery and in vivo imaging owing to its red to far-red emission with high quantum yield and brightness, which are highly sought after for optical imaging.
MTT cell viability studies performed with breast cancer cell lines for MCF7 and MDA-MB-231 clearly showed that the presence of CBs reduced the cytotoxicity. The toxicity effect could be attributable to the presence of amine groups on the side chains of oligomer. In order to decrease the cytotoxicity and increase further the stability of nanoparticles, amine groups were disguised by capping with CB7 as the partially protonated amines could complex with the carbonyl groups of CBs. Moreover, through CB-capping of nanoparticles, the drug-release rate could be regulated.
■
ASSOCIATED CONTENT*
S Supporting Information1H and13C NMR and mass spectra of monomers and oligomer.
DLS and zeta potential histograms of nanoparticles. PL spectra of pH titration of nanoparticles. Fluorescent microscope images for MCF7 cells exposed to NP or NP+CB in the absence or presence of CPT for 24 and 72 h. This material is available free of charge via the Internet at http://pubs.acs.org.
■
AUTHOR INFORMATIONCorresponding Authors
*E-mail: [email protected]. *E-mail: [email protected].
Notes
The authors declare no competingfinancial interest.
■
ACKNOWLEDGMENTSWe acknowledge TUBITAK-TBAG 112T704 and COST Action TD1004 (Theragnostics Imaging and Therapy: An Action to Develop Novel Nanosized Systems for Imaging-Guided Drug Delivery).
■
REFERENCES(1) Tuncel, D.; Demir, H. V. Nanoscale 2010, 2, 484−494.
(2) Ozel, I. O.; Ozel, T.; Demir, H. V.; Tuncel, D. Opt. Express 2010, 18, 670−684.
(3) Park, E. J.; Erdem, T.; Ibrahimova, V.; Nizamoglu, S.; Demir, H. V.; Tuncel, D. ACS Nano 2011, 5, 2483−2492.
(4) Ibrahimova, V.; Ekiz, S.; Gezici, O.; Tuncel, D. Polym. Chem. 2011, 2, 2818−2824.
(5) Pecher, J.; Mecking, S. Chem. Rev. 2010, 110, 6260−6279. (6) Landfester, K. Angew. Chem., Int. Ed. 2009, 48, 4488−4507. (7) Wu, C.; Chiu, D. T. Angew. Chem., Int. Ed. 2013, 52, 3086−3109. (8) Rahim, N.A. A.; McDaniel, W.; Bardon, K.; Srinivasan, S.; Vickerman, V.; So, P. T. C.; Moon, J. H. Adv. Mater. 2009, 21, 3492− 3496.
(9) Moon, J. H.; McDaniel, W.; MacLean, P.; Hancock, L. E. Angew. Chem., Int. Ed. 2007, 46, 8223−8225.
(10) Howes, P.; Thorogate, R.; Green, M.; Jickells, S.; Daniel, B. Chem. Commun. 2009, 2490−2492.
(11) Moon, J. H.; McDaniel, W.; MacLean, P.; Hancock, L. E. Angew. Chem., Int. Ed. 2007, 46, 8223−8225.
(12) Wu, C.; Bull, B.; Szymanski, C.; Christensen, K.; McNeill, J. ACS Nano 2008, 2, 2415−2423.
(13) Pu, K. Y.; Liu, B. Adv. Funct. Mater. 2009, 19, 277−284. (14) Howes, P.; Green, M.; Parker, D.; Varma, G.; Kallumadil, M.; Hughes, M.; Warley, A.; Brain, A.; Botnar, R. J. Am. Chem. Soc. 2010, 132, 9833.
(15) Howes, P.; Green, M.; Levitt, J.; Suhling, K.; Hughes, M. J. Am. Chem. Soc. 2010, 132, 3989.
(16) Pu, K.; Shuhendler, A. J.; Jokerst, J. V.; Mei, J.; Gambhir, S. S.; Bao, Z.; Rao, J. Nat. Nanotechnol. 2014, 9, 233−239.
(17) Feng, L.; Zhu, C.; Yuan, H.; Liu, L.; Lva, F.; Wang, S. Chem. Soc. Rev. 2013, 42, 6620−6633.
(18) Wang, X.; He, F.; Li, L.; Wang, H.; Yan, R.; Li, L. ACS Appl. Mater. Interfaces 2013, 5, 5700−5708.
(19) Feng, X. L.; Lv, F. T.; Liu, L. B.; Tang, H. W.; Xing, C. F.; Yang, Q. O.; Wang, S. ACS Appl. Mater. Interfaces 2010, 2, 2429−2435.
(20) Gong, H.; Cheng, L.; Xiang, J.; Xu, H.; Feng, L.; Shi, X.; Liu, Z. Adv. Funct. Mater. 2013, 23, 6059−6067.
(21) Gezici, O.; Durmaz, I.; Bilget Guven, E.; Unal, O.; Ozgun, A.; Cetin-Atalay, R.; Tuncel, D. RSC Adv. 2014, 4, 1302−1309.
(22) Kaeser, A.; Schenning, A. P. H. J. Adv. Mater. 2010, 22, 2985− 2997.
(23) Fischer, I.; Petkau-Milroy, K.; Dorland, Y. L.; Schenning, A. P. H. J.; Brunsveld, L. Chem.Eur. J. 2013, 19, 16646−16650.
(24) Fischer, I.; Kaeser, A.; Peters-Gumbs, M. A. M.; Schenning, A. P. H. J. Chem. Eur. J. 2013, 19, 10928−10934.
(25) Masson, E.; Ling, X.; Joseph, R.; Kyeremeh-Mensaha, L.; Lua, X. RSC Adv. 2012, 2, 1213−1247.
(26) (a) Tuncel, D.; Unal, O.; Artar, M. Isr. J. Chem. 2011, 51, 525− 532. (b) Tuncel, D.; Artar, A.; Hanay, S. B. J. Polym. Sci., Part A: Polym. Chem. 2010, 48, 4894−4899.
(27) Kim, K.; Selvapalam, N.; Ko, Y. H.; Park, K. M.; Kim, D. Chem. Soc. Rev. 2007, 36, 267.
(28) Isaacs, L. Chem. Commun. 2009, 619.
(29) Uzunova, V. D.; Cullinane, C.; Brix, K.; Nau, W. M.; Day, A. I. Org. Biomol. Chem. 2010, 8, 2037−2042.
(30) Lim, Y.-B.; Kim, T.; Lee, W.; Kim, S.-M.; Kim, H. J.; Kim, K.; Park, J.-S. Bioconjugate Chem. 2002, 13, 1181−1185.
(31) Macartney, D. H. Isr. J. Chem. 2011, 51, 600−615.
(32) Gao, W.; Chan, J. M.; Farokhzad, O. C. Mol. Pharmaceutics 2010, 7, 1913−1920.
(33) Casey, J. R.; Grinstein, S.; Orlowski, J. Nat. Rev. Mol. Cell. Biol. 2010, 11, 50−61.
(34) Alarifi, S.; Ali, D.; Alkahtani, S.; Alhader, M. S. Biol. Trace Elem Res. 2014, 159, 416−424.
(35) Wang, S.; Chen, T.; Chen, R.; Hu, Y.; Chen, M.; Wang, Y. Int. J. Pharm. 2012, 430, 238−46.
(36) Damalakiene, L.; Karabanovas, V.; Bagdonas, S.; Valius, M.; Rotomskis, R. Int. J. Nanomed. 2013, 8, 555−68.
(37) Zhang, L. W.; Monteiro-Riviere, N. A. Toxicol. Sci. 2009, 110, 38− 155.
(38) Xiao, Y.; Forry, S. P.; Gao, X.; Holbrook, R. D.; Telford, W. G.; Tona, A. J. Nanobiotechnol. 2010, 8−13.