DOI 10.1007/s40618-015-0409-1 ORIGINAL ARTICLE
Impact of glucocorticoid receptor gene (NR3C1) polymorphisms
in Turkish patients with metabolic syndrome
Z. Kaya1,2 · S. Caglayan3 · M. Akkiprik1 · C. Aral4 · G. Ozisik5 · M. Ozata6 · A. Ozer1
Received: 7 September 2015 / Accepted: 1 November 2015 / Published online: 23 November 2015 © Italian Society of Endocrinology (SIE) 2015
Results BclI GG genotype was significantly associated with an increased risk of MetS (p = 0.02). Also, only in women, the G allele carriers were significantly associated with higher C-peptide. T allele carriers of TthIII1 poly-morphism were significantly associated with higher C-pep-tide, triglyceride, insulin and C-reactive protein (CRP,
p value 0.048, 0.022, 0.005 and 0.022, respectively), and lower fasting blood glucose (FBG, p = 0.02). The com-bined carriers of BclI polymorphism G allele and TthIII1 polymorphism T allele were significantly associated with higher diastolic blood pressure in all patients, and lower FBG and postprandial blood glucose in only men. All the ER22/23EK polymorphisms coexisted with polymorphic variant of TthIII1 (p = 0.0058).
Conclusion The presence of homozygote polymorphic variant of BclI might be good predictive markers for the disease susceptibility. The BclI and the TthIII1 polymor-phism are associated with sex-specific clinical parameters. Our findings also suggest that the combination of BclI and TthIII1 polymorphisms may play a protective role in blood glucose.
Keywords Metabolic syndrome · Glucocorticoid receptor
gene · Glucocorticoid
Introduction
The metabolic syndrome (MetS) is characterized by a cluster of metabolic factors, including insulin resistance and type 2 diabetes, abdominal obesity, atherogenic dys-lipidemia, raised blood pressure, proinflammatory state and prothrombotic state [1, 2]. Glucocorticoid hormones may play an important role in the regulation of metabolic syn-drome components. Effects of GC hormones are generally
Abstract
Background The metabolic syndrome (MetS) is charac-terized by a cluster of metabolic factors, including insulin resistance and type-2 diabetes, abdominal obesity, dyslipi-demia, hypertension and microalbuminuria. Impaired glu-cocorticoid receptor (GR) activity also plays an important role in the etiology of MetS. The objective of our study is to evaluate the effects of GR gene polymorphisms (BclI, N363S, TthIII1 and ER22/23EK) in Turkish patients with MetS.
Materials and methods Seventy subjects with MetS and 185 healthy controls were enrolled in the study. PCR– RFLP analysis was used for genotyping. Results for each polymorphism have been verified by allele-specific oligo-nucleotide analysis.
Z. Kaya and S. Caglayan contributed equally to this work. * A. Ozer
1 Department of Medical Biology, School of Medicine,
Marmara University, Bas¸ıbüyük Mah., Maltepe Bas¸ıbüyük Yolu Sok., No: 9/1, Maltepe, 34854 Istanbul, Turkey
2 Department of Medical Biology, School of Medicine,
Yuzuncu Yıl University, Van, Turkey
3 Division of Endocrinology and Metabolism, Department
of Internal Medicine, School of Medicine, I˙stanbul Medipol University, Istanbul, Turkey
4 Department of Molecular Biology, Faculty of Arts
and Sciences, Namık Kemal University, Tekirdağ, Turkey
5 Memorial Wellness Endocrinology and Metabolism, Zorlu
Center, Zincirlikuyu, Istanbul, Turkey
6 Parc 15 Endocrinology and Metabolism Clinic, Altunizade,
mediated by the glucocorticoid receptor (GR) [3]. Genetic variations in GR gene (NR3C1) have a potential effect on the GR receptor protein characteristic and expression. This suggests that GR gene polymorphisms are associated with differences in GC sensitivity and in metabolic parameters [4–6]. In early studies, polymorphism of GR gene was the BclI polymorphism (rs41423247). BclI restriction fragment length polymorphism (RFLP) was identified as a C→G nucleotide change in 646 nucleotide downstream of exon 2 (intron 2) [5, 7, 8]. G allele of this BclI polymorphism was associated with increased sensitivity to GCs [5], increased abdominal obesity [9] and hyperinsulinemia [8]. Another polymorphism (N363S, rs6195) was identified in codon 363 of exon 2 of the GR gene. This AAT to AGT nucleotide change in the codon 363 results in an asparagine to serine amino acid change and this amino acid replacement may change the interactions of the receptor with transcription cofactors [10, 11]. This AGT codon was found to be associ-ated with a higher sensitivity to GCs in vivo [10], obesity and overweight [12], but no association with hypertension and type 2 diabetes has been shown yet [12]. However, N363S polymorphism has not been found in Japanese and Chinese populations [13–15]. ER22/23EK polymorphism (rs6189 + rs6190), which consists of single nucleotide substitutions in codon 22 and 23 [GAGAGG (GluArg, or ER) → GAAAAG (Glu-Lys, or EK)], is known to be associated with relative glucocorticoid resistance [4]. This polymorphism was associated with better survival, as well as lower C-reactive protein levels [16]. Another polymor-phism, described as a TthIII1 restriction fragment length polymorphism (rs10052957) in 5′ untranslated region of GR gene, was found to be associated with changes in basal cortisol secretion in men [17]. However, TthIII1 polymor-phism might be functionally relevant only in combination with ER22/23EK [18].
The objective of our study is to evaluate the effects of glucocorticoid receptor (GR) gene polymorphisms (BclI, N363S, TthIII1 ve ER22/23EK) in Turkish patients with MetS.
Materials and methods Study samples
Seventy subjects with MetS using the National Cholesterol Education Program (ATPIII) diagnosis criteria [2] and 185 healthy controls were enrolled in the study. Three or more of the following criteria had to be met: abdominal obesity (men >102 cm, women >88 cm), high triglyceride levels (≥150 ml/dl), low HDL level (men <40 mg/dl, women <50 mg/dl), elevated blood pressure (systolic >130 mmHg, diastolic >85 mmHg), and high fasting glucose (>110 mg/
dl). BMI, body fat percent, total cholesterol, HDL choles-terol, LDL cholescholes-terol, triglycerides, fasting and postpran-dial glucose as well as hormone levels (cortisol, suppressed cortisol, dehydroepiandrosterone (DHEA), insulin, C-reac-tive protein (CRP), C-peptide) were determined. The study was approved by Marmara University School of Medicine Ethics Committee (MAR-YÇ-2007-0261).
Measurement of risk factors
Body weight, height and waist-to-hip ratio of the subjects were measured. Body mass index (BMI) and body fat content were calculated by a TANITA body fat analyzer (Tanita Corporation, Tokyo, Japan). Blood samples were collected after 12 h fasting. Serum lipid levels were ana-lyzed using standard procedures. LDL-C was calculated using the Friedewald formula, LDL-C = total choles-terol − (HDL-C + 0.2 × triglyceride). Serum insulin was determined by ELISA using commercial kits (Monobind Inc, Lake Forest, CA, USA) with an automated EIA ana-lyzer (Bio-Rad Laboratories, Hercules, CA, USA). The standard low dose overnight dexamethasone suppression test was employed as described previously. Briefly, 1 mg of dexamethasone was administered at 23:00 h. Blood samples were taken at 08:00 h the next morning and then serum cortisol levels were measured by radioimmunoassay (Amersham Pharmacia Biotech, TFB Co., Tokyo, Japan).
Genotyping
Genomic DNA was isolated from peripheral blood samples of all subjects using standard techniques (phenol–chloro-form technique) [19]. DNA samples were investigated for GR gene polymorphisms using polymerase chain reaction (PCR)-based restriction fragment length polymorphism (RFLP) analysis.
PCR amplification of the GR gene regions was carried out using primer sequences as previously described [20,
21]. For BclI, the forward primer was 5′-TGC TGC CTT ATT TGT AAA TTC GT-3′, and the reverse primer was 5′-AAG CTT AAC AAT TTT GGC CAT C-3′. PCR prod-ucts (335 bp) were digested at 55 °C for 3 h with 10 U of BclI restriction enzyme (Fermentas, Lithuania). For N363S, the forward primer was 5′-AGT ACC TCT GGA GGA CAG AT-3′, and the reverse primer was 5′-GTC CAT TCT TAA GAA ACA GG-3′. PCR products were digested at 65 °C for 3 h with 10 U of TasI (TspEI) restric-tion enzyme (Fermentas, Lithuania). For ER22/23EK, the forward primer was 5′-GAT TCG GAG TTA ACT AAA AG-3´, and the reverse primer was 5′-ATC CCA GGT CAT TTC CCA TC-3´. PCR products were digested at 37 °C for 6 h with 10 U of MnlI restriction enzyme (Fermentas, Lith-uania). For TthIII1, the forward primer was 5′-TCC AGG
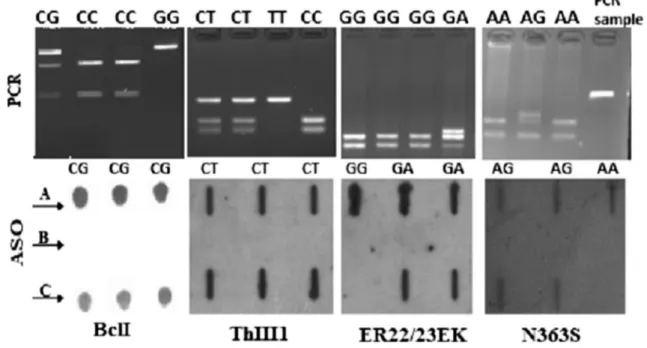
AGT GGG ACA TAA AGC T-3´, and the reverse primer was 5′-CTT AGA AGC AGA GGT GGA AAT GAA G-3´. PCR products were digested at 37 °C for 16 h (overnight) with 10 U of TthIII1 (PsyI) restriction enzyme (Fermentas, Lithuania; Fig. 1).
Results for each polymorphism have been verified by allele-specific oligonucleotide (ASO) analysis. In this method, first 3′-end of wild-type and mutant-type probes was marked with digoxigenin using DIG Oligonucleo-tide 3′-End Labeling Kit, 2nd Generation (Roche, Ger-many). Labeling was performed in a 20 µl reaction mix-ture containing 100 pmol oligonucleotide, 1× reaction buffer, 5 mM CoCl2, 0.05 mM DIG-ddUTP and 20 U/µl terminal transferase, and incubated at 37 °C for 15 min. After incubation, 2 µl 0.2 M EDTA (pH 8.0) was added to stop the reaction. Five microliters of PCR products were mixed with 195 µl reaction mixture containing 10 µl 200 mM EDTA, 80 µl NaOH and 105 µl distilled water (dH2O), and denaturated at 99 °C for 10 min. After
denaturation, the mixed solution was immediately cooled on ice. After rinsing in dH2O for 10 min the membrane, aliquots (200 µl) were then applied onto a membrane to create 24-slot blots in a hybrid slot-blot apparatus (Biom-etra, Germany). The membrane was dried overnight at 70–75 °C in oven. Later, DIG Easy Hyb Granules, DIG
Wash and Block Buffer Set Kits were used for Hybridi-zation. After the membrane was immersed in 0.2× SSC for 2 min, blots were prehybridized at 54 °C for 45 min (hybridization oven, Model HB-1 Hybrideser-Techne, UK) in hybridization buffer (5× SSC with 0.2 % SDS). Hybridization with the ASO probe was carried out for 4 h. The membrane was the washed two times with 0.2× SSC containing 0.2 % SDS at 42 °C for 10 min. Finally, vis-ualization was done by DIG Luminescent Detection Kit (Fig. 1).
Statistical analysis
Statistical analysis was performed using SPSS 16.0 and GraphPad-Prism5. Chi square analyses, followed by Fish-er’s exact test wherever required, were used to compare the frequencies of GR gene polymorphisms between patients and healthy controls. The test was also applied for identi-fying the deviations from the Hardy–Weinberg proportion. Independent samples t test, unpaired t test, Mann–Whitney
U test and Kruskal–Wallis test were used to compare clini-cal parameters and GR gene polymorphisms. Odds ratios with 95 % confidence intervals were given wherever appro-priate. All tests were two-tailed, and results were consid-ered significant when p value was <0.05.
Fig. 1 Genotyping of GR gene polymorphisms. Top row RFLP, bot-tom row schematic of dot blot for polymorphisms using wild-type allele ASO prob. Bcl I-top row: lane 1 indicates the CG genotype (335, 221 and 117 bp), lanes 2 and 3 indicate the CC genotype (221 and 117 bp), lane 4 indicates the GG genotype (335 bp). TthIII1 top row: lanes 1 and 2 indicate the CT genotype (96, 53 and 43 bp), lane 3 indicates the TT genotype (96 bp), lane 4 indicates the CC geno-type (53 and 43 bp). ER22/23EK top row: lane 1 indicates the GG
genotype (162 and 143 bp), lane 4 indicates the GA genotype (178, 162 and 143 bp). N363S top row: lanes 1 and 3 indicate the AA geno-type (135 and 95 bp), lane 2 indicated the AG genogeno-type (154, 135 and 95 bp), lane 4 indicated N363S-PCR sample (248 bp). Bottom row: a wild type, b homozygote mutant and c heterozygote. ER22/23EK-bottom row lane 1 and N363S-ER22/23EK-bottom row lane 3 homozygote wild type, other all lanes heterozygote
Results
Comparison of clinical parameters between individuals with and without MetS
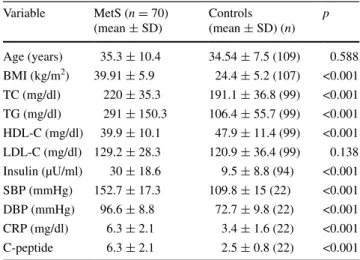
Medians for age, anthropometric parameters and biochemi-cal markers in MetS and control subjects are shown in Table 1. The age difference between the MetS and control groups was not significant. HDL-C levels of MetS group were significantly lower than the control group (p < 0.001). As expected, there was a statistically significant difference in BMI, systolic and diastolic BP, total cholesterol, triglyc-erides, insulin, CRP and C-peptide between cases and con-trols (p < 0.001).
Allele and genotype frequencies of GR polymorphisms in MetS and control
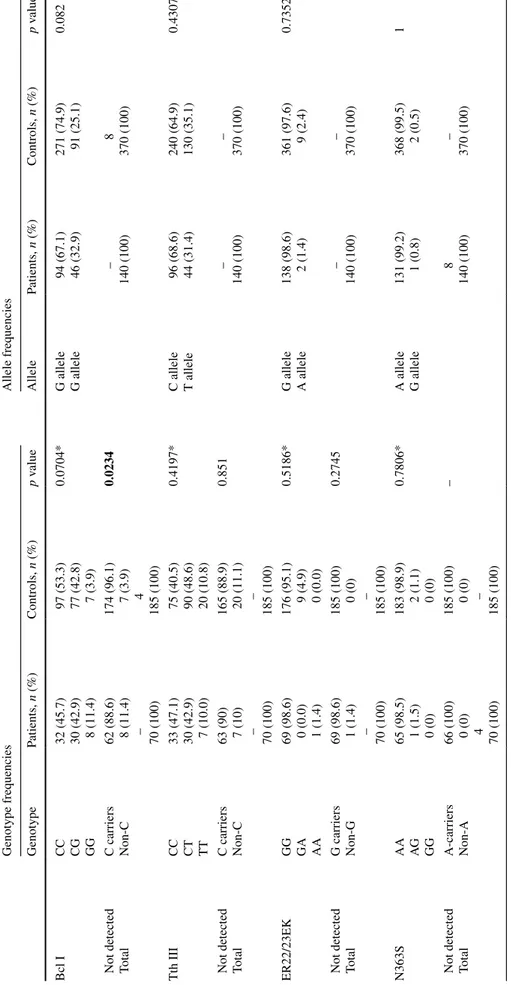
Blood samples from 70 subjects with MetS and 185 healthy people were analyzed to determine the frequency of GR gene polymorphisms. The allele frequencies in the studied patients and controls are listed in Table 2. Mutant allele frequencies in the control group were 25.1, 35.1, 2.4 and 0.5 % for the BclI, TthIII1, ER22/23EK and N363S poly-morphisms, respectively. This distribution in the patient group was 32.9, 31.4, 1.4 and 0.8 %, respectively.
The genotype distributions in the studied patients and controls are listed in Table 2. BclI polymorphism genotype in the patients was distributed as 32 (45.7 %) with wild
type, 30 (42.9 %) with heterozygote and 8 (11.4 %) with homozygote mutant, while as 97 (53.3 %), 77 (42.8 %) and 7 (3.9 %) in the controls, respectively. Furthermore, homozygote carriers of this polymorphism were signifi-cantly higher in MetS patients than controls (p = 0.0234; Table 2). These results indicate that when compared with combined CC/CG genotype, GG genotype of BclI poly-morphism was significantly associated with an increased risk of MetS.
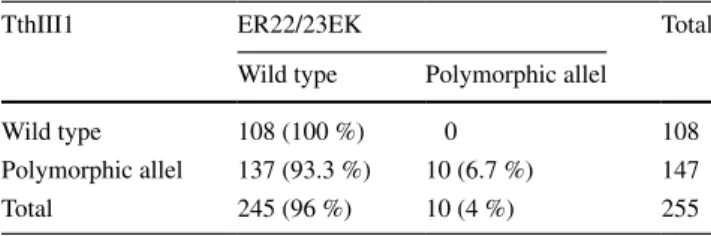
TthIII1 polymorphism genotype in the patients was dis-tributed as 33 (47.1 %) with wild type, 30 (42.9 %) with heterozygote and 7 (10.0 %) with homozygote mutant, while they were as 75 (40.5 %), 90 (48.6 %) and 20 (10.8 %) in the controls, respectively. ER22/23EK-carriers was determined as 1 (1.4 %) in the patient group and 9 (5.0 %) in the controls. N363S polymorphism genotype in the patients was distributed as 65 (98.5 %) with wild type and 1 (1.5 %) with heterozygote, while as 183 (98.9 %) and 2 (1.1 %) in controls, respectively. Moreover, all the ER22/23EK polymorphisms coexisted with polymorphic variant of TthIII1 (p = 0.0058; Table 3). The carriers of the N363S variant allele were identified in 1.5 % of the patients and in 1.1 % of the control group (Table 2). Additionally, while G allele for N363S and ER22/23EK polymorphism was rare, homozygote carriers of N363S polymorphism were not found in our population.
Individual effects of GR polymorphisms in clinical parameters of MetS patients
Both genetic polymorphisms N363S and ER22/23EK of GR gene were not individually associated with clini-cal parameters of MetS patients. On the other hand, BMI was significantly higher in heterozygous carriers (4.9 %) compared with wild-type subjects of ER22/23EK poly-morphism in the control group (p = 0.011). No significant differences in clinical parameters between BclI genotype groups were present. However, the G carriers of BclI pol-ymorphism showed a significant higher C-peptide level in comparison with CC homozygote group in women (p = 0.01; Fig. 2a), but not associated with any clinical parameter in men.
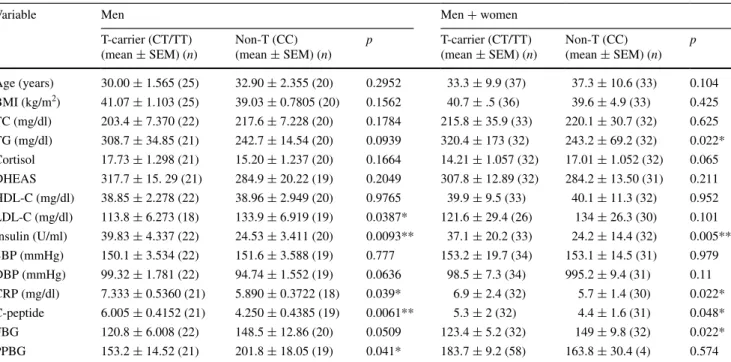
T allele carriers of TthIII1 polymorphism were signifi-cantly associated with C-peptide, triglyceride, insulin, FBG and CRP levels in all patients with MetS (Table 4). More-over, T allele carriers of this polymorphism had a higher level of insulin, CRP, C-peptide and lower level of LDL-C, PPBG than non-carrier group in men (Table 4), but not associated with any clinical parameters in women. Addi-tionally, insulin levels were significantly different between three genotypes (CC, CT and TT) and it was highest in TT genotype (p = 0.0183; Fig. 2b).
Table 1 Comparison of clinical parameters between individuals with and without MetS
Significant level = p < 0.05 by independent samples t test (two-tailed)
BMI body mass index, HDL-C high-density lipoprotein cholesterol, LDL-C low-density lipoprotein cholesterol, TC total cholesterol, TG triglycerides, SBP systolic blood pressure, DBP diastolic blood pres-sure Variable MetS (n = 70) (mean ± SD) Controls (mean ± SD) (n) p Age (years) 35.3 ± 10.4 34.54 ± 7.5 (109) 0.588 BMI (kg/m2) 39.91 ± 5.9 24.4 ± 5.2 (107) <0.001 TC (mg/dl) 220 ± 35.3 191.1 ± 36.8 (99) <0.001 TG (mg/dl) 291 ± 150.3 106.4 ± 55.7 (99) <0.001 HDL-C (mg/dl) 39.9 ± 10.1 47.9 ± 11.4 (99) <0.001 LDL-C (mg/dl) 129.2 ± 28.3 120.9 ± 36.4 (99) 0.138 Insulin (µU/ml) 30 ± 18.6 9.5 ± 8.8 (94) <0.001 SBP (mmHg) 152.7 ± 17.3 109.8 ± 15 (22) <0.001 DBP (mmHg) 96.6 ± 8.8 72.7 ± 9.8 (22) <0.001 CRP (mg/dl) 6.3 ± 2.1 3.4 ± 1.6 (22) <0.001 C-peptide 6.3 ± 2.1 2.5 ± 0.8 (22) <0.001
Table
2
Genotype and allele frequencies of GR polymorphisms in MetS and control subjects
Significant le
vel
=
P
<
0.05 (bold) by Fisher Exact test (column v
alue <5), Chi square test (column v
alue >5)
*
Chi square test for trend (three ro
ws) Genotype frequencies Allele frequencies Genotype Patients, n (%) Controls, n (%) p v alue Allele Patients, n (%) Controls, n (%) p v alue Bcl I CC CG GG 32 (45.7) 30 (42.9) 8 (11.4) 97 (53.3) 77 (42.8) 7 (3.9) 0.0704* G allele G allele 94 (67.1) 46 (32.9) 271 (74.9) 91 (25.1) 0.082
Not detected Total C carriers Non-C 62 (88.6) 8 (11.4) – 70 (100) 174 (96.1) 7 (3.9) 4 185 (100) 0.0234 – 140 (100) 8 370 (100) Tth III CC CT TT 33 (47.1) 30 (42.9) 7 (10.0) 75 (40.5) 90 (48.6) 20 (10.8) 0.4197* C allele T allele 96 (68.6) 44 (31.4) 240 (64.9) 130 (35.1) 0.4307
Not detected Total C carriers Non-C 63 (90) 7 (10) – 70 (100) 165 (88.9) 20 (11.1) – 185 (100) 0.851 – 140 (100) – 370 (100) ER22/23EK GG GA AA 69 (98.6) 0 (0.0) 1 (1.4) 176 (95.1) 9 (4.9) 0 (0.0) 0.5186* G allele A allele 138 (98.6) 2 (1.4) 361 (97.6) 9 (2.4) 0.7352
Not detected Total G carriers Non-G 69 (98.6) 1 (1.4) – 70 (100) 185 (100) 0 (0) – 185 (100) 0.2745 – 140 (100) – 370 (100) N363S AA AG GG 65 (98.5) 1 (1.5) 0 (0) 183 (98.9) 2 (1.1) 0 (0) 0.7806* A allele G allele 131 (99.2) 1 (0.8) 368 (99.5) 2 (0.5) 1
Not detected Total A-carriers Non-A 66 (100) 0 (0) 4 70 (100) 185 (100) 0 (0) – 185 (100) – 8 140 (100) – 370 (100)
Genotype combinations of GR gene polymorphisms in MetS patients and controls
The genotype combinations of four GR gene polymor-phisms were analyzed in each individual (Table 5). The five most prevalent genotypic combinations were pre-sented separately and the remaining rare combinations were pooled together. The CG+GG–CC–GG–AA geno-type (BclI, TthIII1, ER22/23EK and N363S, respectively;
Table 3 Association between ER22/23EK and TthIII1 polymor-phism (p = 0.0058)
Significant level = p < 0.05 by Fisher Exact test
TthIII1 ER22/23EK Total
Wild type Polymorphic allel
Wild type 108 (100 %) 0 108
Polymorphic allel 137 (93.3 %) 10 (6.7 %) 147
Total 245 (96 %) 10 (4 %) 255
Fig. 2 Comparison of clinic parameters with GR gene polymorphisms. Diastolic BP diastolic blood pressure, FBG fasting blood glucose, PPBG postprandial blood glucose
mutant allele carriers for BclI and non-mutant allele carri-ers for other three polymorphisms) combination was found to be significantly higher than controls [OR 3.18, 95 % CI (1.56–6.46), p = 0.001].
Combined effects of GR polymorphisms in clinical parameters of MetS patients
To evaluate the combined effect of BclI and TthIII1 poly-morphisms on clinical parameters, we divided our study population into two groups: a group of non-carriers of both
polymorphisms (CC+CC) and a group of carriers of both polymorphisms (CG/GG+CT/TT). DBP of the CG/GG+CT/ TT group was significantly higher than the other groups in all patients with MetS (p = 0.033; Fig. 2c). In addition, the CG/ GG+CT/TT group had a lower level of FBG and PPBG than the other groups in men (p = 0.0161 and p = 0.0448, respec-tively; Fig. 2d, e), but differences in the clinical parameters were not statistically significant in women (p = 0.7715 and
p = 0.8857, respectively). We did not find any other combina-tional effects of GR polymorphisms associated with clinical parameters in our MetS patients.
Table 4 Comparison of clinical parameters with TthIII1 genotypes according to T-carriers vs. non-T carriers
Significant level = p < 0.05 by unpaired t test (two-tailed)
BMI body mass index, HDL-C high-density lipoprotein cholesterol, LDL-C low-density lipoprotein cholesterol, TC total cholesterol, TG triglyc-erides, SBP systolic blood pressure, DBP diastolic blood pressure, FBG fasting blood glucose, PPBG postprandial blood glucose
* p < 0.05 ** p < 0.01
Variable Men Men + women
T-carrier (CT/TT) (mean ± SEM) (n) Non-T (CC) (mean ± SEM) (n) p T-carrier (CT/TT) (mean ± SEM) (n) Non-T (CC) (mean ± SEM) (n) p Age (years) 30.00 ± 1.565 (25) 32.90 ± 2.355 (20) 0.2952 33.3 ± 9.9 (37) 37.3 ± 10.6 (33) 0.104 BMI (kg/m2) 41.07 ± 1.103 (25) 39.03 ± 0.7805 (20) 0.1562 40.7 ± .5 (36) 39.6 ± 4.9 (33) 0.425 TC (mg/dl) 203.4 ± 7.370 (22) 217.6 ± 7.228 (20) 0.1784 215.8 ± 35.9 (33) 220.1 ± 30.7 (32) 0.625 TG (mg/dl) 308.7 ± 34.85 (21) 242.7 ± 14.54 (20) 0.0939 320.4 ± 173 (32) 243.2 ± 69.2 (32) 0.022* Cortisol 17.73 ± 1.298 (21) 15.20 ± 1.237 (20) 0.1664 14.21 ± 1.057 (32) 17.01 ± 1.052 (32) 0.065 DHEAS 317.7 ± 15. 29 (21) 284.9 ± 20.22 (19) 0.2049 307.8 ± 12.89 (32) 284.2 ± 13.50 (31) 0.211 HDL-C (mg/dl) 38.85 ± 2.278 (22) 38.96 ± 2.949 (20) 0.9765 39.9 ± 9.5 (33) 40.1 ± 11.3 (32) 0.952 LDL-C (mg/dl) 113.8 ± 6.273 (18) 133.9 ± 6.919 (19) 0.0387* 121.6 ± 29.4 (26) 134 ± 26.3 (30) 0.101 Insulin (U/ml) 39.83 ± 4.337 (22) 24.53 ± 3.411 (20) 0.0093** 37.1 ± 20.2 (33) 24.2 ± 14.4 (32) 0.005** SBP (mmHg) 150.1 ± 3.534 (22) 151.6 ± 3.588 (19) 0.777 153.2 ± 19.7 (34) 153.1 ± 14.5 (31) 0.979 DBP (mmHg) 99.32 ± 1.781 (22) 94.74 ± 1.552 (19) 0.0636 98.5 ± 7.3 (34) 995.2 ± 9.4 (31) 0.11 CRP (mg/dl) 7.333 ± 0.5360 (21) 5.890 ± 0.3722 (18) 0.039* 6.9 ± 2.4 (32) 5.7 ± 1.4 (30) 0.022* C-peptide 6.005 ± 0.4152 (21) 4.250 ± 0.4385 (19) 0.0061** 5.3 ± 2 (32) 4.4 ± 1.6 (31) 0.048* FBG 120.8 ± 6.008 (22) 148.5 ± 12.86 (20) 0.0509 123.4 ± 5.2 (32) 149 ± 9.8 (32) 0.022* PPBG 153.2 ± 14.52 (21) 201.8 ± 18.05 (19) 0.041* 183.7 ± 9.2 (58) 163.8 ± 30.4 (4) 0.574
Table 5 The frequency of genotypic combinations of polymorphisms in patients and in healthy controls
Significant level = p < 0.05 by Fisher Exact test (column value <5), Chi square test (column value >5) CG+GG CG and GG carriers of BclI polymorphism, CT+TT CT and TT carriers of TthIII1 polymor-phism, Rc remaining combinations
* p < 0.005
BclI TthIII1 N363S ER22/23EK MetS (%) Controls (%) OR; 95 % CI p
CC GG AA GG 4 (6) 16 (9) 0.6; 0.20–1.94 0.604 CC CC AA GG 11 (16) 18 (10) 1.7; 0.75–3.79 0.199 CG+GG CC AA GG 19 (27) 19 (11) 3.2; 1.56–6.46 0.001* CC CT+TT AA GG 20 (29) 36 (20) 1.6; 0.85–3.03 0.138 CG+GG CT+TT AA GG 16 (23) 32 (18) 1.38; 0.70–2.71 0.349 Rc 0 60 (32) Total 70 181
Discussion
MetS initiating molecular mechanisms are still not fully understood. GCs may influence process leading to meta-bolic disorders and the action of it at the cellular level is mediated by the GR [22, 23]. Most of the previous stud-ies have focused on the relationship between GR polymor-phisms and MetS in most of the populations except Turkish population. Therefore, the present study focused on four GR gene polymorphisms that were associated with meta-bolic syndrome in Turkish population. We found no sig-nificant differences in the frequencies of the three genetic polymorphisms (N363S, ER22/23EK and TthIII1) between the controls and the patient group. The number of homozy-gote carriers for BclI polymorphism in patients with MetS was significantly higher compared to the control group (p = 0.0234). Additionally, the G allele carrier of this poly-morphism showed a significant higher C-peptide in com-parison with CC homozygote group in women (p = 0.01). We found that the T allele of TthIII1 polymorphism is asso-ciated with C-peptide, triglyceride, insulin, CRP and FBG in patients with MetS. Furthermore, all the Er22/23EK pol-ymorphisms coexisted with polymorphic variant of TthIII1 (p = 0.0058).
Although the BclI polymorphism of the GR gene has been identified in many populations [24–27], N363S and ER22/23EK polymorphisms were not found in Chinese population, Chinese Han population and Japanese popula-tion [14, 15, 25, 26, 28]. Our results suggested that A allele of ER22/23EK polymorphism and G allele of N363S poly-morphism is rare in our population and this is similar to the results of a study in a Chinese and Japanese population.
In our study, the GG homozygote group showed a sig-nificant association with increased risk of MetS in com-parison with the C-allele-carrier subjects (CC and CG) and GG genotype was considered as a risk factor for MetS (p = 0.02). This finding was consistent with the results of previous study, in which GG genotype was identified to be more frequent in patients with MetS [15]. In another study, BclI polymorphism has not been found significantly dif-ferent in genotype and allele frequencies comparing obese and normal weight women and the genotype was associ-ated with higher levels of insulin and blood glucose [8]. Our data for the BclI polymorphism in patients with MetS are slightly similar for G allele frequency compared with the data published previously by Koeijvoets et al. and the same study showed that men with the BclI haplotype were associated with cardiovascular disease [29]. However, in our study, no association between this polymorphism and clinical parameters was determined in men. Several studies have suggested that GR gene polymorphisms could have gender-specific effects on anthropometric and metabolic
variables [5, 6, 30]. Melcescu et al. [31] showed that while the BclI polymorphism was associated with higher BMI in Caucasian women, it was not associated with BMI in African Americans. There are conflicting results about this polymorphism. Some studies showed an association with high BMI, abdominal obesity, SBP and cortisol levels. In contrary, some studies report that this polymorphism is associated with low BMI and insulin resistance [7, 9]. Also it was reported that BclI polymorphism is associated with low BMI in the elderly individuals [5]. Additionally, Yan et al. [28] showed that only GG homozygotes had higher BMI and SBP and lower plasma glucose and triglycerides. In this study high C-peptide level among homozygous GG carriers than among C allele carriers was found only in women.
The frequency of TthIII1 in the study population of Rosmond et al. [9] (284 middle-aged men) and Van Ros-sum et al. [18] was: CC 49.6 %, CT 41.4 % and TT 9.0 %, CC 39.7 %, CT 44.5 % and TT 15.8 % compared to CC 47.1 %, CG 42.9 % and GG 10 % in patients with MetS in our study population. Additionally, there was no associa-tion between TthIII1 polymorphism and MetS. However, we found that T allele carriers of this polymorphism had a higher level of insulin, CRP, C-peptide and lower level of LDL-C, PPBG than non-carrier group in men, but we did not find an association between this polymorphism and any other clinical parameters. Van Rossum et al. [18] and Yan et al. [28] have suggested that TthIII1 polymorphism itself is not associated with clinical parameters, but our results show that this polymorphism itself is associated with cer-tain clinic parameters related to MetS. Another study showed that heterozygous carriers of this polymorphism in African–Americans with HIV infection had significantly higher levels of high-density lipoprotein cholesterol and a tendency toward lower glucose and triglyceride levels and lower visceral adipose tissue mass [32]. CRP is used as a sensitive marker of inflammation and elevated level of CRP is associated with MetS [33]. A previous study con-cerning the relationship between CRP and components of the metabolic syndrome indicated that only obesity was significantly associated with higher CRP levels [34]. Our study demonstrated the associations of TthIII1-T allele with higher insulin, CRP, C-peptide, and with lower lev-els of LDL-C, PPBG for the first time in MetS. We sug-gest that TthIII1 polymorphism may play a protective role in high cholesterol and blood glucose levels, but it could be a potential risk factor for insulin, CRP and C-peptide.
Taken together both control and patient subjects, we found that ER22/23EK polymorphism coexisted with TthIII1 polymorphism, but there was no carrier of TthIII1 C allele (p = 0.0058). Our data supports that ER22/23EK polymorphic allele have arisen de novo on the highly
frequently occurring TthIII1 T allele as indicated in a previ-ous study [18].
In different studies concerning about TthIII1 and ER22/23EK polymorphisms, while ER22/23EK poly-morphism was associated with the better metabolic health profile, TthIII1 polymorphism has not been found to be associated with any metabolic parameters [4, 5]. Van Ros-sum et al. [35] showed that lean body mass was signifi-cantly higher in male heterozygous carriers (8 %) of the ER22/23EK variant. Our study demonstrated that A allele of ER22/23EK polymorphism is rare in our population and BMI is significantly higher in heterozygous carriers (4.9 %) as compared with wild-type subjects of this polymorphism in the control group (p = 0.011).
We did not find any interaction between TthIII1 T and BclI G allele frequencies in MetS. However, we showed that carriers of both alleles of these polymorphisms had a lower FBG and PPBG in men with MetS. Therefore, our study suggests that the combination of the polymorphisms may play a protective role in blood glucose.
In the present study, we did not find an association of the ER22/23EK and the N363S polymorphisms with MetS. A possible explanation for the lack of an association between these two polymorphisms and MetS could be their low fre-quency. Therefore, association with clinical parameters of N363S was ruled out in our study group, as both controls and patients were approximately 99 % homozygous wild type for N363S. The N363S data of our study are similar to those reported in populations of Japanese, Chinese, Cauca-sian and African American [13, 14, 31].
In conclusion, we describe here that the N363S, ER22/23EK and TthIII1 polymorphisms may not be con-sidered as genetic risk factors for MetS in Turkish popu-lation. However, the BclI polymorphism might be good predictive markers for MetS in Turkish individuals. We conclude that the BclI and the TthIII1 polymorphisms are associated with clinical parameters in a sex-specific man-ner. Our findings also suggest that TthIII1 polymorphism and the combination of BclI and TthIII1 polymorphisms may protect from high blood glucose levels. In clinical practice, the GR polymorphism screening during MetS treatment could help to identify the subgroup of patients who are at risk for developing a higher level of insulin, CRP, C-peptide and lower level of LDL-C, PPBG; these patients would benefit most from personalized treatment. Furthermore, the study provides a lead for future investiga-tion for the effects of GR polymorphisms on MetS in this population.
Acknowledgments The authors appreciate Dr. Can Erzik for his critical revision of the manuscript. This work was partly supported by a grant (104S272, SBAG-K-60 to SÇ) from the Scientific and Technological Research Council of Turkey (TUBITAK) and grants
(SAG-C-DRP-101011-0286 to AO) from the Research Foundation of Marmara University (BAPKO).
Compliance with ethical standards
Conflict of interest The authors declare that there are no conflicts of interest.
Ethical approval All the research has been performed according to the Ethical Standards involving human participants.
Informed consent Informed consent was obtained from all individ-ual participants included in the study.
References
1. Alberti KG, Zimmet PZ (1998) Definition, diagnosis and classi-fication of diabetes mellitus and its complications. Part 1: diag-nosis and classification of diabetes mellitus provisional report of a WHO consultation. Diabet Med 15(7):539–553
2. Grundy SM, Brewer Jr HB, Cleeman JI, Smith Jr SC, Lenfant C; National Heart, Lung, and Blood Institute; American Heart Association (2004) Definition of metabolic syndrome: report of the National Heart, Lung, and Blood Institute/American Heart Association conference on scientific issues related to definition. Arterioscler Thromb Vasc Biol 24(2):e13–e18
3. Rosmond R (2002) The glucocorticoid receptor gene and its association to metabolic syndrome. Obes Res 10:1078–1086 4. van Rossum EF, Koper JW, Huizenga NA, Uitterlinden AG,
Janssen JA, Brinkmann AO, Grobbee DE, de Jong FH, van Duyn CM, Pols HA, Lamberts SW (2002) A polymorphism in the glu-cocorticoid receptor gene, which decreases sensitivity to gluco-corticoids in vivo, is associated with low insulin and cholesterol levels. Diabetes 51:3128–3134
5. van Rossum EF, Koper JW, van den Beld AW, Uitterlinden AG, Arp P, Ester W, Janssen JA, Brinkmann AO, de Jong FH, Grob-bee DE, Pols HA, Lamberts SW (2003) Identification of the BclI polymorphism in the glucocorticoid receptor gene: association with sensitivity to glucocorticoids in vivo, and body mass index. Clin Endocrinol (Oxf) 59(5):585–592
6. Manenschijn L, van den Akker EL, Lamberts SW, van Ros-sum EF (2009) Clinical features associated with glucocorti-coid receptor polymorphisms. An overview. Ann N Y Acad Sci 1179:179–198
7. Buemann B, Vohl MC, Chagnon M, Chagnon YC, Gagnon J, Pérusse L, Dionne F, Després JP, Tremblay A, Nadeau A, Bouchard C (1997) Abdominal visceral fat is associated with a BclI restriction fragment length polymorphism at the glucocorti-coid receptor gene locus. Obes Res 5:186–192
8. Weaver JU, Hitman GA, Kopelman PG (1992) An association between a Bc1I restriction fragment length polymorphism of the glucocorticoid receptor locus and hyper insulinaemia in obese women. J Mol Endocrinol 9:295–300
9. Rosmond R, Chagnon YC, Holm G, Chagnon M, Pérusse L, Lindell K, Carlsson B, Bouchard C, Björntorp P (2000) A glu-cocorticoid receptor gene marker is associated with abdominal obesity, leptin, and dysregulation of the hypothalamic–pituitary– adrenal axis. Obes Res 8:211–218
10. Huizenga NA, Koper JW, De Lange P, Pols HA, Stolk RP, Burger H, Grobbee DE, Brinkmann AO, De Jong FH, Lamberts SW (1998) A polymorphism in the glucocorticoid receptor gene may be associated with and increased sensitivity to glucocorti-coids in vivo. J Clin Endocrinol Metab 83:144–151
11. Feng J, Zheng J, Bennett WP, Heston LL, Jones IR, Craddock N, Sommer SS (2000) Five missense variants in the amino-terminal domain of the glucocorticoid receptor: no association with puer-peral psychosis or schizophrenia. Am J Med Genet 96:412–417 12. Lin RC, Wang XL, Dalziel B, Caterson ID, Morris BJ (2003)
Association of obesity, but not diabetes or hypertension, with glucocorticoid receptor N363S variant. Obes Res 11(6):802–808 13. Ikeda Y, Suehiro T, Tsuzura S, Shiinoki T, Kaneda T, Kumon Y,
Hashimoto K (2001) A polymorphism in the promoter region of the glucocorticoid receptor gene is associated with its transcrip-tional activity. Endocr J 48:723–726
14. Lei SF, Deng FY, Liu XH, Huang QR, Qin Y, Zhou Q, Jiang DK, Li YM, Mo XY, Liu MY, Chen XD, Wu XS, Shen H, Dvornyk V, Zhao L, Recker RR, Deng HW (2003) Polymorphisms of four bone mineral density candidate genes in Chinese populations and comparison with other populations of different ethnicity. J Bone Miner Metab 21:34–42
15. Yan YX, Dong J, Zhang J, Liu F, Wang W, Zhang L, He Y (2014) Polymorphisms in NR3C1 gene associated with risk of metabolic syndrome in a Chinese population. Endocrine 47(3):740–748 16. van Rossum EF, Feelders RA, van den Beld AW, Uitterlinden
AG, Janssen JA, Ester W, Brinkmann AO, Grobbee DE, de Jong FH, Pols HA, Koper JW, Lamberts SW (2004) Association of the ER22/23EK polymorphism in the glucocorticoid receptor gene with survival and C-reactive protein levels in elderly men. Am J Med 117:158–162
17. Rosmond R, Chagnon YC, Chagnon M, Pérusse L, Bouchard C, Björntorp P (2000) A polymorphism of the 5′-flanking region of the glucocorticoid receptor gene locus is associated with basal cortisol secretion in men. Metabolism 49(9):1197–1199
18. van Rossum EF, Roks PH, de Jong FH, Brinkmann AO, Pols HA, Koper JW, Lamberts SW (2004) Characterization of a pro-moter polymorphism in the glucocorticoid receptor gene and its relationship to three other polymorphisms. Clin Endocrinol 61(5): 573–581 (9)
19. Loparev VN, Cartas MA, Monken CE, Velpandi A, Srinivasan A (1991) An efficient and simple method of DNA extraction from whole blood and cell lines to identify infectious agents, J Virol Methods 34(1):105–112
20. Bachmann AW, Sedgley TL, Jackson RV, Gibson JN, Young RM, Torpy DJ (2005) Glucocorticoid receptor polymorphisms and post-traumatic stress disorder. Psychoneuroendocrinology 30(3):297–306
21. Tissing WJ, Meijerink JP, den Boer ML, Brinkhof B, van Ros-sum EF, van Wering ER, Koper JW, Sonneveld P, Pieters R (2005) Genetic variations in the glucocorticoid receptor gene are not related to glucocorticoid resistance in childhood acute lymphoblastic leukemia. Clin Cancer Res 11:6050–6056 22. Tamashiro KL, Sakai RR, Shively CA, Karatsoreos IN, Reagan
LP (2011) Chronic stress, metabolism, and metabolic syndrome. Stress. 14(5):468–474
23. Zhou J, Cidlowski JA (2005) The human glucocorticoid recep-tor: one gene, multiple proteins and diverse responses. Steroids 70(5–7):407–417
24. Moreira RP, Gomes LG, Mendonca BB, Bachega TA (2012) Impact of glucocorticoid receptor gene polymorphisms on the
metabolic profile of adult patients with the classical form of 21-hydroxylase deficiency. PLoS One 7:e44893
25. Duan ZX, Gu W, Du DY, Hu P, Jiang DP, Zhu PF, Wang ZG, Jiang JX (2009) Distributions of glucocorticoid receptor gene polymorphisms in a Chinese Han population and associations with outcome after major trauma. Injury 40(5):479–483
26. Koyano S, Saito Y, Sai K, Kurose K, Ozawa S, Nakajima T, Mat-sumoto K, Saito H, Shirao K, Yoshida T, Minami H, Ohtsu A, Saijo N, Sawada J (2005) Novel genetic polymorphisms in the NR3C1 gene in a Japanese population. Drug Metab Pharmacoki-net 20:79–84
27. Bray PJ, Cotton RG (2003) Variations of the human glucocorti-coid receptor gene (NR3C1): pathological and in vitro mutations and polymorphisms. Hum Mutat 21:557–568
28. Yan YX, Dong J, Wu LJ, Shao S, Zhang J, Zhang L, Wang W, He Y, Liu YQ (2013) Associations between polymorphisms in the glucocorticoid-receptor gene and cardiovascular risk factors in a Chinese population. J Epidemiol 23(5):389–395
29. Koeijvoets KC, van der Net JB, van Rossum EF, Steyerberg EW, Defesche JC, Kastelein JJ, Lamberts SW, Sijbrands EJ (2008) Two common haplotypes of the glucocorticoid receptor gene are associated with increased susceptibility to cardiovas-cular disease in men with familial hypercholesterolemia. J Clin Endocrinol Metab 93(12):4902–4908
30. Kumsta R, Entringer S, Koper JW, van Rossum EF, Hellhammer DH, Wüst S (2007) Sex specific associations between common glucocorticoid receptor gene variants and hypothalamus–pitui-tary–adrenal axis responses to psychosocial stress. Biol Psychia-try 62(8):863–869
31. Melcescu E, Griswold M, Xiang L, Belk S, Montgomery D, Bray M, Del Ben KS, Uwaifo GI, Marshall GD, Koch CA (2012) Prevalence and cardiometabolic associations of the glucocorti-coid receptor gene polymorphisms N363S and BclI in obese and non-obese black and white Mississippians. Hormones (Athens) 11(2):166–177
32. Manenschijn L, Scherzer R, Koper JW, Danoff A, van Rossum EF, Grunfeld C (2014) Association of glucocorticoid receptor haplotypes with body composition and metabolic parameters in HIV-infected patients from the FRAM study. Pharmacogenet Genomics 24(3):156–161
33. Mahajan A, Jaiswal A, Tabassum R, Podder A, Ghosh S, Madhu SV, Mathur SK, Tandon N, Bharadwaj D (2012) Elevated levels of C-reactive protein as a risk factor for metabolic syndrome in Indians. Atherosclerosis 220:275–281
34. Lee K, Song YM, Sung J (2013) Genetic and environmental associations between C-reactive protein and components of the metabolic syndrome. Metab Syndr Relat Disord 11(2):136–142 35. Van Rossum EF, Voorhoeve PG, te Velde SJ, Koper JW,
Dele-marre-van de Waal HA, Kemper HC, Lamberts SW (2004) The ER22/23EK polymorphism in the glucocorticoid recep-tor gene is associated with a beneficial body composition and muscle strength in young adults. J Clin Endocrinol Metab 89(8):4004–4009