BIOLOGICAL APPLICATIONS OF
NANOPARTICLES PRODUCED BY LASER
ABLATION METHOD
a dissertation submitted to
the graduate school of engineering and science
of bilkent university
in partial fulfillment of the requirements for
the degree of
doctor of philosophy
in
materials science and nanotechnology
By
Canan Kur¸sung¨
oz
Biological Applications of Nanoparticles Produced by Laser Ablation Method
By Canan Kur¸sung¨oz February 2017
We certify that we have read this dissertation and that in our opinion it is fully adequate, in scope and in quality, as a dissertation for the degree of Doctor of Philosophy.
B¨ulend Orta¸c(Advisor)
Mehmet Yıldırım Sara
Urartu ¨Ozg¨ur S¸afak S¸eker
S¸aban Remzi Erdem
Emine Yegan Erdem Approved for the Graduate School of Engineering and Science:
Ezhan Kara¸san
ABSTRACT
BIOLOGICAL APPLICATIONS OF NANOPARTICLES
PRODUCED BY LASER ABLATION METHOD
Canan Kur¸sung¨oz
Ph.D. in Materials Science and Nanotechnology Advisor: B¨ulend Orta¸c
February 2017
Pulsed laser ablation in liquid (PLAL) is a promising top-down approach for nanoparticle production and it allows production of wide variety of nanoparticles such as metal, metal oxide, nitride and semiconductor nanocrystals. PLAL has numerous advantages compared to other nanoparticle production methods such as successful production of colloidal, pure and contamination-free nanoparticles. Pulsed laser ablation method was used for the production of a number of different nanoparticles both in liquids and gas environments. Moreover, both powder and bulk starting materials were employed for nanoparticle production. In the context of nanoparticle production and characterization, a systematic study for indium nitride nanocrystal (InN-NC) production was completed. The road-map for the production of ultra-smal hexagonall InN-NCs (<5 nm in diameter) was demonstrated to be produced from InN powder target in ethanol by using PLAL technique.
A real time nanoparticle exposure setup was designed and developed to reveal the health risks of laser material processing in the industry. In our study, adolescent rats were exposed to copper, tin and aluminum nanoparticles (CuNP, SnNP and AlNP, respectively) in the real-time exposure setup. We aimed to demonstrate the distribution of nanoparticles in the body by exposing the rats to the laser material processing environment. For this purpose, we defined the amount and characteristics of nanoparticles released during material process-ing by laser ablation. We also showed the effect of nanoparticles on learnprocess-ing- learning-memory and mood of rats exposed to those nanoparticles via behavioral tests, electrophysiological and molecular methods. ICP-MS and TEM analysis revealed the presence of nanoparticles in almost all organs, including different regions of brain, indicating nanoparticles gained access to systemic circulation by inhalation. Both behavioral tests and in vivo electrophysiology experiments revealed that 3 months of CuNP, SnNP and AlNP exposure did not lead to any alterations in the learning and memory process of the rats. In hippocampi collected from rats
iv
exposed to SnNP and AlNP, the expression levels of NMDA receptor subunits, namely NMDAR1 and NMDAR2a, were found to be increased, and the protein levels of NMDAR1 decreased upon CuNP exposure.
On the other hand, the toxicity of nanoparticles produced by pulsed laser ablation method in liquids was investigated for silver nanoaparticles (AgNPs) in hippocampal slices and CuNP, SnNP and AlNP nanoparticles in SH-SY5Y cell line in in vitro conditions. The cellular uptake mechanism of pure AgNPs was demonstrated as phagocytosis. Furthermore, AgNP led to dose-dependent toxicity in hippocampal slices. laser ablation is a considerably useful method for studying nanoparticle toxicity since it provides pure nanoparticles mimicking the ones encountered in the industry. Finally, it was shown that CuNP, SnNP and AlNP led to a dose-dependent cytotoxicity in SH-SY5Y cells. Moreover, it was shown that NMDAR subunits NMDAR1 and NMDAR2a mRNA expres-sions and NMDAR1 protein levels were altered after CuNP, SnNP and AlNP administration.
This study showed, for the first time in the literature, that the nanoparticles produced during the laser material processing in the atmospheric environment are taken into the body via inhalation. These nanoparticles are distributed to a number of organs including lung, heart, liver, kidney, testis and so on. More-over, these nanoparticles were detected in different brain regions, which indicates the severity of the risk for the people working in these industrial fields. We did not observe significant alterations in behavioral and electrophysiological evalua-tions in 3 months. However, in long-term exposures, accumulation of nanopar-ticles in brain may impose a high risk for dementias and mental disorders since these nanoparticles are made up of heavy metals which were shown to cause neurodegeneration.
Keywords: Nanoparticle Generation, Nanotoxicity, Laser Ablation in Liquid, Laser Ablation in Atmospheric Environment, Laser Material Processing.
¨
OZET
LAZER ABLASYON Y ¨
ONTEM˙IYLE ¨
URET˙ILEN
NANOPARC
¸ ACIKLARIN B˙IYOLOJ˙IK
UYGULAMALARI
Canan Kur¸sung¨oz
Malzeme Bilimi ve Nanoteknoloji, Doktora Tez Danı¸smanı: B¨ulend Orta¸c
S¸ubat 2017
Darbeli lazer ablasyonu nanopar¸cacık ¨uretimi i¸cin sık kullanılan ve metaller, metal oksitler, nitritler ve yarı iletken nano kristaller gibi bir¸cok farklı malzemenin ¨uretilmesi i¸cin uygun bir y¨ontemdir. Darbeli lazer ablasyonunun di˘ger nanopar¸cacık ¨uretim y¨ontemlerine g¨ore bir¸cok avantajı vardır. Koloidal, saf ve kontaminasyon i¸cermeyen nanopar¸cacıkların ¨uretimine olanak sa˘glaması avantajlarından birka¸cı olarak sayılabilir. Bu y¨ontem, hem sıvı hem de hava ortamında ¸cok ¸ce¸sitli nanopar¸cacıkların ¨uretilmesi i¸cin kullanılmı¸stır. Ayrıca, hem toz hem de katı hedefler nanopar¸cacık ¨uretiminde ba¸slangı¸c materyali olarak kullanılabilirler. Nanopartik¨ul ¨uretimi ve karakterizasyonu ba˘glamında, indiyum nitrit nanokristal (InN-NC) ¨uretimi i¸cin sistematik bir ¸calı¸sma tamamlandı. Yapılan ¸calı¸smada, k¨u¸c¨uk, altıgen InN-NC’lerinin (<5 nm) etanolde InN toz hedefi kullanılarak darbeli lazer ablasyonu y¨ontemi ile ¨uretildi˘gi g¨osterildi.
End¨ustride lazerle malzeme i¸slemenin sa˘glık risklerini ortaya ¸cıkarmak i¸cin ger¸cek zamanlı bir nanopar¸cacık maruziyet sistemi tasarlanmı¸s ve geli¸stirilmi¸stir. C¸ alı¸smamızda, ad¨olesan sı¸canlar ger¸cek zamanlı maruziyet sisteminde bakır, kalay ve al¨uminyum nanopar¸cacıklara (sırasıyla CuNP, SnNP ve AlNP) maruz bırakıldı. Sı¸canları lazerle malzeme i¸sleme ortamına maruz bırakarak, bu esnada ortaya ¸cıkan nanopar¸cacıkların v¨ucuttaki da˘gılımını g¨ostermeyi ama¸cladık. Bu ama¸cla, bu nanopar¸cacıkların miktarlarını ve ¨ozelliklerini belirledik. Ayrıca, bu nanopar¸cacıkların sı¸canların ¨o˘grenme-bellekleri ve ruh halleri ¨uzerindeki etkilerini davranı¸ssal testler, elektrofizyolojik ve molek¨uler y¨ontemlerle g¨osterdik. ICP-MS ve TEM analizleri inhalasyon yoluyla v¨ucuda giren nanopar¸cacıkların sistemik dola¸sıma ve farklı beyin b¨olgeleri de dahil neredeyse t¨um organlara ula¸stı˘gını ortaya koymu¸stur. Davranı¸s testleri ve in vivo elektrofizyoloji deneyleri, 3 aylık CuNP, SnNP ve AlNP maruziyetinin, sı¸canların ¨o˘grenme ve bellek s¨urecinde herhangi bir de˘gi¸sime yol a¸cmadı˘gını ortaya koymu¸stur. SnNP ve AlNP’ye
vi
maruz bırakılan sı¸canlardan alınan hipokamp¨us ¨orneklerinde, NMDA resept¨or alt birimleri olan NMDAR1 ve NMDAR2a’nın ekspresyon seviyelerinin arttı˘gı, CuNPye maruz kalan sı¸canların hipokamp¨us ¨orneklerinde ise NMDAR1’in protein seviyesinin azaldı˘gı g¨osterilmi¸stir.
¨
Ote yandan, sıvılarda darbeli lazer ablasyonu y¨ontemi ile ¨uretilen nanopar¸cacıkların toksisitesi, hippokampal dilimlerde g¨um¨u¸s nanopar¸cacıkları (AgNPs) ve in vitro ko¸sullarda SH-SY5Y h¨ucre hattında CuNP, SnNP ve AlNP nanopar¸cacıkları i¸cin ara¸stırılmı¸stır. C¸ alı¸smamızda, saf AgNP’lerin h¨ucresel alım mekanizması fagositoz olarak g¨osterilmi¸stir. Ayrıca, AgNPnin hipokampal dilimlerde doz ba˘gımlı toksisiteye yol a¸ctı˘gı belirlenmi¸stir. End¨ustride saf nanopar¸cacıklarla kar¸sıla¸sıldı˘gı i¸cin lazer ablasyonu nanopar¸cacık toksisitesini
incelemek i¸cin olduk¸ca uygun bir y¨ontemdir. CuNP, SnNP ve AlNP’nin SH-SY5Y h¨ucrelerinde doz ba˘gımlı bir sitotoksiteye yol a¸ctı˘gı g¨osterilmi¸stir. Ayrıca, NMDAR alt birimlerinin NMDAR1 ve NMDAR2a mRNA ekspresyonlarının ve NMDAR1 protein seviyelerinin CuNP, SnNP ve AlNP uygulamasından sonra de˘gi¸sti˘gi g¨osterilmi¸stir.
Bu ¸calı¸smada, literat¨urde ilk defa, atmosferik ortamdaki lazerle malzeme i¸sleme sırasında ¨uretilen nanopar¸cacıkların inhalasyon yoluyla v¨ucut i¸cine alındı˘gı g¨osterilmi¸stir. Bu nanopar¸cacıkların akci˘ger, kalp, karaci˘ger, b¨obrek, testis de dahil olmak ¨uzere bir¸cok organa ula¸stı˘gı g¨osterilmi¸stir. Ayrıca, bu nanopar¸cacıkların farklı beyin b¨olgelerinde tespit edilmesi end¨ustride lazer ile malzeme i¸sleme alanlarında ¸calı¸san ki¸silerin ne kadar b¨uy¨uk risk altında oldu˘gunu ortaya koymaktadır. U¸c aylık maruziyet sonucunda davranı¸ssal ve¨ elektrofizyolojik de˘gerlendirmede ¨onemli de˘gi¸siklikler g¨ozlenmemi¸stir. Ancak, bu nanopar¸cacıklar n¨orodejenerasyona neden oldu˘gu g¨osterilen a˘gır metallerden olu¸stu˘gu i¸cin, uzun s¨ureli maruziyetlerde, nanopar¸cacıkların beyinde birikmesi demans ve zihinsel bozukluklar i¸cin y¨uksek bir risk olu¸sturabilir.
Anahtar s¨ozc¨ukler : Nanopar¸cacık, Nanotoksisite, Sıvı Ortamda Lazer Ablasyon, Atmosferik Ortamda Lazer Ablasyon, Lazer ile Malzeme ˙I¸sleme.
Acknowledgement
The success and the existence of this PhD study depends not only on my efforts but also on the encouragement and guideness of many other people who were always with me in this long and challenging way. Firstly, I would like thank my advisor Assist. Prof. Dr. B¨ulend Orta¸c for his support, encouragement, guidance, and supervision. Also, I would like to express my gratitude to Prof. Dr. Yıldırım Sara for his contribution, useful advice and guidance throughout this thesis study. Besides, I would like to thank the rest of my thesis committee; Assist. Prof. Dr. Urartu ¨Ozg¨ur S¸afak S¸eker, Prof. Dr. S¸aban Remzi Erdem and Assist. Prof. Dr. Yegan Erdem for their insightful comments and encouragement. I would also like to acknowledge Prof. Dr. Mustafa F. Sargon due to his collaboration and support in the TEM analysis of tissues.
A number of people from Orta¸c Research Group were always with me through my long journey. I would like to thank my current labmates Elif Uzcengiz S¸im¸sek, Bartu S¸im¸sek, Yakup Midilli, U˘gur Te˘gin and Levent Ersoy for their friend-ship and support in my experiments. Moreover, I am greatful to the former lab members Elif G¨ul ¨ozkan Arsoy, Fehmiye Kele¸s Yıldız, Merve Ya˘gmur Yardımcı, Refik Tuzaklı, Ahmet S¨onmez and Orhun Kaya for their encouragement, support, and deep friendship for all these years. Apart from Orta¸c Research Group, the members of Sara Lab Sadık Ta¸skın Ta¸s, Barı¸s Alten and Metin Ye¸siltepe, we run a long way together and I am thankful for you not only being my labmates but also my supportive friends.
A number of engineers in National Nanotechnology Research Center (UNAM) helped in my thesis studies; I would like to thank to Mustafa G¨uler for his help in TEM, Dr. G¨ok¸ce C¸ elik and Seda Kutkan for their support in ICP-MS, Zeynep Erdo˘gan for her training in zeta potential measurements and Enver Kahveci for his help in XPS analyses. I would like to express my gratitude to Assist. Prof. Dr. Ebru Erbay for giving me the opportunity to use her lab facilities. Moreover, I would also like to thank Erbay group members for their friendship and support during my studies in their lab.
I would like to thank to Deniz Sezlev Bilecen and Dr. Menek¸se Ermi¸s S¸en who were always there for me with their deep friendship and encouragement in these
viii
difficult days. We started to this long journey together and we came to the end together, thank you Melike Sever and G¨ulistan Tansık for your friendship and support during these years. My deepest gratitude is for my dearest friend Dr. G¨ulhas Solmaz. Although she was far away from me, her supportive and relaxing calls meant a lot for me.
I would like to express my special thanks to Dr. Tolga Ba˘gcı for his deep love, patience, endless scientific and emotional support and friendship. Since the first day, you are the happiness on my face. I would also like to thank to ˙Inci Ba˘gcı for keeping the house always open for me and her support.
I am indebted to my parents Kadriye and H¨usn¨u and my dear sister Candan for their unconditional support, patience and love throughout my life and my education. Although we were all in different cities during this PhD study, I always felt their support and love in my heart. Thus, this thesis is dedicated to my dear family.
I would like to acknowledge UNAM for using the infrastructure, T ¨UBA-GEB˙IP and The Scientific and Technological Research Council of Turkey (T ¨UB˙ITAK) for funding this research with the project 113S223 and providing me scholarship in Doctorate Fellowship for prior research theses 2211-C.
Contents
1 Introduction 1
2 Nanoparticle Production with Pulsed Laser Ablation Method 4
2.1 Introduction . . . 4
2.1.1 Pulsed Laser Ablation Method . . . 4
2.1.2 Mechanism of Pulsed Laser Ablation Method . . . 5
2.2 Nanoparticle Production with Pulsed Laser Ablation in Liquids . 7 2.2.1 Materials and Method . . . 11
2.2.2 Results and Discussion . . . 12
2.2.3 Conclusion . . . 22
2.3 Nanoparticle Production with Pulsed Laser Ablation in Atmo-spheric Environment . . . 23
2.3.1 Introduction . . . 23
2.3.2 Materials and Method . . . 24
2.3.3 Results and Discussion . . . 28
2.3.4 Conclusion . . . 33
2.4 Conclusion . . . 35
3 Nanoparticle Exposure to Rats in Laser Material Processing En-vironment Mimicking the Real Industrial Exposure 36 3.1 Introduction . . . 36
3.1.1 Learning and Memory . . . 37
3.1.2 Blood-Brain Barrier . . . 45
3.1.3 Nanotoxicity . . . 47
CONTENTS x
3.2.1 Animals . . . 52
3.2.2 Behavioral Tests . . . 53
3.2.3 In vivo Electrophysiology . . . 58
3.2.4 RNA Isolation from Hippocampus Tissue . . . 59
3.2.5 cDNA Preparation . . . 61
3.2.6 Quantitatve Real Time Polymerase Chain Reaction (qRT-PCR) . . . 62
3.2.7 Protein Isolation from Hippocampus Tissue . . . 63
3.2.8 Determination of Protein Concentrations . . . 64
3.2.9 Sodium Dodecyl Sulfate Polyacrylamide Gel Electrophore-sis (SDS-PAGE) . . . 65
3.2.10 Western Blot . . . 66
3.2.11 Statistical Analysis . . . 66
3.3 Results and Discussion . . . 66
3.3.1 Behavioral Tests . . . 66
3.3.2 In vivo Electrophysiology . . . 71
3.3.3 RNA concentrations . . . 75
3.3.4 Protein concentrations . . . 75
3.3.5 Fold changes in the expression levels of NMDAR1 and NM-DAR2a genes and NMDAR1 protein levels . . . 76
3.4 Conclusion . . . 79
4 Localization and Body Distribution of Nanoparticles 80 4.1 Introduction . . . 80
4.2 Materials and Methods . . . 81
4.2.1 Removal of the Organs . . . 81
4.2.2 TEM Analysis of the Tissue Samples . . . 82
4.2.3 ICP-MS Analysis of the Tissue Samples . . . 83
4.3 Results and Discussion . . . 83
4.4 Conclusion . . . 90
5 Nanoparticle Toxicity 91 5.1 Introduction . . . 91
CONTENTS xi
5.2 Toxicity of Internalized Laser Generated Pure Silver Nanoparticles
to the Isolated Rat Hippocampus Cells . . . 92
5.2.1 Materials and Methods . . . 94
5.2.2 Results and Discussion . . . 97
5.2.3 Conclusion . . . 105
5.3 Copper, Tin and Aluminum Nanoparticle Nanotoxicity on Human Neuroblastoma Cell Line SH-SY5Y . . . 105
5.3.1 Materials and Methods . . . 107
5.3.2 Quantitative Real Time Polymerase Chain Reaction (qRT-PCR) . . . 110
5.3.3 Protein Isolation from SH-SY5Y Cell Line . . . 110
5.3.4 Results and Discussion . . . 112
5.4 Conclusion . . . 119
6 Conclusion 120
A Appendix A Chapter 3 155
B Appendix B Chapter 4 159
List of Figures
2.1 Nanoparticle production with pulsed laser ablation in liquid . . . 10 2.2 SEM and TEM images of InN-NCs produced in ethanol,
iso-propanol and water . . . 13 2.3 Zeta potential graph for InN-NCs produced in ethanol, isopropanol
and water . . . 14 2.4 TEM images and histogram data of InN-NCs produced with 3mJ,
4mJ and 5mJ laser energies . . . 15 2.5 SEM images of InN powder, and nanoparticles after different
ab-lation durations . . . 16 2.6 TEM images of InN-NCs at different laser ablation durations . . . 17 2.7 Absorption of InN-NCs produced at different ablation durations . 18 2.8 Absorption of InN-NCs produced at 15 min and 60 min ablation
duration before and after centrifugation . . . 19 2.9 TEM images of InN-NCs produced at 15 min and 60 min laser
ablation durations . . . 20 2.10 Histogram of InN-NCs produced at 15 min and 60 min . . . 21 2.11 XRD analysis of InN powder as the starting material and InN-NCs
after 15 min and 60 min laser ablation process . . . 22 2.12 RAMAN spectra of InN-NCs produced at 15 min and 60 min . . . 23 2.13 Nanoparticle production with pulsed laser ablation in the
atmo-spheric environment . . . 24 2.14 Marking laser system and the exposure environment . . . 25 2.15 Determination of the Nanoparticle Distribution in the Laser Cabinet 27 2.16 TEM analysis of CuNP in beaker 2 . . . 28 2.17 SEM and EDX analyses of nanoparticles in beaker 2 . . . 29
LIST OF FIGURES xiii
2.18 XPS analysis of CuNP in beaker 2 . . . 29
2.19 SEM analysis of copper plate . . . 30
2.20 AFM analysis of copper plate . . . 30
2.21 SEM analysis of tin plate . . . 31
2.22 SEM analysis of tin plate for depth . . . 31
2.23 TEM analysis of SnNP . . . 31
2.24 SEM analysis of SnNP . . . 32
2.25 XPS analysis of SnNP . . . 32
2.26 Aluminum plate and SEM analysis . . . 33
2.27 SEM analysis of aluminum plate for depth . . . 34
2.28 TEM analysis of AlNP . . . 34
2.29 XPS analysis of AlNP . . . 35
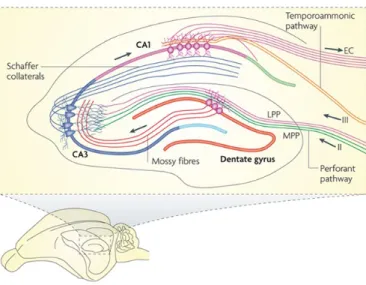
3.1 The detailed structure and the neural network of hippocampus . . 39
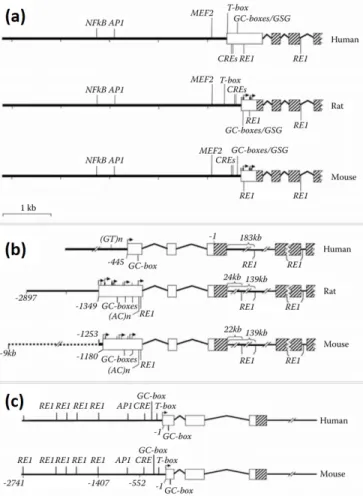
3.2 The 5’ end structures of NMDAR1, NMDAR2a and NMDAR2b genes . . . 41
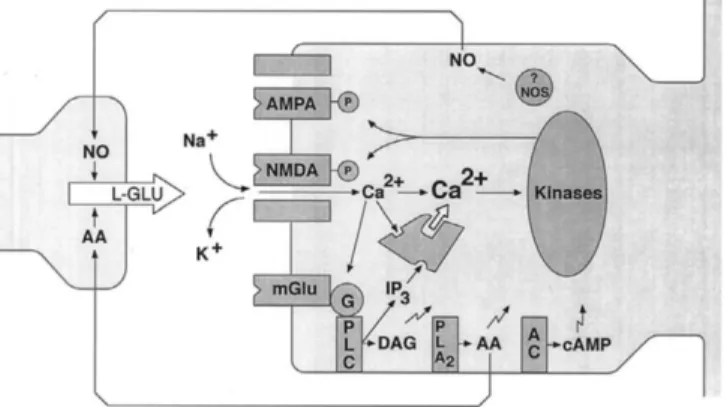
3.3 NMDAR Downstream Pathways . . . 42
3.4 LTP Induction . . . 44
3.5 NMDA Receptor Pathway in Early Phases of LTP . . . 44
3.6 EPSP and Population Spike Recordings in the Hippocampus . . . 46
3.7 Blood Brain Barrier . . . 47
3.8 Laser material processing exposure setup . . . 53
3.9 Open field test setup to evaluate the locomotor activity, explo-ration, anxiety and recognition of the spatial novelty recognition parameters of rats after exposure to CuNP, SnNP and AlNP pro-duced during laser material processing . . . 54
3.10 Elevated plus maze setup to evaluate the stress and anxiety level of the rats after exposure to CuNP, SnNP and AlNP produced during laser material processing . . . 55
3.11 Forced swim test setup to evaluate the behavioral despair related to the depression of the rats after exposure to CuNP, SnNP and AlNP produced during laser material processing . . . 56
LIST OF FIGURES xiv
3.12 Passive avoidance test setup to evaluate the learning and mem-ory process of the rats after exposure to CuNP, SnNP and AlNP produced during laser material processing . . . 57 3.13 CuNP, SnNP and AlNP produced during the laser material
pro-cessing did not alter the locomotor activity of rats exposed to these nanoparticles . . . 68 3.14 CuNP and SnNP did not lead to anxiety of rats exposed to these
nanoparticles while AlNP resulted in a decrease in anxiety behavior of the rats after exposure . . . 69 3.15 CuNP, SnNP and AlNP produced during the laser material
pro-cessing did not result in behavioral despair in the rats exposed to these nanoparticles . . . 70 3.16 CuNP, SnNP and AlNP produced during the laser material
pro-cessing did not affect the learning and memory process of the rats exposed to these nanoparticles . . . 71 3.17 CuNP, SnNP and AlNP did not affect the synaptic transmission in
CA1 region of the hippocampus of the rats after exposure to these nanoparticles . . . 72 3.18 CuNP, SnNP and AlNP did not result in any facilitation in CA1
region of hippocampus of the rats exposed to these nanoparticles . 73 3.19 CuNP, SnNP and AlNP exposure did not affect the long-term
memory process in nanoparticle exposed rats . . . 74 3.20 CuNP exposure did not lead to a statistically significant change
in NMDAR1 mRNA expression. However, both SnNP and AlNP resulted in an increase in the mRNA expression level of NMDAR1 in hippocampus of the rats after exposure to these nanoparticles . 77 3.21 SnNP and AlNP exposures resulted in a statistically significant
increase in NMDAR2a expression in hippocampus of the rats after exposure to these nanoparticles . . . 77 3.22 CuNP and SnNP resulted a decrease in NMDAR1 protein levels in
hippocampus of the rats after exposure to these nanoparticles . . 78
4.1 ICP-MS analysis of tissue samples of CuNP exposed group . . . . 85 4.2 ICP-MS analysis of tissue samples of SnNP exposed rats . . . 86
LIST OF FIGURES xv
4.3 ICP-MS analysis of tissue samples of AlNP exposed group . . . . 87
4.4 ICP-MS analysis of blood samples of all nanoparticle exposed groups 87 4.5 Potential routes of nanoparticles upon exposure . . . 88
5.1 Rat hippocampal slice incubation with pure AgNPs . . . 95
5.2 Optical properties of pure AgNPs . . . 98
5.3 Representative SEM and TEM images . . . 99
5.4 TEM images showing AgNP distribution in hippocampal slice treated with AgNPs . . . 101
5.5 MTT cell viability assay results of hippocampal cells upon expo-sure to various AgNP concentrations for one hour . . . 103
5.6 SEM images of CuNP, SnNP and AlNP produced in PBS . . . 112
5.7 TEM images of CuNP, SnNP and AlNP produced in PBS . . . . 113
5.8 Toxicity of CuNP, SnNP and AlNP to SH-SY5Y Cells . . . 114
5.9 NMDAR1 Expression change with CuNP, SnNP and AlNP admin-istration to SH-SY5Y cells . . . 116
5.10 NMDAR2a Expression change with CuNP, SnNP and AlNP ad-ministration to SH-SY5Y cells . . . 116
5.11 Change in NMDAR1 protein levels with CuNP, SnNP and AlNP administration to SH-SY5Y cells . . . 117
A.1 The weight of rats in CuNP, SnNP and AlNP group was not af-fected from the nanoparticle exposure throughout the exposure to nanoparticles. . . 155
B.1 TEM image of adrenal glands of control and nanoparticle exposed groups . . . 159
B.2 TEM image of lungs of control and nanoparticle exposed groups . 160 B.3 TEM image of kidneys of control and nanoparticle exposed groups 160 B.4 4 TEM image of spleen of control and nanoparticle exposed groups 161 B.5 TEM image of frontal cortex of control and nanoparticle exposed groups . . . 161 B.6 TEM image of testis of control and nanoparticle exposed groups . 162 B.7 TEM image of cerebellum of control and nanoparticle exposed groups162
LIST OF FIGURES xvi
B.8 TEM image of hindbrain of control and nanoparticle exposed groups163 B.9 TEM image of hippocampus of control and nanoparticle exposed
groups . . . 163 B.10 TEM image of heart of control and nanoparticle exposed groups . 164 B.11 TEM image of liver of control and nanoparticle exposed groups . 164 B.12 TEM image of occipital lobe of control and nanoparticle exposed
List of Tables
2.1 Working parameters of marking laser system. . . 26
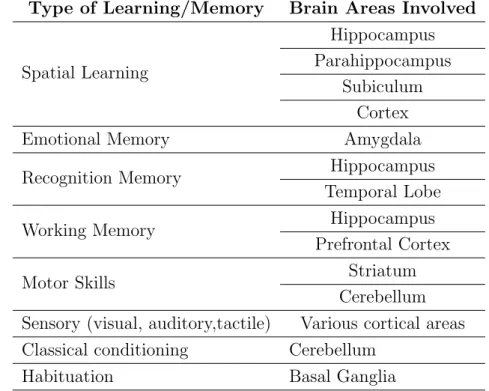
3.1 Brain areas responsible for different types of learning/memory. Adapted from [1]. . . 37
3.2 cDNA synthesis reagents . . . 62
3.3 Solution volumes and reaction conditions for qRT-PCR . . . 63
3.4 SDS-PAGE gel preparation . . . 65
4.1 Distribution of CuNP, SnNP and AlNP in rats’ organs according to TEM results. The presence of nanoparticles is indicated with the ”X” sign in the table. . . 84
5.1 The designed and synthesized primers to be used in cDNA Syn-thesis and qPCR (RP: reverse primer, FP: forward primer) . . . . 110
A.1 Primers used in cDNA Synthesis and qPCR experiments (RP: re-verse primer, FP: forward primer . . . 156
A.2 RNA concentrations and volumes used in cDNA Synthesis . . . . 156
A.3 RNA concentrations and A260/A280 and A260/A2300 ratios of RNA samples isolated from hippocampus tissue of controls and nanopar-ticle exposed groups. . . 157
A.4 Concentrations of proteins isolated from hippocampus tissue of controls and nanoparticle exposed groups. . . 158
B.1 The concentrations of the copper, tin and aluminum in the rat organs exposed to CuNP, SnNP and AlNP in the laser material processing real time exposure setup. . . 166
LIST OF TABLES xviii
C.1 RNA concentrations and volumes used in cDNA Synthesis . . . . 167 C.2 RNA concentrations and A260/A280 and A260/A230 ratios of RNA
samples isolated from hippocampus tissue of controls and nanopar-ticle exposed groups. . . 168 C.3 Concentrations of isolated proteins from SH-SY5Y cells
Chapter 1
Introduction
Pulsed laser ablation in liquid (PLAL) is a promising top-down approach for nanoparticle production and it allows production of wide variety of nanoparti-cles such as metal, metal oxide, nitride and semiconductor nanocrystals [2, 3]. Moreover, PLAL has numerous advantages compared to other nanoparticle pro-duction methods [4]. It leads to successful propro-duction of colloidal, pure and contamination-free nanoparticles [5, 6]. In this thesis, pulsed laser ablation was shown to be a suitable method for the production of a number of different nanoparticles both in liquids and gas environment. Furthermore, both powder and bulk starting materials were employed for nanoparticle production. In one of these studies, ultra-small hexagonal InN-NCs (<5nm in diameter) was shown to be produced from InN powder target in ethanol by using PLAL technique. Lower laser energy and lower ablation duration were demonstrated to result in much smaller nanoparticles.
Besides the production and characterization of nanoparticles, the toxicological effects of them were also represented throughout this study. Nanoparticles were shown to be produced as a result of various methods applied in industry, and one of the most important examples of these methods is cutting or drilling of materials using lasers [7]. As these nanoparticles are able to move freely in the
air, workers are exposed to these nanoparticles constantly. Materials used in in-dustry are mostly comprise heavy metals such as nickel and lead, and processing of these materials causes the release of nickel and lead nanoparticles. Respira-tion of these nanoparticles by the workers poses a great danger on health of the workers. Blood brain barrier (BBB) was shown to be disrupted upon nanopar-ticle exposure, which indicates the potential risk of these nanoparnanopar-ticles in the industry on central nervous system [8]. Firstly, real time nanoparticle exposure setup was designed by using a nanosecond laser marking system and rats were exposed to material processing environment where copper, tin and aluminum plates were marked for 3 months. To our knowledge, this is the first time in the literature using this kind of real time exposure setup, mimicking the real indus-trial working environment, for the investigation of nanoparticle distribution in the body. At the end of the exposure period, the effect of these nanoparticles on the learning and memory process were analyzed with behavioral tests, electrophysi-ology experiments and molecular analyzes. It was shown that CuNP, SnNP and AlNP were produced in the environment during the marking of respective metal plates. Both behavioral tests and in vivo electrophysiology experiments revealed that 3 months of CuNP, SnNP and AlNP exposure did not lead to any alter-ations in the learning and memory process of the rats. However, it was demon-strated that N-methyl-D-aspartate receptor (NMDAR) subunits NMDAR1 and NMDAR2a mRNA expressions were significantly increased in SnNP and AlNP exposed groups. Moreover, NMDAR1 protein levels were shown to decrease after CuNP and SnNP exposure compared to controls. It might be concluded that CuNP, SnNP and AlNP produced during laser materials processing might lead to changes in mRNA and protein levels of NMDAR after three months of expo-sure. Although this change was not reflected to the synaptic transmission and behavior, it might be suggested that in long term exposure there is a high risk to alter the learning and memory functions, together with neurodegeneration.
Cu, Sn and Al were also analyzed in terms of body distribution after 3 month of exposure with the real time laser material processing setup. These nanoparticles were detected in a number of organs throughout the body upon inhalation. The lack of these elements in the intestine demonstrates that the route of exposure
was only inhalation, but not digestion. Lungs, the primary target organs after the inhalation, were detected with the high element concentrations indicating the accumulation of these nanoparticles in the lungs. The nanoparticles also reached to a number of organs through systemic circulation, such as heart, liver, kidney, spleen, and testis. Moreover, nanoparticles were shown to reach a number of brain parts either by passing through the BBB or via olfactory bulb. The body distribution results indicate that nanoparticles produced during laser materials processing might lead to a number of health risks in human upon inhalation. These significant results reveal the high risk of the nanoparticles generated during the laser material processing for the people working in these industrial fields. Besides the risks for a number of organs, detection of these nanoparticles in different brain parts shows the severity of risk in terms of neurodegeneration and the apoptosis of neuron cells
On the other hand, the distribution and the toxicity of the pure AgNPs pro-duced by laser ablation method was also demonstrated in the rat hippocampal slices. The cellular uptake mechanism of pure AgNPs was demonstrated to de-pend on their sizes. No AgNPs were detected in synaptic vesicles following stim-ulation of synaptic vesicular recycling, thus, it was concluded that phagocytosis is the type of endocytotic pathway that dominates the entry of pure AgNPs into the hippocampal neurons. Moreover, AgNP led to dose-dependent toxicity in hippocampal slices. The data provide significant information for the further cellular and molecular research about the neurotoxicology of nanoparticles since exposure to silver nanoparticles might result in neurodegeneration. Furthermore, this study showed that laser ablation is a considerably useful method for study-ing nanoparticle toxicity since it provides pure nanoparticles mimickstudy-ing the ones encountered in the industry.
Finally, the effects of CuNP, SnNP and AlNP exposure were studied on SH-SY5Y human neuroblastoma cell line for the first time in the literature. It was shown that these nanoparticles led to a dose-dependent cytotoxicity in SH-SY5Y cells. Moreover, it was shown that NMDAR subunits NMDAR1 and NMDAR2a mRNA expressions and NMDAR1 protein levels were altered after CuNP, SnNP and AlNP administration.
Chapter 2
Nanoparticle Production with
Pulsed Laser Ablation Method
2.1
Introduction
In this chapter, pulsed laser ablation mechanism will be introduced. The use of pulsed laser ablation for the nanoparticle production both in the liquid and in the atmospheric environment will be presented together with experimental results.
2.1.1
Pulsed Laser Ablation Method
When materials are 100 nm or smaller, characteristics due to this nano-scale size become evident. Due to the changes of physicochemical properties of particles when they reach to nanoscale dimensions, they exhibit different characteristics than their bulk counterparts. While these changes allowed the nanotechnology field to grow rapidly with the wide range of advantages of nanoparticles used in various fields from electronics to biomedicine, the effects of particles on the human health are also significantly different than the bulk materials [9]. Nanoparticles, basically, are examined in two groups. The first group consists of nanoparticles
produced in laboratory environment for a specific aim, and the second group consists of nanoparticles generated in the environment or industry incidentally. Nanoparticles of the first group can be produced by various physical and chemical methods [10]. One of these methods is the method of nanoparticle production with pulsed laser ablation. With pulsed laser ablation method, nanoparticles can be used in different environments, namely solid, liquid and gas. The most impor-tant advantage of this method is the capability of producing pure nanoparticles as no chemical agent is used during the production. In other words, this method is free from any chemical agent, which ensures that nanoparticles can be produced more simply and more easily compared to other methods. Another advantage is that a wide variety of materials (namely metals, semiconductors, alloys and magnetics materials) can be processed with this method to produce nanoparti-cles. However, the size distribution of the nanoparticles produced by pulsed laser ablation method is in a wide range from a few nanometers to microns, which might be accepted as the disadvantage of this method [11].
2.1.2
Mechanism of Pulsed Laser Ablation Method
During the ablation of a solid target in a liquid environment, a number of consec-utive processes are observed. Firstly, as a result of reaching the laser light to the solid target, the plasma plume is generated. After the plasma plume generation, it is transformed and condensed. The plasma plume is significantly affected from the liquid confinement due to its thermodynamic and kinetic properties. The liquid confinement results in the shock wave formation due to the adiabatic ex-pansion of the laser-induced plasma at a supersonic velocity in the plasma plume. The material is removed from the solid target in a continuous manner as a result of vaporization because of the incoming laser pulse. The shock-wave leads to the induction of an extra pressure in the laser-induced plasma and it is called plasma-induced pressure. Meanwhile, the temperature in laser-plasma-induced plasma increases. As a result, the thermodynamic state of the laser-induced plasma changes to the state with higher temperature, higher pressure and higher density, which allows the formation of the metastable phases [12].
Four types of chemical reactions are detected in the laser-induced plasma and the interface between the liquid and the laser-induced plasma while it is in the transformation process. The first reaction is observed inside the laser-induced plasma owing to the high temperature and high pressure state of the laser-induced high-density plasma and new phase can originate by these chemical reactions between the ablations from the target. The second reaction occurs inside the laser-induced plasma, again. This time, the liquid molecules at the interface are excited and evaporated due to the high temperature and high pressure in the laser-induced plasma. Therefore, a new plasma from the liquid molecules are formed at the interface, which is called plasma-induced plasma. The laser-induced plasma and plasma-induced plasma are mixed and the laser-induced plasma includes a number of species from the plasma-induced plasma inside. The species generated from the laser ablation of the target and the species formed due to the excitation of the liquid molecules are engaged in the chemical reactions in this part. The third chemical reaction occurs at the interface of the laser-induced plasma and the liquid due to the high temperature, pressure and density. The forth reaction is observed inside the liquid when the ablated species from the solid target is affected by the high pressure of laser-induced plasma. In the chemical reactions where two species, namely the ones from the solid target and the ones from the confining liquid, are involved, the generation of new materials in nanoscale by the combination of the target and the liquid takes place. Finally, the plasma plume cools down and condenses in the confining liquid in two different ways. It can either condenses and deposits back on the target solid or condenses and become dispersed in the liquid by forming nanoscale materials [12]. When we explain the nanoscale material formation mechanism in detail, we should first assume the clusters and the surrounding plasma have the same temperature T, then isothermal nucleation time is given by;
τ =√2πmkT × kTγ ps(T )(∆µ)2)
(2.1)
where m is the mass of a single atom, k is the Boltzmann’s constant, T is the absolute temperature, γ is the surface energy density of the material, ps(T )
is saturated vapor pressure of nuclei at the temperature of T, and ∆µ is the atom chemical potential difference. With the decrease in the nucleation time, the pressure is elevated. However, the temperature and the nucleation time are inversely related to each other because of the saturated vapor pressure effect of nuclei. Thus, the diameter of nanomaterials could be expressed as;
d = V (2τd− τ ) + 2r∗ (2.2)
where τd and r∗ are the laser pulse duration and the size of critical nuclei of
the material, respectively. These theoretical calculations were also shown to be in good agreement with the experimental results [13, 12].
2.2
Nanoparticle Production with Pulsed Laser
Ablation in Liquids
Throughout the thesis study, a number of different nanoparticles (silver, gold, titanium, MoSe2 and so on)were produced by pulsed laser ablation method in
liquid both from solid and powder targets for different applications [14, 15, 16]. Besides, a recent study was conducted, in which indium nitride nanocrystals were produced.
The promising optoelectronic properties of Group III nitrides (InN, GaN, AlN) led to an increasing attention due to their potential applications [17]. Among them, due to its smallest effective mass, high electron mobility, superior electron transport properties and direct band gap structure, InN is a promising candidate for high speed optoelectronic devices, broad-spectrum solar cells, high electron mobility transistors, near infrared light emitting diodes (LEDs) and high speed laser diodes [18, 19, 20]. Furthermore, its nontoxic nature and infrared emis-sion properties enable InN to be used in biological and medical applications [21]. Besides these advantageous properties of InN material, its nanostructures have
been widely studied due to their different characteristics depending on the di-mensionality and size, which allow the applications in nanoscale electronic and optoelectronic devices [22, 23]. InN crystallizes in two different structures; stable hexagonal (wurtzite) structure and metastable cubic structure. When compared to hexagonal InN, cubic InN possesses smaller band gap and superior electronic properties due to its isotropic lattice and lower phonon scattering [24]. However, the production of cubic InN-NCs is quite a challenging process due to its thermo-dynamically unstable nature [25]. Previous studies showed a number of techniques viable for the synthesis of InN-NCs mainly having hexagonal structure. Ambient pressure and low temperature liquid phase was proposed as a suitable method for the synthesis of nanoparticles having low decomposition temperatures. It was shown that wurtzite InN-NCs having 6.2 nm average diameter are successfully produced using this method. These colloidal wurtzite InN-NCs were post-treated with nitric acid to get rid of the metallic indium byproduct and finally InN nano-powder was obtained [26]. Moreover, activated reactive evaporation and nitrogen plasma annealing methods were proposed for the successful production of wurtzite InN-NCs and InN nanorods, respectively. It was suggested that the technique is applicable to produce InN-NCs by using low temperatures from indium nanos-tructures obtained by different techniques [27]. Xiao et al. demonstrated the synthesis of 10 30 nm InN-NCs from sulfide precursor using a novel thermal conversion method at low temperatures and suggested that this method can be applied for the production of all group III nitrides [28]. The synthesis of wurtzite InN nanobelts was also performed by using guided-stream thermal chemical vapor deposition (GSCVD) technique [4]. Qaeed et al. proposed a chemical synthesis method not requiring high temperatures for large-scale nanoparticle production. These InN-NCs were shown to be cubic in structure and to have a grain size be-tween 11.4 and 21.4 nm [29]. On the other hand, rapid thermal ammonolysis was shown as a method for production of InN-NCs in hexagonal crystal structure [30]. Single crystalline InN-NCs having an average diameter of 15 nm and hexagonal structure were successfully produced using vapor-liquid-solid process [31]. Fur-thermore, single-crystalline hexagonal structured InN-NCs having 9.8 36.0 nm grain size were obtained by the reaction of InI3 and NaNH2 in benzene-thermal system [32]. In recent years, the most commonly used method is the production
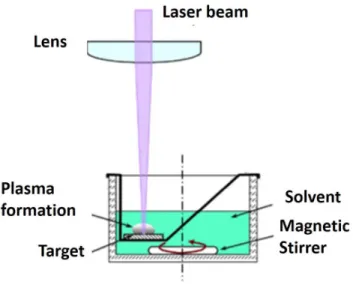
of nanoparticles in liquids by using pulsed laser ablation. The most important advantage of this method is that it does not require the use of vacuum systems. Since nanoparticles are trapped in the liquid, this method is cheaper and easier to proceed when compared to other methods. In pulsed laser ablation method, high energy laser beams pulsing with nano- or femtoseconds are focused on materials inside the liquid and make the material transform to its plasma form, creating ions and electrons via very high temperatures produced in this liquid environ-ment or direct ionization of the material itself (Figure 2.1) [33]. As the plasma form of the material is getting cooler in the liquid environment, nucleation of ions and electrons yields nanoparticles [34]. Highly pure nanoparticles produced with this method are used in various fields of nanotechnology field such as sensors, transistors and biology [35]. As produced nanoparticles are trapped in the liquid environment, they do not pose any hazard. Our group previously showed that pulsed laser ablation in liquid (PLAL) is a suitable method for the production of InN-NCs with hexagonal crystalline structure. Colloidal InN-NCs were produced in ethanol by ablating the HPCVD-grown InN thin film sample with different energies using a nanosecond pulsed laser. The average diameter of the produced InN-NCs was 10 nm [36]. These InN-NCs were shown to have applications such as a near infrared range photodetector [37] and charge trapping memory cells [38]. However, the starting material was HPCVD-grown InN thin film and the starting material, either a bulk target or a suspension, affects the final nanoparticle size in PLAL. It was previously shown that pulsed laser ablation of suspensions results in much smaller nanoparticle sizes compared to the ablation of bulk target. It was suggested that the particles in the suspension absorb all the laser energy since the particles encounter multiple pulses during all the ablation process due to continuous stirring. On the other hand, the laser energy is absorbed only by the target in case of ablation of bulk target and results in larger nanoparticles. Furthermore, the particle size of the nanoparticles at the end of the ablation process depends on the initial size of the suspended particles [39, 40].
In this study, we aimed to produce ultra-small InN-NCs by using suspension of micron-sized InN powder in ethanol with PLAL method and, to our knowl-edge, we reached the smallest nanocrystal size for InN-NCs in the literature. For
Figure 2.1: Nanoparticle production setup with pulsed laser ablation method in liquid. Adapted from [33]
this purpose, we performed series of PLAL processes with different solvents (iso-propanol, ethanol and water), different laser energies (3 mJ, 4 mJ and 5 mJ) and different ablation times (up to 300 min). The formation of InN-NCs was con-firmed by using scanning electron microscope (SEM) and transmission electron microscope (TEM). Moreover, we used X-ray diffraction (XRD) to confirm the crystal structure of InN-NCs. Absorption, zeta potential and RAMAN analy-ses were performed for further characterization of the nanocrystals. We showed that formation mechanism of InN-NCs was through pulsed laser fragmentation and melting by analyzing the SEM. We successfully demonstrated the presence of fragmented/molten particles and nanoparticles in the SEM images. Moreover, the hexagonal crystalline structure of the powder target was preserved after the nanoparticle formation. Overall, we proposed a roadmap for the generation of ultra-small (<5 nm) InN-NCs by combination of PLAL and suspension of micron-sized target after optimizing the laser parameters such as liquid environment, laser ablation time, laser energy and applying centrifugation with appropriate time and speed as a post-synthesis treatment.
2.2.1
Materials and Method
2.2.1.1 Nanocrystal Synthesis
InN-NCs were generated by using a commercial nanosecond pulsed ND:YLF laser (Empower Q-Switched Laser, Spectra Physics) operating at 527 nm with a 100 ns pulse duration and 1 kHz repetition rate. InN target was purchased as powder (Santa Cruz Biotechnology, USA) and 1 mg powder was dissolved in 10 ml of pure solvent (isopropanol, ethanol and water). To obtain a well dispersed InN-NC solution, the colloidal nanomaterial solution was continuously stirred by a magnetic stirrer at 1000 rpm during the laser ablation process. The colloidal solution was light orange after nanoparticle formation for all experiments. In all laser ablation procedures, the laser beam was focused on InN solution by the help of a plano-convex lens with a focal length of 50 mm. The laser power for the ablation process varied in different processes as 3W, 4W and 5W with corresponding pulse energies of 3mJ, 4mJ and 5mJ, respectively. As another parameter to test, different ablation durations starting from 1 min to 300 min were studied. 15 minutes of centrifugation at 4.000 xg was also performed for two samples obtained with 3mJ pulse energy (15 and 60 min ablation time) to make the nanocrystals smaller than 5 nm isolated in high resolution TEM (HR-TEM) images.
2.2.1.2 Nanocrystal Characterization
Different characterization methods were utilized throughout this study. The high-resolution transmission electron microscope (HR-TEM) imaging of the InN-NCs was carried out by using the FEI-Tecnai G2 F30 TEM instrument at an operat-ing voltage of 300 kV. All samples were prepared by drop-castoperat-ing the solutions onto separate carbon-coated TEM grids. Each histogram data were obtained by counting 100 particles from the TEM images and using Image J Image Processing and Analysis software. The morphology and the time course of the nanoparticle generation was monitored by using scanning electron microscope (SEM, Quanta
200 FEG, FEI Instruments, USA). For the stability analyses, zeta potential mea-surement was carried out (Malvern Instruments Ltd, Malvern, UK). Absorption analysis of the InN-NCs was performed in 200 nm 800 nm range (Varian Cary 100 UV/Vis spectrophotometer). To determine the crystalline structure and the composition of the InN-NCs, X-ray diffraction (XRD) analysis was performed (PANalytical XPert PRO multipurpose diffractometer, Netherlands). The opera-tion voltage was 45 kV and the current was 40 mA with a CuK radiaopera-tion source. The sample was prepared by depositing and drop-casting the InN-NCs on quartz substrate. Raman spectroscopy was performed by using a Witec Alpha 300S Micro Raman spectrometer with a Nd:YAG laser at an excitation wavelength of 532 nm (laser power: 10 mW, laser spot size ≈ 4 m, unpolarized) and a Nikon 100x (N.A. = 0.9) air objective. The integration time was 1.035 second and we obtained the data in 3.5 hours. The sample was dropcasted onto a Si substrate with < 111 > orientation.
2.2.2
Results and Discussion
2.2.2.1 Stability issue of InN-NCs in different solvents
Stability of the produced nanoparticles is a challenging issue and PLAL has the advantage of production of stable nanoparticles even without using any stabiliz-ers or surfactants [41]. It was shown that the solvent plays a significant role in the stability of produced nanoparticles with PLAL [42]. Thus, we first aimed to determine the most appropriate solvent in which InN-NCs is stable. For this purpose, we used ethanol, isopropanol and distilled water and performed laser ablation for 30 minutes at 3mJ laser energy. SEM (Figure 2.2a, b, c) and TEM (Figure 2.2d, e, f) images showed that InN-NCs smaller than 50 nm were suc-cessfully produced in all of three solvents and no aggregation was observed in freshly synthesized samples. Although the nanocrystals seem to be aggregated in TEM figures, they are isolated nanoparticles in the solution. Since drop-casting method is used in the TEM sample preparation, these nanocrystals prefer to stay together during evaporation of the solvent. Therefore, the nanocrystals TEM
images might appear as they are aggregated. On the other hand, zeta potential measurement of these samples (Figure 2.3) demonstrated that InN-NCs produced in ethanol has the highest zeta potential value (42.40 ± 1.08 mV) compared to the InN-NCs in isopropanol and water (37.73 ± 5.38 mV and 35.83 ± 1.48 mV, respectively). Thus, ethanol was determined as the most appropriate solvent for InN-NCs to be produced in terms of stability.
Figure 2.2: SEM and TEM images of InN-NCs produced in (a, d) ethanol, (b, e) isopropanol and (c, f) water. InN-NCs smaller than 50 nm were successfully produced in all of three solvents.
2.2.2.2 Effects of laser energy and ablation duration on InN-NCs
Laser energy was shown to be a significant parameter for nanoparticle production with PLAL method, specifically for the size distribution of the nanoparticles [43]. Hence, we focused on the effect of laser energy on the InN-NC particle size. 3 mJ, 4 mJ and 5 mJ laser energies were investigated in 60 minute ablation
Figure 2.3: Zeta potential graph for InN-NCs produced in ethanol, isopropanol and water. Zeta potential values were 42.40 ± 1.08 mV, 37.73 ± 5.38 mV and 35.83 ± 1.48 mV for the InN-NCs produced in ethanol, isopropanol and water, respectively. The most stable InN-NCs were produced in ethanol.
duration. TEM images were obtained for InN-NCs produced with each laser energy (Figure 2.4 a, b, c) and the average diameter of InN-NCs was calculated using the histogram data (Figure 2.4 d, e, f). The histogram data were obtained by measuring the diameters of single isolated InN-NCs from the TEM images. The smallest mean size of the InN-NCs was observed with in ablation with 3 mJ laser energy (10.84 ± 0.71 nm) while ablation with 4mJ and 5mJ resulted in 16.27 ± 0.68 nm and 16.06 ± 0.59 nm, respectively. Thus, smaller InN-NCs were obtained by using lower laser energy in ablation procedure. In a previous study, we showed that the lower pulse energies with nanosecond laser ablation of InN thin-film led to a decrease in the nanoparticle size distribution but the smaller nanoparticles were obtained with larger energies [37]. The target material has a great importance since the laser pulse with higher energy result in much more ablation process on the solid target while the increase in the energy did not affect the nanoparticle sizes after a certain value with the continuously stirred sample powder sample.
It was demonstrated that nanoparticles start to aggregate and precipitate when the ablation duration increases [44]. Therefore, we used different laser ablation durations at 3mJ laser energy to optimize the ablation duration and to observe the formation mechanism of InN-NCs. SEM images were analyzed in terms of ablation durations (5, 15, 30, 60, 90, 120, 180 minutes) (Figure 2.5 b-h) start-ing from the InN powder samples consiststart-ing of micron sized InN flakes (Figure
Figure 2.4: TEM images and histogram data of InN-NCs produced with (a, d) 3mJ, (b, e) 4mJ and (c, f) 5mJ laser energies. The average InN-NC diameters were determined as 10.84 ± 0.71 nm, 16.27 ± 0.68 nm and 16.06 ± 0.59 nm for the laser energies of 3mJ, 4mJ and 5 mJ, respectively. 3mJ laser energy resulted in the smallest nanoparticle diameter and narrower size distribution
2.25a). When laser interacted with the InN powder, it caused melting in the interacted area. On the other hand, increased temperature in the non-interacted area resulted in formation of nanoparticles and molten particles on the powder surface as shown in the inset of Figure 2.5b. Nanoparticle production began at 15 minutes ablation duration. The SEM image of 15 min ablated sample clearly showed that there were also fragmented particles together with molten spher-ical particles. Furthermore, with increasing ablation durations, firstly micron particles (powder, fragmented, molten particles) disappeared and nanoparticles seemed to be decreasing in size. However, the decrease in size led to aggregation after 60 minutes ablation.
Figure 2.5: SEM images of InN (a) powder, and nanoparticles after (b) 5 min, (c) 15 min, (d) 30 min, (e) 60 min, (f) 90 min, (g) 120 min and (h) 180 min ablation durations.
After a topographical analysis with SEM, TEM images were obtained to eval-uate the size distribution of the InN-NCs. As depicted in TEM images (Fig-ure 2.6a-d), we obtained smaller nanoparticles with a narrower size distribution with increasing ablation duration. This was also confirmed with the aforemen-tioned SEM analysis. However, after 15 minute ablation, the size distribution got broader and the mean size of the InN-NCs increased. This might be because of the fact that the smaller the nanoparticles, the more aggregation is observed. The micron sized particles were not included in the histogram analysis for 15 min ablation process.
Figure 2.6: TEM images of InN-NCs at (a) 15 min, (b) 60 min, (c) 120 min, (d) 180 min laser ablation durations. As the ablation duration increases, the size distribution of the InN-NCs increases.
2.2.2.3 Post-synthesis treatment
One of the interesting property of InN-NCs is the optical behavior of nanopar-ticles produced with different ablation times that lead to different particle sizes. To analyze the optical properties of InN-NCs, we further determined the absorp-tion behavior in UV-Vis spectra from 200 nm to 800 nm (Figure 2.7). InN-NCs demonstrated an increased absorption intensity in two main UV regions (200 nm and 300 nm) after 15 min ablation time. When the ablation duration increased, the intensity in the spectra increased since the concentration of the nanoparti-cles increased. On the other hand, the shoulder of the peak in 300 nm region became more pronounced after 60 min ablation due to the aggregation of the nanoparticles. This aggregation led to larger nanoparticle size and a red shift in the UV-Vis spectra. We further analyzed the optical behavior of nanoparticles up to 300 min and observed that there was no significant change on the optical behavior providing the stable particle sizes.
Figure 2.7: Absorption of InN-NCs produced at different ablation durations. The intensity throughout the UV region increases with increasing ablation du-ration. Moreover, the aggregation of InN-NCs after a certain ablation duration, namely 60 min, leads to a shoulder with a red shift in the peak at around 300 nm (a.u.: arbitrary units in all figures).
Although we were able to obtain the histogram data, much smaller nanopar-ticles distinguished by TEM images (Figure 2.6) might not be easily detected in UV-Vis spectra due to the larger nanoparticles. To determine the size and behavior of these smaller nanoparticles, we used centrifugation technique. For this purpose, we focused on two different ablation durations, 15 minutes and 60 minutes. After the centrifugation process, we checked the absorption behavior of the nanoparticles (Figure 2.8a and b). When compared to the samples before centrifugation, the spectra shifted to UV region demonstrating that centrifuga-tion process was successful in selecting the smaller nanoparticles. The intensity also decreased for the InN-NCs produced at 60 min laser ablation duration, which might be due to the unoptimized centrifugation process. However, zeta potential analysis (Figure 2.8c) revealed that when the samples were centrifuged, the sta-bility was conceded since the zeta potential values decreased after centrifugation. The decrease in the stability is consistent with the previous data indicating that smaller nanoparticles have the tendency of faster aggregation [45].
Moreover, as discussed previously, the centrifugation of 60 min ablated sample resulted in a higher zeta potential value when compared to that of 15 min ablated and centrifuged sample. This is also consistent with the size analysis since 15 min
Figure 2.8: Absorption of InN-NCs produced at (a) 15 min and (b) 60 min ablation duration before and after centrifugation. Centrifugation process results in the elimination of the larger nanoparticles in the colloidal suspension, thus leading to the disappearance of the peak around 300 nm wavelength. Smaller nanoparticles display the absorption through the UV region. (c) The zeta poten-tial values of InN-NCs produced at 15 min and 60 min ablation duration before and after centrifugation. The zeta potential of InN-NCs produced at 15 min and 60 min ablation duration are 38.5 ± 0.72 mV and 34.36 ± 0.46 mV, respectively. However, after centrifugation the zeta potential values decreased to 16.66 ± 0.79 mV and 22.03 ± 0.24 mV for the nanoparticles produced at 15 min and 60 min ablation duration, respectively.
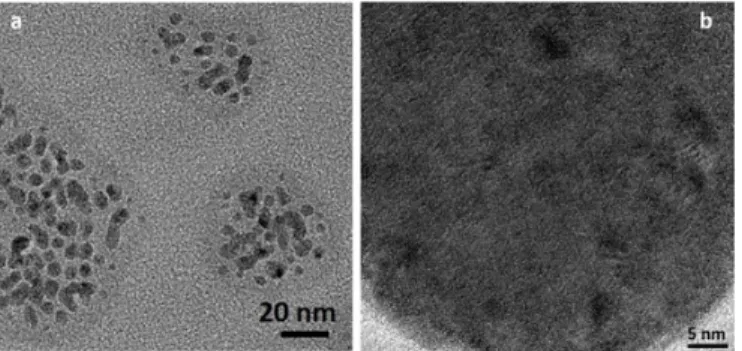
ablation led to much smaller InN-NC sizes and a faster aggregation as inferred from the zeta potential values. To obtain a more stable colloidal nanoparticle solution produced by PLAL, it was suggested in some previous studies that sur-factants and stabilizers can be used [46, 47]. TEM and HR-TEM images were obtained for 15 minutes and 60 minutes ablated samples (Figure 2.9). TEM data showed that after centrifugation, much smaller InN-NCs, which were previously observed as a background, became noticeable due to the disappearance of larger nanoparticles. Moreover, it was demonstrated with HR-TEM analysis that the InN-NCs had crystalline structure. Both single crystalline and polycrystalline InN-NCs were observed in TEM analysis. The HR-TEM image of the single crystalline InN-NC in the inset of Figure 8c reveals the crystalline lattice fringes having a lattice spacing of 0.28 nm, corresponding to (002) plane of hexagonal InN-NC [32, 36, 48]. TEM images from centrifuged samples allowed us to deter-mine the size of nanoparticles smaller than 5 nm. The histogram analysis (Figure 2.10) showed that we obtained InN-NC smaller than 5 nm in both 15 minutes and 60 minutes ablated samples.
Figure 2.9: TEM images of InN-NCs produced at (a) 15 min and (b) 60 min laser ablation durations. To determine the size of InN-NCs smaller than 5 nm, a centrifuge process was performed and TEM images of the centrifuged samples of (c) 15 min and (d) 60 min ablated InN-NCs are represented. The inset images demonstrate the crystalline structure of InN-NCs. The 0.28 nm lattice fringe confirms the (002) plane of hexagonal InN-NC.
2.2.2.4 Crystal structure analysis
After the InN NCs were confirmed to be in crystalline form from the HR TEM images, we studied the crystal structure in detail by using XRD. XRD analysis re-sults of the powder target, 15 minutes and 60 minutes ablated samples are shown in figure 2.11. The peaks of 15 minutes and 60 minutes ablated samples at two theta degrees of 28.92, 31.14, 32.96, 36.10, 43.13, 51.46 and 56.82 indicated that InN-NCs had hexagonal crystal structure. Moreover, there were In2O3 diffraction
peaks at two theta degrees of 30.38, 32.72, 35.22, 38.93, 54.23 as shown in the figure. Since we used ethanol as the solvent, In2O3 was generated in the solution
as a byproduct, together with In metal which had a quite small peak at two theta degrees of 36.10. In2O3 peaks became more intense in the sample ablated for 60
minutes indicating that increased ablation times resulted in more oxidation of the nanoparticles. The same hexagonal InN peaks also appeared in the XRD
Figure 2.10: Histogram of InN-NCs produced at (a) 15 min and (b) 60 min. After centrifugation of (c) 15 min and (d) 60 min ablated InN-NCs, the ones smaller than 5 nm could be determined.
analysis of the target powder confirming that the process included pulsed laser fragmentation, thus the crystalline phase of the nanoparticles did not change dur-ing the production process. Moreover, the molten nanoparticles observed in SEM images do not seem to be modified in terms of crystal structure, which shows that melting did not have any effect on the crystallinity of InN-NCs. The XRD peaks are in a good agreement with the XRD data presented in the literature for the InN-NCs produced or grown with different techniques [22, 26, 27]. Furthermore, In metal and In2O3 peaks, except for the one at the 2 theta degree of 30.38, were
also present in the XRD analysis of InN powder suggesting that a purer starting material consisting of only InN would result in a colloidal InN-NC solution with less In2O3.
2.2.2.5 RAMAN Investigation
Another characterization method for InN-NCs is the Raman spectroscopy analy-sis. 15 minutes and 60 minutes ablated samples were analyzed and it was found that the sharp peaks at 481.68 cm-1 and 479.85 cm-1, respectively, correspond to E2 mode of the hexagonal InN-NCs (Figure 2.12). The InN-NC RAMAN peaks
Figure 2.11: XRD analysis of InN powder as the starting material and InN-NCs after 15 min and 60 min laser ablation process. InN powder was shown to be consisting of hexagonal InN together with In metal and In2O3. After 15 min and
60 min laser ablation, the hexagonal phase of the nanoparticles did not differ from the phase of the InN powder, which indicated the formation mechanism was through fragmentation. Moreover, the intensity of In2O3 peaks increase in 60
min ablated samples when compared to the 15 min samples, implying that longer ablation durations lead to more oxidation of the sample.
and XRD data confirmed the hexagonal phase of the InN-NCs, which is also con-sistent with the literature [22, 28]. The peak at 516.46 cm-1 show the RAMAN
spectrum of Si substrate.
2.2.3
Conclusion
We showed for the first time that ultra-small InN-NCs (<5nm in diameter) can be produced from InN powder target by using PLAL technique. We demonstrated that lower laser energy and shorter ablation duration result in much smaller nanoparticles since even if the ablation time increased and the smaller nanoparti-cles were produced, they tended to aggregate. Hexagonal InN-NCs smaller than 5 nm in diameter were produced in ethanol with optimized ablation conditions successfully. We showed that PLAL is a suitable technique for production of InN-NCs, which is a Group III nitride. Thus, other nitrides in the same group
Figure 2.12: RAMAN spectra of InN-NCs produced at 15 min and 60 min. Sharp peaks at 481.68 cm-1and 479.85 cm-1correspond to E
2 mode of the
hexag-onal InN-NCs. The peak at 516.46 cm-1 shows the RAMAN spectrum of Si substrate, which has a < 111 > orientation.
might be successfully produced with this technique. As an outlook of InN-NC production with PLAL method, ablation with femtosecond laser pulses might be studied to overcome the low decomposition temperature disadvantage of InN material.
2.3
Nanoparticle Production with Pulsed Laser
Ablation in Atmospheric Environment
2.3.1
Introduction
Although a number of nanoparticles were generated by pulsed laser ablation method in the liquids, it was demonstrated that nanoparticles can also be pro-duced in air or in vacuum (Figure 2.13) by focusing of laser beams onto materials. In a study, it was shown that the ratio of laser ablation in air was 100 times greater than that of in liquid environment, so that the amount of nanoparticles produced in gaseous environment was a lot higher than the liquid environment [49]. This
phenomenon reveals the health risk of these nanoparticles for the people working in laser material processing areas. To our knowledge, no study in the literature has shown the effects of nanoparticles generated in the air as the byproduct of laser material processing. Thus, the main aim of this thesis study was to demon-strate the production of nanoparticles in the atmospheric environment during laser material processing by mimicking the working environment in the industry and to evaluate their health risks on rats upon exposure to these nanoparticles. For this purpose, a material marking laser was purchased and a chamber around this laser was designed and developed to mimic the working environment.
Figure 2.13: Nanoparticle production setup with pulsed laser ablation method in the atmospheric environment. Adapted from [49].
2.3.2
Materials and Method
2.3.2.1 Integration of the Laser System
A nanosecond laser marking system was purchased for the processing of metal plates. For the inhalation experiments, which will be explained in next chapter, an acrylic cabinet around the laser system was also designed and developed so that the rats are effectively exposed to the environment where nanoparticles are produced during the laser material processing. The stability, impermeability and transparency properties were considered while designing the cabinet. Moreover,
two different doors were designed for placing and taking out the materials to be processed and the rats’ cage, respectively (Figure 2.14).
Figure 2.14: The laser cabinet which is integrated to the laser marking system and which provides the environment for the nanoparticle exposure of rats during the laser material processing.
The working parameters of the laser system are given in Table 2.1.
2.3.2.2 Optimization of the Nanoparticle Production During Material Processing
In this study, copper, tin and aluminum plates were determined to be used for materials processing. In preliminary studies, the laser parameters were optimized as 1.5 kHz repetition rate, 3W power, 25 mm/sec laser scan speed and 17.25 cm focal length.
10 ml distilled water was placed into the cabinet to collect and characterize the nanoparticles, which are predicted to be produced in the environment during material processing. Scanning electron microscope (SEM) (FEI Quanta 200 FEG) and energy dispersive X-ray spectroscopy (EDX) were used to characterize these nanoparticles. For SEM analysis, nanoparticle sample was drop-casted onto the Si < 111 > wafer.
Table 2.1: Working parameters of marking laser system.
Laser Type Nd:YAG Diode Laser Wavelength 1064 nm
Repetition Rate 0-50 kHz Laser Power 50W Pulse Duration 100 ns
Pulse Generation Technique Acoustooptic Q Switch Focus Diameter 0.3 mm
Cooling System Water Cooling
2.3.2.3 The Distribution of Copper Nanoparticles in the Cabinet and Their Characterization
After determining and analyzing the marking parameters, the distribution of nanoparticles in the cabinet was evaluated. Moreover, these nanoparticles were characterized. For this purpose, four beakers with 10 ml distilled water inside were placed into four different locations in the cabinet. Beaker 1 was placed just near the marking area, beaker 2 was placed to the area where the rat cage is planned to be placed. Beaker 3 and beaker 4 were placed into the backside and front side corners of the cabinet, respectively (Figure 2.15).
Moreover, the Cu element concentration in the distilled water collected in beaker 2 was determined with Inductively Coupled Plasma Mass Spectrometry (ICP-MS). For this purpose, 1 ml water sample was dissolved in 7 ml of HNO3.
2.3.2.4 Marking of the Copper, Tin and Aluminum Plate with Laser System and Characterization of the Plates and Nanoparticles
The marking parameters for the copper plate (18 cm in diameter) were deter-mined as 10A current, 1.5 kHz repetition rate, 4W power, 25 mm/sec laser scan speed and 18.5 cm focal length. Moreover, to determine the marking depth of the
Figure 2.15: Four beakers containing 10 ml distilled water was placed into the laser cabinet to determine the nanoparticle distribution. The laser worked in the pre-determined parameters to mark the copper plate and the nanoparticles collected into the water samples were analyzed.
laser and to make this depth measurable with atomic force microscopy (AFM), a part of the copper plate was marked for 10 times, it was analyzed with SEM and the depth was measured with AFM in a 15 µm x 15 µm area.
The copper nanoparticles (CuNP) which were generated during the marking of copper plate were collected into 10 ml distilled water in a beaker and charac-terized with X-ray photoelectron spectroscopy (XPS) and transmission electron microscopy (TEM).
The marking parameters for the tin plate (14 cm in diameter) were determined as 10A current, 1.5 kHz repetition rate, 4W power, 25 mm/sec laser scan speed and 18.5 cm focal length. Moreover, to determine the marking depth of the laser and to make this depth measurable with SEM, a part of the tin plate was marked for 5 times, it was analyzed with SEM in 45◦. The tin nanoparticles (SnNP), which were generated during the marking of tin plate, were collected in 10 ml distilled water in a beaker, placed into the cabinet. SnNP were characterized with XPS and TEM.
The marking parameters for the aluminum plate (16x14 cm) were determined as 10A current, 1.5 kHz repetition rate, 4W power, 25 mm/sec laser scan speed
and 18.5 cm focal length. To determine the marking depth of the laser and to make this depth measurable with SEM, a part of the aluminum plate was marked for 20 times, it was analyzed with SEM in 45◦. The aluminum nanopar-ticles (AlNP), which were generated during the marking of aluminum plate, were collected in 10 ml distilled water in a beaker, placed into the cabinet. AlNP were characterized with XPS and TEM.
2.3.3
Results and Discussion
2.3.3.1 The Distribution of Copper Nanoparticles in the Cabinet and Their Characterization
Four beakers with 10 ml distilled water inside were placed inside the cabinet to determine the distribution of CuNP in the cabinet. CuNP were shown in beakers 1 and 2, but, no CuNP were demonstrated in beakers 3 and 4. The TEM image of the CuNP collected from beaker 2 was shown in figure 2.16 and it was shown that CuNP has crystalline structure.
Figure 2.16: TEM analysis of CuNP in beaker 2. (a) TEM image and (b) the crystal structure of CuNP.
Besides the CuNP detected in the sample taken from beaker 2, there were also micron-sized particles, which were demonstrated with the SEM image in figure 2.17a. On the other hand, figure 2.17b reveals that these particles, either nano-or micron-sized, are copper as a result of EDX analysis.
Figure 2.17: (a) SEM and (b) EDX analyses of the sample taken from beaker 2. Si element is found in EDX analysis since the substrate in the characterization is Si wafer.
The distribution profile of nanoparticles generated during laser material pro-cessing was determined such that they are mainly distributed near the marking area and the central area, where the rat cage is planned to be placed for the inhalation experiments.
At the end of two hours marking of copper plate, the concentration of Cu element in the distilled water was determined as 0.241 µg/g. Moreover, the same sample was characterized with XPS and the analysis data confirmed that the CuNP is present in the water sample (Figure 2.18).
Figure 2.18: XPS analysis of CuNP in beaker 2. The presence of Cu 2p1/2 and