Vo lu m e 6 2 , N u m b e r 2 , P a g e s 1 7 –2 7 (2 0 1 3 ) IS S N 1 3 0 3 –5 9 9 1
WATADA’S FUZZY PORTFOLIO SELECTION MODEL AND ITS APPLICATION
GULTAC EROGLU INAN, AYSEN APAYDIN
Abstract. Portfolio selection has been originally proposed by H.M. Markowitz 1952. The Markowitz’s approcach to the portfolio selection has some di¢ cul-ties. For example, an aspiration level given by decision makers aren’t taken into consideration in the Markowitz approach. In this paper, Watada’s Fuzzy Portfolio Selection Model Based on Decision Maker’s Aspiration Level is pre-sented basically. A numerical example of the Watada’s Portfolio Selection Problem is given as the application. Data is taken as the closing prices of eight securities that cycling in ·Istanbul Stock Exchange (IMKB) between the dates of 01.06.2009-01.06.2010. Finally, it can be said that,the aspiration lev-els have been provided with a high membership degree so we can say that the successfull portfolio has been formed. During the study, Excel, Minitab and Lingo software programmes were used.
1. Introduction
A major step in the direction of the quantitative management of portfolio was made by Harry Markowitz in his paper "Porftolio Selection" published in 1952 in the Journal of Finance. The ideas introduced in this article have come to build the foundations of what is now popularly referred to as mean-variance analysis, mean-variance optimization, and Modern Portfolio Theory.
Markowitz reasoned that investors should decide on the basis of a trade-o¤ be-tween risk and ecpected retun. Expected return of a security is de…ned as the expected price change plus any additional income over the time horizon consid-ered, such as dividend payments, divided by the beginning price of the security. He suggested that risk should be measured by the variance of returns-the average squared deviation around the expected retur ·n. He argued that for any given level of expected return, a rational investor would choose the portfolio with minimum variance from amongst the set of all possible portfolios. (Fabozzi et al 2007).
Received by the editors Oct. 5, 2012; Accepted: Sep. 8, 2013.
2000 Mathematics Subject Classi…cation. Primary 91B28; Secondary 90C70.
Key words and phrases. Portfolio Analysis, Portfolio Risk, Expected Return, Fuzzy Set, Fuzzy Portfolio Selection.
c 2 0 1 3 A n ka ra U n ive rsity
The term "fuzzy" was proposed by Zadeh (1962). Zadeh (1965) formally pub-lished the famous paper "Fuzzy Sets". The fuzzy set theory is developed to improve the oversimpli…ed model, thereby developing a more robust and ‡exible model in order to solve real-world complex systems involving human aspects. Furthermore, it helps the decision maker not only to consider the existing alternatives under given constraints (optimize a given system), but also to develop new alternatives. The fuzzy set theory has been applied in many …elds, such as operations research, management science, control theory, expert system, human behavior (Lai-Hwang 1992).
An investor is faced with a choice from an enormous number of assets, such as stocks and bonds. It seems very di¢ cult to decide which securities should be selected because of the inherent existence of uncertainty. Similar to other decision problems in an uncertainty environment, portfolio selection problems can also be modeled as fuzzy programming problems (Tanaka and Guo1998).
Tanaka et al (2000) proposed the two kinds of portfolio selection models based on fuzzy probabilities and possibility distributions rather than probability distribu-tions in Markowitz’s model.They gave a numerical example of a portfolio selection probem. In the study fuzzy probabilities and possibility distributions were obtained depending on possibility grades associated with security data. Based on a fuzzy probability and a possibility distribution, portfolios were selected to minimize the variance of the return of a portfolio in a fuzzy probability model and the spread of the return of a portfolio in a possibility model.
Watada (2001) formed a portfolio selection model by using fuzzy decision theory. This model is directly related to mean–variance model. First a decision maker de…nes, for each of an expected return and risk, a necessity level which requires all feasible solutions should hold, that is, a minimum requirement and a su¢ ciency level at which a decision maker is satis…ed with a solution. Then membership functions are constructed for each of an expected return and risk.
Huang (2007)* made a new de…nition of risk for random fuzzy portfolio selection. The aim of the study is to solve the portfolio selection problem when security returns contain both randomness and fuzziness.In the study a new optimal portfolio selection model is proposed and a new hybrid intelligent algorithm is designed for solving this new problem.
Huang (2007)** proposed the two new types of fuzzy mean variance models. based on credibility measure. In the study, security returns were regarded as fuzzy variables.He provided a hybrid intelligent algorithm to give a general solution. As result, it was shown that the proposed model was e¤ective by the numerical exam-ples.
Hasuike et al (2009) formulated random fuzzy portfolio selection problems as nonlinear programming problems based on both stochastic and fuzzy programming approaches. In the study several portfolio selection problems including probabilis-tic future returns with ambiguous expected returns are assumed as random fuzzy
variables. They transformed the problems into equivalent deterministic quadratic programming problems. They used the probabilistic change constraints, possibility measure and fuzzy goals.
2. Portfolio Analysis
In 1952, Markowitz published his pioneering work which paved the foundation of the modern portfolio analysis. It combines probability and optimization techniques to model the behaviour of investment under uncertainty. The investors are assumed to strike a balance between maximizing the return and minimizing the risk of their investment. The return is quanti…ed by the mean, and the risk is charecterized by the variance, of a portfolio of assets. The two objectives of an investor are thus to maximize the expected value of return and to minimize the variance of a porrtfolio. The return of a portfolio is equal to the weighted mean of securities in the portfolio. The weight of each return is a ratio of security in a portfolio. The return of a portfolio is de…ned as,
rp = n X i=1 RiXi= R1X1+ R2X2+ ::: + RnXn = (R1; :::; Rn) 0 B @ X1 .. . Xn 1 C A (2.1) = RtX
Where Ri is the return of ith security (i = 1; 2; :::; n) and Xi is the weight of the
ithsecurity respectively.
Expected return of a portfolio is de…ned as
E (rp) = E n X i=1 RiXi ! = n P i=1 riXi = r1X1+ r2X2+ ::: + rnXn (2.1) = (r1; :::; rn) 0 B @ X1 .. . Xn 1 C A (2.2) = rtX The variance of the portfolio is de…ned as,
V ar (rp) = V ar XtR = Xt X (2.3) = n P i=1 n P j=1 XiXjCov (ij)
Then portfolio risk is as follows
p= s n P i=1 n P j=1 XiXjCov (ij) (2.4)
(Wang and Zhu 2002).
3. Markowitz’s Portfolio Selection Model
Markowitz considered possibility and optimization techniques together for mod-elling the behaviour of a model under uncertainty. Return matrix, mean vector and variance-covariance matrix are fundamental components in Markowitz model.
Assume that there are n securities denoted by Si(i = 1; :::; n), the return of the
security Si is denoted as Ri and the proportion of total investment funds devoted
to this security is denoted as Xi:Thus n
P
i=1
Xi= 1:
Since Ri(i = 1; :::; n)vary from time to time, those are assumed to be random
variables which can be represented by the pair of the average vector and covariance matrix. At the discrete time (k = 1; :::; m) (for m period) n kinds of returns are denoted as a vector
(Rk1; :::; Rkn)t; k = 1; :::; m
The total data over m periods are denoted as the following the return matrix
Rt= 0 B @ R11 R1n .. . . .. ... Rm1 Rmn 1 C A (3.1)
where Rkiis the weight of i: (i = 1; :::; n) securities in k: (k = 1; :::; m) period.
Then average vector of returns over in m period is denoted as = ( 1; :::; n)t and is written as = 0 B B B B B @ m P k=1 Rk1 m .. . m P k=1 Rkn m 1 C C C C C A (3.2)
Also the corresponding variance covariance matrix S = S2 ij can be written as Sij2 = m P k=1 (Rki i) Rkj j m 1 (3.3)
Therefore random variables can be represented by the average vector and the covariance matrix S, denoted as ( ; S). Since the variance is regarded as the risk of investment, the best investment is one with the minimum variance for a given level of return.This leads to the following quadratic programming problem,
min XtSX tX n P i=1 Xi = 1 (3.4) Xi 0; i = 1; 2; :::; n
Where represents the minimum expected return the investor would accept (Tanaka et. al 2000)
4. Watada Fuzzy Portfolio Selection Model
Fuzzy set theory permits the gradual assessment of the membership of the ele-ments in relation to a set; this is described with the aid of a membership function
A(x) ! [0; 1]. Fuzzy sets are an extension of classical set theory since, for a
cer-tain universe, a membership function may act as an indicator function, mapping all elements to either 1 or 0, as in the classical notation.
Many problems in management have mainly been studied from optimizing points of view. As the management is much in‡uenced by the disturbance of a social and economical circumstances, optimization approach is not always the best. It is because under such in‡uences, many problems are ill-structured. Therefore, a satisfaction approach may be much better than an optimization one. In this dis-cussion, it is acceptable that the aspiration level on the treated problem is resolved on the base past experiences and knowledge possessed by a decision maker, in the case where the aspiration level of a decision maker should be considered to solve a problem from the perspective of satisfaction strategy. Therefore, it is more natural that the vague aspiration level of a decision maker is denoted as a fuzzy number.
Watada (2001) presented a portfolio selection model using the fuzzy decision principle. The model is directly related to the mean variance model, where the satisfaction degree for an expected return rate and corresponding risk are described by membership functions. The larger the expected return is, the better its portfolio is.
First a decision maker de…nes, for each of an expected return rate and risk, a necessity level which requires all feasible solutions should hold, that is, a minimum requirement and a su¢ ciency level at which a decision maker is satis…ed with a solution. Then membership functions are constructed for each of an expected return
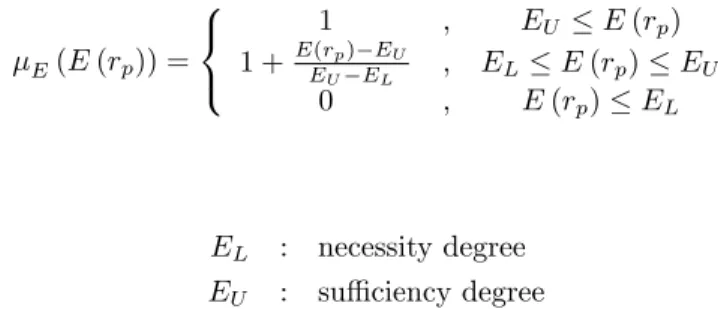
rate and risk. The larger the expected return rate is, the better its portfolio is. The trapezoidal membership function can be de…ned as follows
E(E (rp)) = 8 < : 1 ; EU E (rp) 1 +E(rp) EU EU EL ; EL E (rp) EU 0 ; E (rp) EL (4.1) where; EL : necessity degree
EU : su¢ ciency degree
The trapezoidal membership function of the goal for an expected return rate is given at Figure1.
1
FIGURE 1. The trapezoidal membership function of the goal for an expected return rate (Watada 2001).
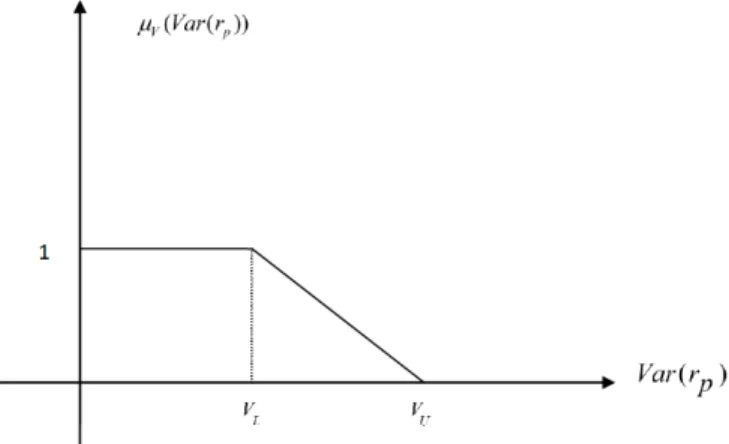
The less the grade of risk, the better its portfolio is. The trapezoidal membership function should be de…ned as
V(V ar (rp)) = 8 < : 1 ; V ar (rp) VU 1 V ar(rp) VU VL VU ; VU V ar (rp) VL 0 ; VL V ar (rp) (4.2) where,
VL : su¢ ciency degree
The trapezoidal membership function of the goal for an expected return rate is given at Figure2.
FIGURE 2. The trapezoidal membership function of the goal for risk Watada (2001).
In terms of Bellman-Zadeh’s maximization principle (Bellman-Zadeh 1970), the two objcetive portfolio selection can be written as a fuzzy multi objective mathe-matical programming problem in the following:
max
E(E (rp)) (4.3)
V (V ar (rp))
0
= min ( E(E (rp)) ; V (V ar (rp))) denotes a membership grade. Substituting
4.1 and 4.2 into 4.3, the following optimization problem is obtained max V ar (rp) + (VL VU) VL E (rp) + (EL EU) EL (4.4) n P i=1 Xi = 1 0 Xi 0 (Watada 2001).
5. Application
During the study,Watada’s Fuzzy Portfolio Selection Model Based on Decision Maker aspiration level was used as a method. As the data set, the 253 daily closing prices of eight securities that cycling in Istanbul Stock Exchange 100 index between the dates 01.06.2009-01.06.2010 were taken (Resource : www.imkb.gov.tr ). The securities taken from the sectors as health, electronic goods, clothing, beverage(cola) , banking, beverage(water), glass, gsm.Returns of the securities were calculated according to the explanation ln( Pt
Pt 1) of the closing prices. Where Ptis de…ned as,
Pt: "closing price of t: day"
Firstly, correlation matrix was obtained concerning with the securities. When the correlation values were examined, it seemed that there were not securities which were related to each other (with 1 correlation value).
Correlation matrix was calculated as,
= 2 6 6 6 6 6 6 6 6 6 6 4 1 0.336 0.334 0.185 0.283 0.295 0.170 0.213 0.336 1 0.327 0.225 0.312 0.305 0.214 0.417 0.334 0.327 1 0.164 0.358 0.421 0.209 0.326 0.185 0.225 0.164 1 0.212 0.239 0.163 0.326 0.283 0.312 0.358 0.212 1 0.338 0.273 0.255 0.295 0.305 0.421 0.239 0.338 1 0.316 0.380 0.170 0.214 0.209 0.163 0.273 0.316 1 0.153 0.213 0.417 0.326 0.326 0.255 0.380 0.153 1 3 7 7 7 7 7 7 7 7 7 7 5
At the next stage, average return vector t, variance covariance matrix S were
cal-culated on the returns. During the calculation, Excel, Minitab and Lingo software programmes were used.
t = 0 .0 0 1 7 5 4 1 5 5 0 .0 0 4 3 3 6 1 6 5 0 .0 0 3 4 0 5 7 7 4 0 .0 0 2 1 2 0 3 0 9 0 .0 0 1 6 0 2 6 2 9 0 .0 0 0 3 2 3 6 8 6 0 .0 0 2 3 0 6 3 6 4 0 .0 0 0 2 7 6 0 4 2 S = 2 6 6 6 6 6 6 6 6 6 6 4 0 .0 0 0 4 6 0 8 2 0 .0 0 0 2 1 3 8 1 0 .0 0 0 8 8 0 6 4 0 .0 0 0 2 2 6 7 7 0 .0 0 0 3 0 7 3 2 0 .0 0 1 0 0 0 3 2 0 .0 0 0 0 9 0 6 3 0 .0 0 0 1 5 2 3 2 0 .0 0 0 1 1 8 2 3 0 .0 0 0 5 2 2 4 6 0 .0 0 0 1 5 0 1 1 0 .0 0 0 2 2 8 6 9 0 .0 0 0 2 7 9 6 8 0 .0 0 0 1 1 9 9 0 0 .0 0 0 6 1 1 3 4 0 .0 0 0 1 3 9 9 7 0 .0 0 0 1 9 9 6 7 0 .0 0 0 2 9 4 5 0 0 .0 0 0 1 2 0 9 2 0 .0 0 0 1 8 4 4 8 0 .0 0 0 4 8 8 2 7 0 .0 0 0 1 1 8 7 0 0 .0 0 0 2 0 7 1 4 0 .0 0 0 2 1 5 3 2 0 .0 0 0 1 2 0 9 7 0 .0 0 0 2 1 9 3 0 0 .0 0 0 2 2 7 3 2 0 .0 0 1 0 5 9 2 6 0 .0 0 0 0 8 5 3 3 0 .0 0 0 2 3 1 4 0 0 .0 0 0 1 9 2 9 9 0 .0 0 0 0 8 6 7 3 0 .0 0 0 1 1 8 0 2 0 .0 0 0 1 5 7 1 1 0 .0 0 0 0 9 2 9 2 0 .0 0 0 3 4 9 5 5 3 7 7 7 7 7 7 7 7 7 7 5 In the study, E (rp) and V ar (rp) and predicted values were used in order to estimate
the Watada’s model EU; EL; VU; VLnecessity and su¢ ciency level. These predicted
portfolio. E (rp) = 1 8(0:001754155 + ::: + 0:000276042) = 0:002016 V ar (rp) = 18 18 S 2 6 4 1 8 .. . 1 8 3 7 5 = 0:000237
Then, being based on these predicted values, for the expected return and variance, the arbitrary necessity and su¢ ciency levels of the decision maker were de…ned and the related membership functions were constructed.In the study these VL; VU and
EL; EU aspiration degress were chosen randomly to be close to the predicted values
of E (rp)and V ar (rp) :
Let’s de…ne EL; EU degress as EL = 0:001 and EU = 0:003 randomly.Under
these values, membership function for portfolio expected return is constructed as;
E(E (rp)) = 8 < : 1 ; 0:001 E (rp) 1 + E(rp) 0:003 0:002 ; 0:001 E (rp) 0:003 0 ; E (rp) 0:004
Let’s de…ne VL; VU degress as VL= 0:0005 and VU = 0:0002 randomly.Under these
values, membership function for portfolio variance is constructed as;
V (V ar (rp)) = 8 < : 1 ; V ar (rp) 0:0002 1 + 0:0002 V ar(rp) 0:0003 ; 0:0002 V ar (rp) 0:0005 0 ; 0:0005 V ar (rp)
The increase or the decrease in the VL; VU and EL; EU values in‡uences the optimal
solution. The changes may cause increase or dicrease at the expected portfolio return and the portfolio variance. To give an example;when VL and VU degress
are taken as VL = 0:0006 and VU = 0:0003, the portfolio variance is calculated as
V ar (rp) = 0:000339:
The problem (5.1) was formed by replacing input values in Watada model (4.4). max V ar (rp) + 0:0003 0:0005 E (rp) 0:002 0:001 (5.1) 8 P i=1 Xi = 1 0 Xi 0; i = 1; :::; 8
6. Results
By solving the problem (5.1), weights and membership degree were obtained as
TABLE 1. Membership degree and weights of each security obtained by solving the problem (5.1)
X1 X2 X3 X4 X5 X6 X7 X8
0.80 0.2075 0.2136 0.1124 0.2846 0.0623 0.0000 0.0950 0.0243 Based on these weights,
= min ( E(E (rp)) ; V (V ar (rp))) = 0:80
E (rp) = 0:0026
V ar (rp) = 0:000256
were calculated.
TABLE 2. Membership degree and weights of each security in the situation that
VL= 0:0006 and VU = 0:0003 (6.1) X1 X2 X3 X4 X5 X6 X7 X8 0.98 0.1506 0.3079 0.1562 0.2803 0.0846 0 0.0963 0 = min ( E(E (rp)) ; V (V ar (rp))) = 0:98 E (rp) = 0:003 V ar (rp) = 0:000339
In the Classical Markowitz Model, for = 0:001 the solution was obtained as TABLE 3.The solution for the Classical Markowitz Model ( =0.001)
X1 X2 X3 X4 X5 X6 X7 X8
0.2238 0 0 0.2010 0.0931 0.0934 0.0567 0.3318 E (rp) = 0:001221
V ar (rp) = 0:000183
7. Conclusion
When the Table 1 is examined, it is seems that the investor should invest approx-imately %20.75 of his money in 1st security, %21. 36 of his money in 2nd security %11.24 of his money in 3 security, %28.46 of his money in 4th security, %6.23 of his money in 5th security, %9.50 of his money in 7th security and %2.43 of his money in 8th security.
According to these obtaining weights , the expected portfolio return was calcu-lated as E (rp) = 0:0026, the portfolio variance was obtained as V ar (rp) = 0:000256
The aim function value = min ( E(E (rp)) ; V (V ar (rp))) = 0:80 shows that,
the model is successful about maximizing the membership degree. It seems that the aspiration level has been formed with a high membership degree so a successful portfolio has been formed.
It can be said that; applying the Fuzzy Method on the IMKB data set can be accepted as innovation and originality.
If we need to compare the solution of Watada Fuzzy Model with the solution of Markowitz Classical Model, it is observed that the expected return of the WFM is larger than the MCM return.At the same time, its variance is larger than the MCM variance. The risk aversion investor should prefer the Markowitz Classical Model.
Anahtar Kelimeler: Portföy analizi, portföy riski, beklenen getiri, bulan¬k küme, bulan¬k portföy seçimi.
References
[1] Bellman, R.E., Zadeh, L.A. 1970. Decision making in a fuzzy environment, Management Science 17, B141-B164.
[2] Fabozzi, F., Kolm, P., Pachamanova, D., Focardi, S. 2007. Robust Portfolio Optimization and Management, Wiley.
[3] *Huang,.X. 2007. A new perspective for optimal portfolio selection with random fuzzy returns. Information Sciences, 5404-5414.
[4] **Huang,.X. 2007. Portfolio selection with fuzzy returns. Journal of Intelligent and fuzzy systems-IOS Press.
[5] Hasuike, T., Katagiri H., Ishii H. 2009. Portfolio selection problems with random fuzzy vari-able returns. Fuzzy Sets and Systems, 2579-2596.
[6] Lai, Y.J, Hwang, C.L. 1992. Fuzzy Mathematical Programming (Methods and Applications), Springer-Verlag Berlin, Germany.
[7] Markowitz, H.M., 1952. Portfolio Selection. The Journal of Finance. New york, 77-91. [8] Tanaka, H., Guo, P., 1998. Possibilistic Data Analysis for Operation Research.
[9] Tanaka, H., Guo, P. and Turksen, I.B. 2000. Portfolio selection based on fuzzy probabilities and possibility distributions. Fuzzy Sets and Systems, 111, 387-397.
[10] Wang, S. and Zhu, S. 2002. On Fuzzy Portfolio Selection Problems.Fuzzy Optimization and Decision Making, 1, 361-377.
[11] Watada, J., 2001. Fuzzy portfolio model for decision making in investment, Dynamical As-pects in Fuzzy Decision Making, 141-162, Physica-Verlag, Heidelberg.
[12] Zadeh, L.A. 1962. From circuit theory to system theory, Proceedings of Institute of Radio Engineering 856-865.
[13] Zadeh, L.A. 1965. Fuzzy Sets, Information and Control 8, 338-353.
Current address : Ankara University Faculty of Science, Department of Statistics, Ankara, Turkey
E-mail address : [email protected], [email protected] URL: http://communications.science.ankara.edu.tr/index.php?series=A1