125
Empirical Analysis of Weak Form Efficiency Evidence from National
Stock Exchange of India Ltd
S. Ayyappan
aS. Nagarajan
bM.Sakthivadivel
cK. Prabhakaran
da
Sakthi Institute of Information and Management Studies , Pollachi.
b
SNS College of Engineering, Tamil Nadu, Coimbatore.
c
Mahalingam college of engineering and Technology, Pollachi
d
RVS Faculty of Management, Coimbatore.
Abstract
The stock market is an emerging area for research and this work analysis the efficiency of National Stock Exchange of India Ltd (NSE) and focuses on Board Indices and CNX Nifty. The National Stock Exchange of India Ltd has five indices like Broad Market Indices, Sectoral Indices, Thematic Indices, Strategy Indices and Customised Indices. The main objective of is to find out efficiency level and random walk nature of National Stock Exchange of India Ltd by testing Broad Indices of the National Stock Exchange of India Ltd with the help of Descriptive Statistics, Runs Test, and Augmented Dickey Fuller test (ADF) for the Indices return during the year Jan 2008 to Jan 2013. The result found that the linear dependence is existed in the NSE (Broad Market Indices) returns and it is determined from the analysis that the Broad Market Indices in National Stock Exchange India Ltd is not weak-form efficient.
Keywords: Market Efficiency, NSE, Runs Test, Autocorrelation, ADF.
© 2013 Beykent University
1. Introduction
The two fold changes have made pavement for remarkable growth and development of Indian economy. They are Information Technology and Economic liberalisation policy. The developments in Information Technology have provided enormous opportunity to facilitate trading process between investor and Industry. The Economic Liberalisation in India was introduced in India during the early 1980 and it was improved much in mid-eighties. The Balance of Payment (BOP) crisis was faced by India in 1991 that had led to pledge gold to foreign countries and the Economic Liberalisation is also providing various reforms in India from 24 July, 1991.
126
The economic liberalisation policy includes salient features like Liberalisation, Privatisation and Globalisation (LPG). It is offering more freedom to the service sector that has enabled more contributions to GDP growth because of more service imports and also generating foreign exchange.
The Pokhran – II a bomb test explosion has received the global attention towards India and was also supported for the growth of India because of credit rating by Moody’s. It is also increased the investment level of CNX Nifty in 2003. The Exchange Traded Funds (1989), Liberalised Remittance Scheme (2004) etc., were contributed for the growth of India. We can say that 2003 to 2007 was the golden period of Indian Stock Market after liberalisation. In 2010 India was in 124th rank out of 174 countries in Index of Economic Freedom World Rankings. Recently in 2012 the Foreign Direct Investment of 51% in retail sector was approved by Indian Government.
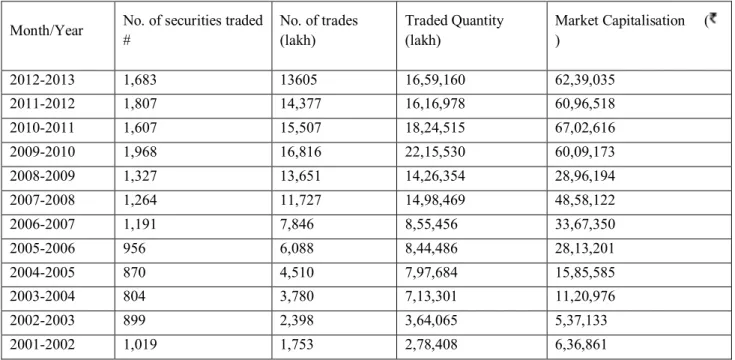
The research work which was published in XIMB Journal of Management (2006) by J. K. Nayak, entitled on “Analysis of Indian Capital Market: Pre and Post Liberalization”. has clearly witnessed that there was an evidence of growth in Indian Capital Market after the introduction of liberalisation policy in India. The year wise growth of Indian Capital Market is clearly understood by viewing following table.
Table 1: Business Growth in Capital Market Segment
Month/Year No. of securities traded # No. of trades (lakh) Traded Quantity (lakh) Market Capitalisation ( ) 2012-2013 1,683 13605 16,59,160 62,39,035 2011-2012 1,807 14,377 16,16,978 60,96,518 2010-2011 1,607 15,507 18,24,515 67,02,616 2009-2010 1,968 16,816 22,15,530 60,09,173 2008-2009 1,327 13,651 14,26,354 28,96,194 2007-2008 1,264 11,727 14,98,469 48,58,122 2006-2007 1,191 7,846 8,55,456 33,67,350 2005-2006 956 6,088 8,44,486 28,13,201 2004-2005 870 4,510 7,97,684 15,85,585 2003-2004 804 3,780 7,13,301 11,20,976 2002-2003 899 2,398 3,64,065 5,37,133 2001-2002 1,019 1,753 2,78,408 6,36,861
# w.e.f. January 2005, No. of securities are provided instead of Number of Companies.
Source: www.nseindia.com
This is a puzzle for a common investor to understand how market is reacting based on outsiders’ information (i.e. the news from various Medias, Financial announcement by companies or big players in the market). When a market is having insiders trading that will lead to increase the volatility of the market. It is essential to know whether market is
127
reacting according to the outsiders’ information or not. We are able to test the Market Efficiency viz., Efficient Market Hypothesis (EMH) or Joint Market Problem (JMP).
Eugene Fama (1960) has introduced three different forms of efficiency. They are a) Weak form Efficiency b) Semi-strong Efficiency c) Strong form Efficiency.
Weak form Efficiency has been understood as the future prices cannot predicted by using past price. If the asset prices do not have “Patterns” then it means that the price must follow random walk. In an in-efficient market the investor will not able to book profits more than the market return. If it is the case then short term traders may book profits. In Semi-strong form Efficiency the share prices are adjusted based on new information. So the investor is not able to earn more than the market return because the price is not only depending on past price but also the information regarding corporate announcement, dividend, bonus issue, rights issue etc., these movements will revert back to the customary level after some point of time. In case of Strong form Efficiency the share prices are not able to predict via past price and changes in the past price. It is known as Insiders Trading. This was empirically tested through the study by Eugene F. Fama, Lawrence Fisher, Michalel C. Jensen and Richardroll, entitled on “The Adjustment of Stock Prices to new Information” (International Economic Review; Vol. 10, February, 1969). It was also witnessed that the stock price has immediately reacting regard to share split and it was concluded that the stock market adjusted rapidly to new information.
Pandey Ajay (2005) reported the empirical performance of various unconditional volatility estimators and conditional volatility models by using S&P CNX Nifty, India. The results indicated, that the conditional volatility models provide less biased estimates, extreme-value estimators are more efficient estimators of realized volatility. As far as forecasting ability of models is concerned, conditional volatility models fare extremely poorly in forecasting five-day (weekly) or monthly realized volatility. In contrast, extreme value estimators, other than the Parkinson estimator, perform relatively well in forecasting volatility over these horizons.
Barman and Samanta (2006) in their study examined the EMH in Indian market and explained that the study finding do not support the EMH and volatility test also exhibits the prances of excess volatility in the return series. The study also accepted that the hypothesis of no integration between real price and real dividends series indicating the lack of market efficiency.
MadhuriMalhotra, M. Thenmozhi, G Arun Kumar (2007), in their paper titled “Stock Market Reaction and Liquidity Changes around Bonus Issue Announcement: Evidence from India” by (2007), examined share price reaction to the announcement of bonus issue for a sample of Indian companies. Standard event study methodology has been used for the purpose of studying the Bonus issue announcement reaction. Bonus issue announcement yields negative abnormal returns around the announcement date. There is a negative reaction after the bonus issue announcement conveying that the market under reacts after the announcement. It is also observed that there is no information leakage prior to the announcement.
128
S.V. Ramana Rao & Naliniprava Tripathy (2008) in their study considered Indian stock market is being regarded as the barometer of the health of the economy. The study concluded that the market would react very sharply to economic, political and policy issues. Hence the market participants should be taken care of their portfolio while investing in these volatile months. Dr S.M.Tariq Zafar (2009) in his study attempted to measure the efficiency of Indian stock market in terms of risk and return relationship and the effect of diversification and found that holding risky stocks in portfolio for longer time horizon investor do not realize maximum return in trading but up to some extent they reduce the impact of nonmarket risk of the portfolio and also revealed that portfolios with high beta value are categorized as high risky class and portfolios with low beta value are categorized as low-risky. They get the high return by holding risky portfolio on daily basis. This trend of stock market signifies effect that investor gradually readjust their holdings of stocks in response to market or nonmarket ever.
3. Research Methodology
To investigate the effectiveness of Weak form Efficiency in Indian Stock Market through some statistical tools and econometrics tools. The sample has been derived from the National Stock Exchange India Ltd (NSE). The sample includes the indices value of the following indices from Broad Market indices.
3.1 Basic Indices
A stock market index is created by selecting a group of stocks that are representative of the whole market or a specified sector or segment of the market. An Index is calculated with reference to a base period and a base index value. An Index is used to give information about the price movements of products in the financial, commodities or any other markets. Financial indexes are constructed to measure price movements of stocks, bonds, T-bills and other forms of investments. Stock market indexes are meant to capture the overall behaviour of equity markets
Indian capital market is divided in two types. They are Primary market and Secondary market. In India’s concern BSE and NSE are the main players in Indian Capital Market.
National Stock Exchange India Ltd: The National Stock Exchange India Ltd was incorporated in November 1992. NSE has a leading stock exchange in India with modern techniques, coverage (located more than 1500 cities across the country), safety, speed and efficiency.
The NSE has two segments a) Capital Market Segment b) Wholesale Debt-Market Segment. The capital market segments consists of equities, convertible and non-convertible debentures.
The wholesale Debt-Market segment has high value transactions in G-Sec, PSU bonds, Commercial Papers and other debt instruments. NSE is ranked as 11th largest stock exchange in the world based on market capitalisation.
129 3.2 Broad Market Indices
These indices are broad-market indices, consisting of the large, liquid stocks listed on the Exchange. They serve as a benchmark for measuring the performance of the stocks or portfolios such as mutual fund investments.
Table 2: The List of Broad Market Indices
CNX Nifty CNX Nifty Junior LIX 15
CNX 100 CNX 200 CNX 500
Nifty Midcap 50 CNX Midcap CNX Smallcap
India VIX Source: www.nseindia.com
3.3. Sectoral Indices
Sector-based index are designed to provide a single value for the aggregate performance of a number of companies representing a group of related industries or within a sector of the economy.
3.4. Thematic Indices
Thematic indices are designed to provide a single value for the aggregate performance of a number of companies representing a theme.
3.5. Strategy Indices
Strategy indices are designed on the basis of quantitative models / investment strategies to provide a single value for the aggregate performance of a number of companies.
3.6. Objectives of the Study and Data Analysis
To examine the random walk hypothesis in Broad Market Indices of NSE. To test the weak form efficiency in NSE with reference to Board Market Indices. To provide suggestions for the policy makers, academicians and research community.
130 3.7 Sample selection
Broad indices are main indices with large no of liquid stocks listed in National Stock Exchange India Ltd (NSE). For the purpose of analysis, nine indices from broad market indices have been chosen. The daily data for LIX 15, CNX 200, Nifty Midcap and CNX Smallcap were collected based on its availability and 10 years daily data have been collected for remaining indices like CNX Nifty, CNX Nifty Junior, CNX 100, CNX 500 and CNX Midcap. The list of samples drawn from Broad Market Indices are
CNX Nifty, CNX Nifty Junior, LIX 15, CNX 100, CNX 200, CNX 500, Nifty Midcap 50, CNX Midcap, CNX Smallcap
CNX Nifty: The CNX Nifty is a well diversified 50 stock index accounting for 22 sectors of the economy. It is used for a variety of purposes such as benchmarking fund portfolios, index based derivatives and index funds. CNX Nifty is owned and managed by India Index Services and Products Ltd Which is a joint venture between NSE and CRISIL. IISL is India's first specialised company focused upon the index as a core product.
CNX Nifty Junior: The next rung of liquid securities after CNX Nifty is the CNX Nifty Junior. It may be useful to think of the CNX Nifty and the CNX Nifty Junior 100 most liquid stocks in India.
LIX 15:LIX 15 Index is designed to provide exposure to the liquid stocks while making the index easily replicable and tradable. In order to make the index easily replicable and tradable, criteria’s such as minimum turnover ratio and free float market capitalization are applied while selection of stocks. The index constitutes only 15 stocks with maximum weight of single stock capped at 15%.
CNX 100: CNX 100 is a diversified 100 stock index accounting for 38 sectors of the economy. CNX 100 is owned and managed by India Index Services & Products Ltd. (IISL).
CNX 200: The CNX 200 Index is designed to reflect the behaviour and performance of the top 200 companies measured by free float market capitalization. It comprises of 200 such companies that are listed on the National Stock Exchange (NSE).
CNX 500: The CNX 500 is India’s first broad based benchmark of the Indian capital market. The CNX 500 Index represents about 95.76% of the free float market capitalization of the stocks listed on NSE as on June 28, 2013. The total traded value for the last six months ending June 2013 of all Index constituents is approximately 95.05% of the traded value of all stocks on NSE.
Nifty Midcap 50: The medium capitalized segment of the stock market is being increasingly perceived as an attractive investment segment with high growth potential. The primary objective of the Nifty Midcap 50 Index is to capture the movement of the midcap segment of the market. It can also be used for index-based derivatives trading.
131
CNX Midcap: The medium capitalised segment of the stock market is being increasingly perceived as an attractive investment segment with high growth potential. The primary objective of the CNX Midcap Index is to capture the movement and be a benchmark of the midcap segment of the market.
CNX Smallcap: The CNX Smallcap Index is designed to reflect the behaviour and performance of the small capitalised segment of the financial market. It comprises of 100 tradable, exchange listed companies.
3.8. Source of the Data
The National Stock Exchange India Ltd (NSE) operates from Monday to Friday. The sample includes daily closing indices value of five Indices from 1st April 2003 to 31st March 2013 for CNX Nifty, CNX Nifty Junior, CNX 100, CNX 500 and CNX Midcap. The availability of data was taken into consideration for LIX 15, CNX 200, Nifty Midcap and CNX Smallcap. All the data’s were extracted from National Stock Exchange India Ltd (NSE).
3.9 Test Hypothesis
H0: Broad Indices follow random walk, thus weak-form efficient.
H1: Broad Indices do not follow random walk, thus weak-form inefficient.
4. Application of the Model
In order to examine the hypothesis, we have used following statistical and econometrics tools based on existing literature and the collected data are converted into Natural Logarithm for better use of following tools
Descriptive Statistics Runs Test and
Augmented Dickey Fuller Test (ADF) 4.1. Descriptive Statistics
Descriptive statistics is used to explain the basic characteristics of the data in a study with the help of Mean, Median, Mode, Standard Deviation, Skewness and Kurtosis etc.. Descriptive statistics help us to simply large amounts of data in a sensible way and present quantitative descriptions in a manageable form. Each descriptive statistic reduces lots of data into a simpler summary.
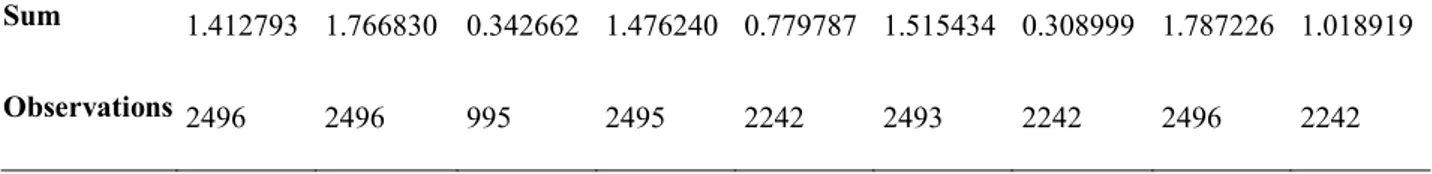
Preliminary analysis was performed before applying the tests of linear dependence in order to get an insight into the important features of the series returns. Table 3 reports a summary of the preliminary statistics for the return series of each constituent. As can be seen from the table, the entire sample has the same stylised characteristics. All the series are Leptokurtic, since the value of Kurtosis for all which are greater than the value for standard normal distribution’s leptokurtosis. Moreover, asymmetry can be found in every series, as their Skewness values are different from zero. Given the previous features, Jarque-Bera’s test statistic, which is a test of whether the series distribution is normal, is
132
strongly significant for all constituents, which implies that normality is rejected even at 5% significance level. The result proved that equity market returns are non-normally distributed.
Table 3 Descriptive Statistics CNX NIFTY CNX Nifty Junior LIX15 CNX 100 CNX 200 CNX 500 Nifty Midcap 50 CNX Midcap CNX Smallcap Mean 0.000566 0.000708 0.000344 0.000592 0.000348 0.000608 0.000138 0.000716 0.000454 Median 0.001370 0.002126 0.000330 0.001620 0.001535 0.001822 0.001994 0.002451 0.002335 Maximum 0.150700 0.129122 0.168791 0.147359 0.143439 0.139584 0.122755 0.108255 0.085038 Minimum -0.139442 -0.140348 -0.082431 -0.139391 -0.139020 -0.137516 -0.175914 -0.137717 -0.137487 Std. Dev. 0.016535 0.018227 0.016608 0.016508 0.016467 0.016126 0.019071 0.015971 0.016255 Skewness -0.529934 -0.918486 1.020794 -0.607848 -0.727482 -0.761614 -1.052443 -1.168653 -1.390823 Kurtosis 11.90557 10.76412 14.13713 11.87245 12.67930 11.90653 11.80173 11.80011 11.93691 Jarque-Bera 8364.981 6620.233 5315.111 8337.283 8949.851 8481.028 7650.921 8622.112 8183.855 Probability 0.000000* 0.000000* 0.000000* 0.000000* 0.000000* 0.000000* 0.000000* 0.000000* 0.000000* Sum 1.412793 1.766830 0.342662 1.476240 0.779787 1.515434 0.308999 1.787226 1.018919 Observations 2496 2496 995 2495 2242 2493 2242 2496 2242
* represents significant in 1% level. 4.2 Runs Test
The Runs test is also called as Wald-Wolfowitz test. It is a non-parametric test, checks randomness of data. A run is a sequence of identical occurrences preceded and followed by different occurrences or by none at all. To check predictability of future share price movements based on historical data. Runs test is most commonly adopted form of empirical test (Cuthbert son, 1996). Runs test have two parameters namely a) Length b) Type of run. Length is a parameter of runs test which often occurred in previous price. Runs have two types which are Positive and Negative. Numbers of runs are less than the expected; this is evidence for strong positive correlation or serial correlation or auto correlation.
133
Most of the Empirical evidences have found in this aspect based on earlier reviews for the usage of runs test. They are as follows, Fama (1965), Sharma and Kennedy (1977), Cooper (1982), Chiat and Finn (1983), Wong and K.Wong (1984), Yalawar (1988), KO and Lee (1991), Butter and Malaikah and Thomas (1995). From these findings null hypothesis was not rejected in most countries except India, Hong Kong, Kuwait and Saudi Arabia. Runs test can be computed by using following formula for mean equation
………..………(1)
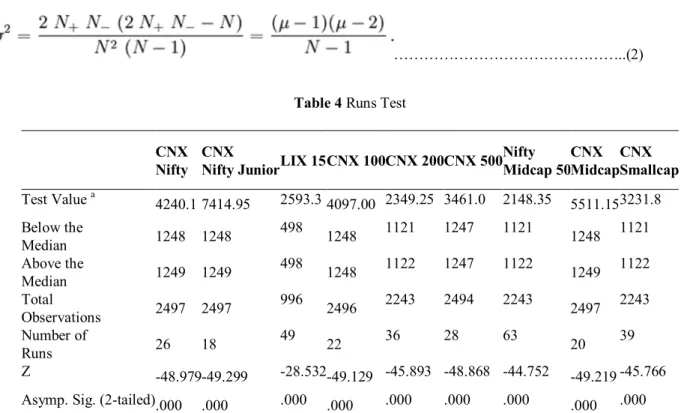
The formula for calculating variance
………..(2)
Table 4 Runs Test
CNX Nifty
CNX
Nifty JuniorLIX 15 CNX 100CNX 200CNX 500
Nifty Midcap 50 CNX Midcap CNX Smallcap Test Value a 4240.1 7414.95 2593.3 4097.00 2349.25 3461.0 2148.35 5511.15 3231.8 Below the Median 1248 1248 498 1248 1121 1247 1121 1248 1121 Above the Median 1249 1249 498 1248 1122 1247 1122 1249 1122 Total Observations 2497 2497 996 2496 2243 2494 2243 2497 2243 Number of Runs 26 18 49 22 36 28 63 20 39 Z -48.979-49.299 -28.532 -49.129 -45.893 -48.868 -44.752 -49.219 -45.766 Asymp. Sig. (2-tailed).000 .000 .000 .000 .000 .000 .000 .000 .000 a. Median
The analysis of the runs test for all sample constituents is reported in Table 4. As can be noted from the table, the Z-statistics of the runs test of serial independence are significant at the one percent level for all indices which we have taken for study. The significant negative Z-values for the returns indicate that the actual number of runs is less than the expected number of runs under the null hypothesis that returns are independent. In our case, the null hypothesis of returns independence has been rejected for the entire sample which implies that there is linear dependence in Broad Market Indices.
134
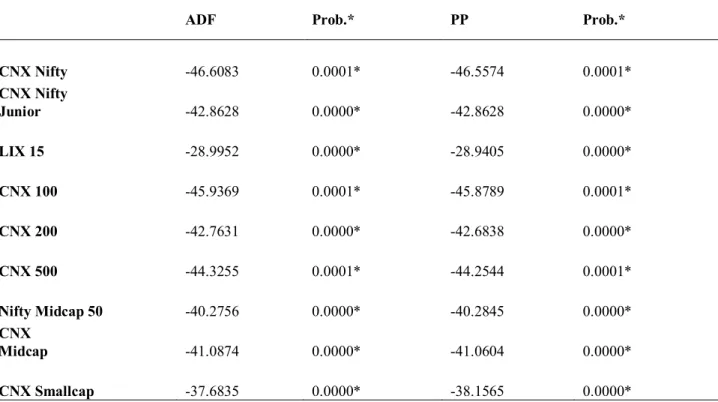
Table 5:Unit Root Test
ADF Prob.* PP Prob.*
CNX Nifty -46.6083 0.0001* -46.5574 0.0001* CNX Nifty Junior -42.8628 0.0000* -42.8628 0.0000* LIX 15 -28.9952 0.0000* -28.9405 0.0000* CNX 100 -45.9369 0.0001* -45.8789 0.0001* CNX 200 -42.7631 0.0000* -42.6838 0.0000* CNX 500 -44.3255 0.0001* -44.2544 0.0001* Nifty Midcap 50 -40.2756 0.0000* -40.2845 0.0000* CNX Midcap -41.0874 0.0000* -41.0604 0.0000* CNX Smallcap -37.6835 0.0000* -38.1565 0.0000*
* represent stationary in level with Intercept.
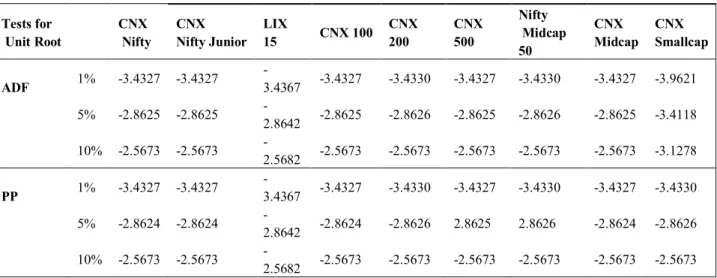
In order to apply unit root tests, optimal lag length should be first determined. Hannan and Quinn (1979) information criterion (HQIC) have been used to select the optimal lag length in ADF unit root test. The null hypothesis of ADF and PP unit root tests is that the time series has unit root (not stationary), and the alternative hypothesis is that the series is stationary. Therefore, to have stationary series test statistics of ADF and PP should be significant.
Table 5 reports the resulting test statistics of unit root tests ADF and PP. The unit root tests were employed on the first difference of the natural logarithm of each series, with constant term and no time trend. Table 6 presents test critical values in all significant levels. From the tables, ADF and PP unit tests resulted with strong evidence of stationary in all series at one and five significant levels. Generally speaking, one would conclude that returns in Broad Market Indices are stationary.
135
Table 6 - Test Critical Values
Tests for Unit Root CNX Nifty CNX Nifty Junior LIX 15 CNX 100 CNX 200 CNX 500 Nifty Midcap 50 CNX Midcap CNX Smallcap ADF 1% -3.4327 -3.4327 -3.4367 -3.4327 -3.4330 -3.4327 -3.4330 -3.4327 -3.9621 5% -2.8625 -2.8625 -2.8642 -2.8625 -2.8626 -2.8625 -2.8626 -2.8625 -3.4118 10% -2.5673 -2.5673 -2.5682 -2.5673 -2.5673 -2.5673 -2.5673 -2.5673 -3.1278 PP 1% -3.4327 -3.4327 -3.4367 -3.4327 -3.4330 -3.4327 -3.4330 -3.4327 -3.4330 5% -2.8624 -2.8624 -2.8642 -2.8624 -2.8626 2.8625 2.8626 -2.8624 -2.8626 10% -2.5673 -2.5673 -2.5682 -2.5673 -2.5673 -2.5673 -2.5673 -2.5673 -2.5673 5. Conclusion
The weak-form efficiency has been widely investigated in both developed and developing markets. This research examined the existence of the random walk hypothesis (RWH) by testing the weak-form efficiency in the National Stock Exchange India Ltd returns using parametric and nonparametric linear tests. The data included the daily closing indices values of all broad market indices in National Stock Exchange India Ltd was taken to investigate Samuelson’s dictum that the efficient markets hypothesis works much better for individual stocks than it does for the aggregate stock market index.
The results obtained from the linear serial dependence tests indicate that linear dependence is existed in the NSE (Broad Market Indices) returns. Thus, based on the first hypothesis of this study the null hypothesis has been rejected, and we concluded that the Broad Market Indices in National Stock Exchange India Ltd is not weak-form efficient. However, the existing or rejection of linear serial dependence does not necessarily mean that nonlinearity exists. Nonetheless, the NSE needs to be studied further with different samples, time series, and other tests to verify market efficiency and day-of-the-week effect.
References
Abraham, A., Seyyed, F. J & Alsakran,S. A. (2002). Testing the Random Walk Behavior and Efficiency of the Gulf Stock Markets. The Financial Review, vol. 37, no.3,. 469-480.
Amalendu Bhunia. (2012). Stock Market Efficiency in India: Evidence from India. Universal Journal of Marketing and Business Research, Vol 1, 72 – 78.
136
Amihud, Y & Mendelson H. (1987). Trading Mechanisms and Stock Returns: An Empirical Investigation. The Journal of Finance, Vol. 42, No. 3, 533-553.
Ananthi, M & Dinesh. S. (2012). Testing the Semi-Strong form Efficiency of Indian Stock Market with respect to the Information content of Profit Booking Announcement. International Journal of Multidisciplinary Research, Vol. 2, Issue 1, 137 – 148.
Bharath, M & Shankar. H. (2012). Market Efficiency of Indian Stock Market – A Study of Bonus Announcement in Bombay Stock Exchange. Indian Journal of Applied Research, Vol. 2, No. 1 45 – 49.
Divyang J Joshi. (2012). Testing Market Efficiency of Indian Stock Market. International Journal of Scientific and Research, Vol. 2, Issue 6, 1 – 4.
Khan, A. Q., & Sana Ikram. (2010). Testing Semi-Strong Form of Efficient Market Hypothesis in Relation to the Impact of Foreign Institutional Investors’ (FII’s) Investments on Indian Capital Market. International Journal of Trade, Economics and Finance, Vol.1, No.4, 373 – 379.
Mayowa Gabriel Ajao., & Richard Osayuwu. (2012). Testing the Weak Form of Efficient Market Hypothesis in Nigerian Capital Market. Accounting and Finance Research. Vol. 1, No. 1, 169 – 179.
Nikunj R. Patel., Nitesh Radadia & Juhi Dhawan. (2012). An Empirical Study on Weak-Form of Market Efficiency of Selected Asian Stock Markets. Journal of Applied Finance & Banking. vol.2, no.2, 98 – 148.
Pandey, I. M. (2010). Financial Management. New Delhi, India. Vikas Publishing House Pvt Ltd.
Prashant Joshi. (2008). Market Integration and Efficiency of Indian Stock Markets: A Study of NSE. NSE Working paper.
Punithavathy Pandian. (2009). Security Analysis and Portfolio Management. New Delhi, India. Vikas Publishing House Pvt Ltd.
Sunil Poshakwale. (1996) Evidence on Weak form Efficiency and Day of the Week Effect in Indian Stock Market. Finance India, Vol. X, No. 3, 605. 616.
Tariq Zafar, S. M. (2012). A Systematic Study to Test the Efficient Market Hypothesis on BSE Listed Companies before Recession. International Journal of Management and Social Sciences Research (IJMSSR)Vol. 1, No. 1, 37 – 48.
Terence Tai-Leung Chong., Sam Ho-Sum Cheng., & Elfreda Nga-Yee Wong. (2010). A Comparison of Stock Market Efficiency of the BRIC Countries. Technology and Investment, 2010, Vol 1, 235 – 238.
Kinjal Jethwani & Sarla Achuthan. (2013). Stock Market Efficiency and Crisis: Evidence from India. Asia-Pacific and Accounting Review, Vol. 1, No. 2, pp 38 – 43.
137
Sajeela Rabbani., Nida Kamal., & Mahwash Salim. (2013). Testing the Weak-Form Efficiency of the Stock Market: Pakistan as an Emerging Economy. Journal of Basic and Applied Scientific Research, Vol. 3, No. 4, pp 136 – 142.