Research Article
A Comparative Holistic Fuzzy Approach for
Evaluation of the Chain Performance of Suppliers
Ergün Eraslan
1and Kumru Didem Atalay
21Department of Industrial Engineering, Yildirim Beyazit University, Cicek Sk. No. 3 Ulus, 06030 Ankara, Turkey 2Department of Medical Education, Baskent University, Bahcelievler, 06450 Ankara, Turkey
Correspondence should be addressed to Erg¨un Eraslan; [email protected] Received 19 April 2014; Accepted 16 June 2014; Published 10 July 2014
Academic Editor: Ferenc Hartung
Copyright © 2014 E. Eraslan and K. D. Atalay. This is an open access article distributed under the Creative Commons Attribution License, which permits unrestricted use, distribution, and reproduction in any medium, provided the original work is properly cited.
The competition between the companies in the dynamic market conditions has made the Supply Chain Management (SCM) a more important issue. The companies which have organized their supply chain effectively have obtained more flexibility in their manufacturing processes in addition to delivery of the customer demands. In this study, two different multicriteria decision making algorithms composed of the FAHP and a holistic hybrid method using FTOPSIS were utilized for an electronic company in wholly fuzzy processes. The FAHP is used for determination of the global weights of the factors and the performances of alternative suppliers are evaluated by using both FAHP-based and FAHP-FTOPSIS hybrid methods for synthetic extent values of pairwise comparisons. The sequences of the suppliers differed for the algorithms. The performances of the proposed approaches are quite successful and flexible in a narrow interval. The managerial advantages obtained from the proposed fuzzy algorithms are also analyzed and interpreted.
1. Introduction
The aim of a manager is to efficiently transport the products and services to the customer in a Supply Chain Management (SCM) system. Ensuring continuity and comparative degree for the administration is only possible by supplying and using the resources with high productivity, high quality, and low price. The administration has to realize flexible manufacturing and effective management for the supply chain from manufacturer to the final customer in order to compensate for the changing customer demand in a highly competitive environment.
In recent years, the integration of management functions within the borders of the administration is inadequate in terms of competition. Hence, the integration and effective management of activities beyond administration in the chain are quite necessary. Furthermore, the competition of supply chains has become much more important than the competi-tion of the firms themselves. SCM is getting more important to accomplish this integration for fast and flexible covering of changeable customer necessities.
A supply chain can be described as a network used to supply necessary materials for manufacturing and service, to transform these to final products, and to transport the final products to the customers (e.g., suppliers, factories, warehouses, and distribution depots). A supply chain also
offers different alternatives for distribution of products [1].
There exist a wide variety of definitions for SCM. For instance,
Ellram [2] described the SCM as an integrated management
approach which consists of planning and controlling material flow from supplier to customer. The experts of logistics see SCM as a management method for external flow of knowledge and inventory of the company.
Although SCM systems are quite important for the companies, enough importance is not given to the measure-ment and evaluation of performance of these processes. The existing research only focuses on the company’s performance in market or the purchaser-seller relationship instead of
the suppliers in whole system [3]. Holmberg’s “cycle of
supply chain measurement system improvement” model is the first research directly related to the improvement of a measurement system for interorganizations’ supply chain
Volume 2014, Article ID 109821, 9 pages http://dx.doi.org/10.1155/2014/109821
performance [4]. The most common model for improvement approaches to performance measurement systems is the
Balanced Score Card [5]. Brewer and Speh used this model
for SCMs performance measurement systems [6]. Matthew
and Miller worked on an improvement for a model with
Activity Based Costing model [7]. Chan investigated the
supply chain performance under qualitative and quantitative
criteria [8]. Apart from the common criteria such as cost and
quality, five other qualitative measurements are defined in the study such as resource utilisation, flexibility, visibility, trust, and innovativeness. Wei et al. presented a comprehensive framework with three main phrases to select an adequate SCM project that incorporates the strategies and operating
routines of the supply chain [9]. Guneri et al. developed an
integrated fuzzy and linear programming approach to the
supplier selection problem [10]. Napalkova and Merkuryeva
discussed two-phase optimization method based on hybrid combination of compromise programming, evolutionary computation, and response surface-based methods to
bal-ance optimal product demand and supply [11]. Chen et al.
proposed a new integrated model by combining 𝐾-means
clustering, feature selection, and the decision tree method into a single evaluation model to assess the performance of
suppliers [12]. Che et al. developed a decision methodology
for supply chain planning, taking into account such four criteria as cost, quality, delivery, and supplier relationship management and considering quantity discount and capacity constraints using analytic network process and turbo particle
swarm optimization [13]. Rouyendegh and Erkan provided a
guideline for establishing supplier selection criteria in respect
to purchasing activities [14].
The evaluation of the performances of suppliers is the most important phase in SCM system. The phase can be described as a multicriteria decision problem regarding several factors in evaluation processes. The multi-criteria decision analysis (MCDA) for structuring these decision problems and evaluation of alternative suppliers provides a rich collection of methods. However, MCDA methods are often criticized because of their inability to handle the uncertain and imprecise problems. Thus, the fuzzy decision making was proposed as a powerful tool. Human has good ability in qualitative data processing which helps him/her to
make decisions in fuzzy environment [15].
Fuzzy sets and fuzzy logic are powerful mathematical tools for modeling uncertain systems in industry, nature, and humanity and facilitators for common sense reasoning in decision making in the absence of complete and precise
information [16]. Zadeh introduced the fuzzy set theory to
deal with uncertainty due to imprecision and vagueness [17].
A major contribution of fuzzy set theory is its capability of representing vague data.
The fuzzy analytical hierarchy process (FAHP) and the fuzzy technique for order preference by similarity to ideal solution (FTOPSIS) methods are commonly used to address the multicriteria decision problems. The first study of FAHP is proposed by van Laarhoven and Pedrycz which compared fuzzy ratios described by triangular fuzzy numbers (TFNs)
[18]. Buckley determines fuzzy priorities of comparison
ratios whose membership functions trapezoidal [19]. Chang
introduces a new approach for handling FAHP with the use of TFNs for pairwise comparison scale of FAHP and the use of the extent analysis method for synthetic extent values of
pairwise comparisons [20]. Cheng proposes a new algorithm
for evaluating naval tactical missile systems by the FAHP
based on grade value of membership function [21]. Zhu et
al. discuss extent analysis method and applications of FAHP
[22]. Kulak and Kahraman used this method for multicriteria
selection among transportation companies [23]. Dur´an and
Aguilo used FAHP for the evaluation and justification of an
advanced manufacturing system [24]. ¨On¨ut et al. combined
fuzzy multicriteria decision making approach for selecting
shopping center site [25]. Deng et al. mentioned that existing
methods of AHP cannot handle the uncertainties such as
imprecision, fuzziness, and incompleteness [26]. However,
Zh¨u discussed the validity of operational rules of fuzzy
numbers and fuzzy sets theory for FAHP [27].
Chen and Hwang first applied fuzzy numbers to establish a prototype fuzzy technique for order preference by similarity
to ideal solution (FTOPSIS) [28]. Chu and Lin suggested a
FTOPSIS model, where rating of alternatives under criteria and importance weights of criteria were assessed in linguistic
values represented by fuzzy numbers [29]. Rouyendegh
proposed two intuitionistic aggregation operators in order to perform fuzzy group decision making for project selection
[30]. Torfi et al. suggested a hybrid methodology with FAHP
and FTOPSIS, which is the closest to this study [15].
As it is explained above, the evaluation of the supplier performance is one of the most important issues in man-agement of supply chain. By using appropriate criteria and a systematic approach, the measurement of these performances is inevitable for the chain’s success and competitive advantage. In this study, two types of algorithms have been suggested for evaluation of suppliers’ performance and selection of the best possible supplier regarding its performance in one of the biggest electronic companies in Turkey. In this model, first, one of the techniques of fuzzy multicriteria decision making, that is, FAHP, is used to calculate global weights of the criteria and these weights are considered for both algorithms. Then, the FAHP-based performances and the rankings of FAHP-FTOPSIS hybrid algorithm are used to select the best
alternative supplier, separately. In Section2, the methodology
of this study including basic concepts of fuzziness and fuzzy decision analysis is given. The proposed models are applied in wholly fuzzy processes with a numerical example
for selected electronic company in Section 3. Finally, the
research results and conclusion remarks are summarized in
Section4.
2. Methodology of Determination of
Suppliers’ Performances
A fuzzy set is a class of objects with a continuum of grades of membership. Such a set is characterized by a membership function, which assigns to each object a grade of membership ranging from zero to one.
In the following, some basic important definitions of
Definition 1. A fuzzy set ̃𝑀 in a universe of discourse 𝑋
is characterized by a membership function 𝜇𝑀̃(𝑥), which
associates with each element 𝑥 in 𝑋 a real number in the
interval[0, 1]. The function value 𝜇𝑀̃(𝑥) is termed the grade
of membership of𝑥 in ̃𝑀.
Definition 2. A TFN ̃𝑀 can be defined as a triplet (𝑙, 𝑚, 𝑢),
and the membership function𝜇𝑀̃(𝑥) is defined as
𝜇𝑀̃(𝑥) = { { { { { { { { { { { { { 0, 𝑥 < 1, 𝑥 > 𝑢 (𝑥 − 𝑙) (𝑚 − 𝑙) 𝑙 ≤ 𝑥 ≤ 𝑚 (𝑢 − 𝑥) (𝑢 − 𝑚) 𝑚 ≤ 𝑥 ≤ 𝑢, (1)
where𝑙, 𝑚 and 𝑢 are real numbers and 𝑙 ≤ 𝑚 ≤ 𝑢. Algebraic
operations with fuzzy number can be found in [35].
Definition 3. Let ̃𝑀1 = (𝑙1, 𝑚1, 𝑢1) and ̃𝑀2 = (𝑙2, 𝑚2, 𝑢2)
be two triangular fuzzy numbers. Then, the distance between
them can be calculated by using the vertex method as [32]
𝑑 ( ̃𝑀1, ̃𝑀2) = √13[(𝑙1− 𝑙2)2+ (𝑚1− 𝑚2)2+ (𝑢1− 𝑢2)2].
(2)
Definition 4. A matrix ̃𝐷 is called a fuzzy matrix if at least one
element is a fuzzy number [19].
The study proposes two types of algorithms for evaluating the performance of suppliers in the fuzzy MCDA. The steps of the proposed holistic method can be outlined as follows.
Step 1. Establish a fuzzy comparison matrix for each factor
and criterion.
Let 𝑋 = {𝑥1, 𝑥2, . . . , 𝑥𝑛} be an object set and 𝑈 =
{𝑔1, 𝑔2, . . . , 𝑔𝑚} a goal set. According to Chang’s extent
analysis, each object is taken and extent analysis for each
goal𝑔𝑖is performed, respectively. Therefore,𝑚 extent analysis
values for each object can be obtained and shown as follows:
𝑀1𝑔𝑖, 𝑀𝑔2𝑖, . . . , 𝑀𝑔𝑚𝑖, 𝑖 = 1, 2, . . . , 𝑛, (3)
where all the 𝑀𝑗𝑔𝑖 (𝑗 = 1, 2, . . . , 𝑚) are TFNs.
Step 2. Calculate fuzzy synthetic extent with respect to the𝑖th
object which is defined as
𝑆𝑖=∑𝑚 𝑗=1 𝑀𝑗𝑔𝑖⊗ [ [ 𝑛 ∑ 𝑖=1 𝑚 ∑ 𝑗=1 𝑀𝑗𝑔𝑖] ] −1 . (4)
Note that⊗ denote the extended multiplication of two fuzzy
numbers and [ [ 𝑛 ∑ 𝑖=1 𝑚 ∑ 𝑗=1 𝑀𝑗𝑔𝑖] ] −1 = ((∑𝑛 𝑖=1 𝑢𝑖) −1 , (∑𝑛 𝑖=1 𝑚𝑖) −1 , (∑𝑛 𝑖=1 𝑙𝑖) −1 ) . (5)
The degree of possibility of ̃𝑀2 = (𝑙2, 𝑚2, 𝑢2) ≥ ̃𝑀1 =
(𝑙1, 𝑚1, 𝑢1) is defined as 𝑉( ̃𝑀2 ≥ ̃𝑀1) = sup[min(𝜇𝑀̃1(𝑥),
𝜇𝑀̃2(𝑦))] and can be equivalently expressed as follows:
𝑉 ( ̃𝑀2≥ ̃𝑀1) = hgt ( ̃𝑀1∩ ̃𝑀2) 𝜇𝑀̃2(𝑑)= { { { { { { { { { 1, 𝑚2≥ 𝑚1 0, 𝑙1≥ 𝑢2 𝑙1− 𝑢2 (𝑚2− 𝑢2) − (𝑚1− 𝑙1) otherwise, (6)
where𝑑 is the ordinate of the highest intersection point 𝐷
between𝜇𝑀̃1and𝜇𝑀̃2. To compare ̃𝑀1and ̃𝑀2, we need both
the values of𝑉( ̃𝑀1≥ ̃𝑀2) and 𝑉( ̃𝑀2≥ ̃𝑀1).
The degree of possibility for a convex fuzzy number to be
greater than𝑘 convex fuzzy numbers ̃𝑀𝑖(𝑖 = 1, 2, . . . , 𝑘) can
be defined by
𝑉 ( ̃𝑀 ≥ ̃𝑀1, ̃𝑀2, . . . , ̃𝑀𝑘)
= 𝑉 [( ̃𝑀 ≥ ̃𝑀1) , ( ̃𝑀 ≥ ̃𝑀2) , . . . , ( ̃𝑀 ≥ ̃𝑀𝑘)]
= min 𝑉 ( ̃𝑀 ≥ ̃𝑀𝑖) , 𝑖 = 1, 2, . . . , 𝑘.
(7)
Assume that𝑑(𝐴𝑖) = min 𝑉(𝑆𝑖 ≥ 𝑆𝑘) for 𝑘 = 1, 2, . . . , 𝑛;
𝑘 = 𝑖. Then the weight vector is given by 𝑊 = (𝑑(𝐴
1),
𝑑(𝐴
2), . . . , 𝑑(𝐴𝑛))𝑇, where 𝐴𝑖(𝑖 = 1, 2, . . . , 𝑛) are 𝑛
ele-ments. Via normalization, the normalized weight vectors are
𝑊 = (𝑑 (𝐴1) , 𝑑 (𝐴2) , . . . , 𝑑 (𝐴𝑛))𝑇, (8)
where𝑊 is a nonfuzzy number [20,36].
Step 3. Calculatethe global weights, multiplying by
normal-ized weights of factors and normalnormal-ized weights of each criterion.
Step 4. Follow the following steps.
Step 4.1a. Choose the linguistic variables (̃𝑥𝑖𝑗𝑖 = 1, 2, . . . , 𝑛,
𝑗 = 1, 2, . . . , 𝐽) for alternatives with respect to criteria. The
fuzzy linguistic rating (̃𝑥𝑖𝑗) preserves the property that the
ranges of normalized triangular fuzzy numbers belong to [0, 1]; thus, there is no need for normalization (decisions of expert team).
Step 4.2a. Calculate the fuzzy performances points of
Step 4.3a. Calculate the total fuzzy performance points for all
suppliers and perform defuzzification.
Step 4.4a. Find the sequences of the performances of
suppli-ers.
Step 4.1b. Use the same linguistic variables in Step 4a and
establish the initial decision matrix for TOPSIS method.
Step 4.2b. Calculate the fuzzy weighted decision matrix by
using global weights obtained by the FAHP.
Step 4.3b. Identify positive-ideal (𝐴∗) and negative-ideal
(𝐴−) solutions. The fuzzy positive-ideal (FPIS, 𝐴∗) and the
fuzzy negative-ideal solution (FNIS,𝐴−) are shown as follows:
𝐴∗= {̃V∗1, ̃V∗2, . . . , ̃V∗𝑖} = {(max V𝑖𝑗| 𝑖 ∈ 𝐼) × (min V𝑖𝑗| 𝑖 ∈ 𝐼)} , where𝐼 = 1, 2, . . . , 𝐽, 𝐴∗= {̃V−1, ̃V−2, . . . , ̃V−𝑖} = {(min V𝑖𝑗| 𝑖 ∈ 𝐼) × (max V𝑖𝑗| 𝑖 ∈ 𝐼)} , where𝐼 = 1, 2, . . . , 𝐽, (9)
where𝐼is associated with benefit criteria and𝐼is associated
with cost criteria. FPIS can be giveñV∗𝑖 = (1, 1, 1) and ̃V−𝑖 =
(0, 0, 0) for benefit criterion and FNIS can be given ̃V∗
𝑖 =
(0, 0, 0) and ̃V−
𝑖 = (1, 1, 1) for cost criterion.
Step 4.4b. Calculate the distance of each alternative from𝐴∗
and𝐴−using the following equations:
𝐷∗𝑗 =∑𝑛 𝑗=1 𝑑 (̃V𝑖𝑗, ̃V∗𝑖) 𝑗 = 1, 2, . . . , 𝐽, 𝐷−𝑗 =∑𝑛 𝑗=1 𝑑 (̃V𝑖𝑗, ̃V−𝑖) 𝑗 = 1, 2, . . . , 𝐽. (10)
Calculate then the total distances by using vertex method
given in (2).
Step 4.5b. Calculate similarities to ideal solution using
𝐶𝐶𝑗= 𝐷 − 𝑗 𝐷∗ 𝑗 + 𝐷−𝑗 𝑗 = 1, 2, . . . , 𝐽. (11)
Step 4.6b. Rank preference order. Choose an alternative with
maximum 𝐶𝐶∗𝑗 or rank alternatives according to 𝐶𝐶∗𝑗 in
descending order (holistic approach) [33].
Step 5. Compare the results obtained from both FAHP-based
evaluation and FAHP-FTOPSIS hybrid approaches.
3. An Application of the Proposed
Approaches in the Company
The proposed model is applied for four alternative suppliers of an electronic company which share very similar features. The company produced several types of electronic cards with more than 400 employees. It is one of the biggest electronic companies in the Middle East region which realizes a significant amount of exports to many countries. The aim of this application is to propose MCDA approach to evaluate the performance of the alternative suppliers of the company in the chain. Schematic diagram of the proposed algorithms
is provided in Figure1.
As it is given in Figure1, the first model used the FAHP
weights to evaluate the suppliers with performance scales of each criterion and the second model for the evaluation of performance is composed of hybrid method with FAHP and FTOPSIS, consisting of three main basic stages as follows:
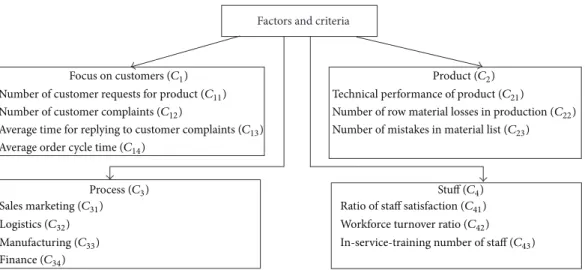
(1) establishing the decision team and identifying the factors (first level: main factors) and criteria (second level: subfactors) to be used in the model,
(2) using FAHP method, calculating the local weights of the factors and criteria by using fuzzy pairwise com-parison matrices, and calculating the global weights then,
(3) evaluating the alternatives with FTOPSIS by using FAHP weights and determination of the final ranking. The proposed models are applied to a real life problem in order to measure the performance of suppliers in the chain. This application created proprietary solutions for the electronic company. This company, which has one of the biggest annual sales turnovers, is working with approximately 50 inside or abroad suppliers and trying to manage this complex supply chain. The four of these suppliers selected have similar technical specifications to test the proposed approaches.
First, a team is established for the SCM performance eval-uation system improvement and the company’s related man-agers and academicians experienced in SCM are included in this team. Then, the factors and the criteria which will be used in the chain performance are determined and the strategic goals are used for the critical success of the company’s necessities. In gathering this information, a simultaneous study is done with both department managers and workers of the alternative companies. The process factors are evaluated on the basis of sales/marketing, logistics, manufacturing, and finance according to the literature and company’s features and necessities.
After determining the factors and criteria, weighting of the factors has been calculated for which the FAHP technique is used. The pairwise comparison judgment matrices are formed for the factors comparison. The values were obtained from the consensus of entire team. These matrices are evaluated and the local weights of the factors and the criteria are calculated. The main factors and 14 criteria included factor
Establish decision making team
Determine main factors
Determine criteria to be used in evaluation
Establish decision hierarchy
Calculate the local weights of main factors
Establish initial decision matrix
Establish weighted evaluation matrix for alternatives suppliers
Rank the performances of suppliers FTOPSIS
FAHP Calculate the local weights of criteria
Calculate the global weights of criteria
Determine the linguistic fuzzy values
Evaluate the suppliers
Sequence the performances
Compare the results
(a) (b)
Figure 1: Schematic diagram of the proposed algorithms.
Factors and criteria
Focus on customers (C1)
Number of customer requests for product (C11)
Number of customer complaints (C12)
Average time for replying to customer complaints (C13)
Average order cycle time (C14)
Process (C3) Sales marketing (C31) Logistics (C32) Manufacturing (C33) Finance (C34) Product (C2)
Technical performance of product (C21)
Number of row material losses in production (C22)
Number of mistakes in material list (C23)
Stuff (C4)
Ratio of staff satisfaction (C41)
Workforce turnover ratio (C42)
In-service-training number of staff (C43)
Table 1: Linguistic variables for the important weight of each criterion.
Linguistic values Triangular fuzzy numbers
Just equal (1, 1, 1)
Equally important (EI) (1/2, 1, 3/2)
Weakly more important (WMI) (1, 3/2, 2)
Strongly more important (SMI) (3/2, 2, 5/2)
Very strongly more important (VSMI) (2, 5/2, 3)
Absolutely more important (AMI) (5/2, 3, 7/2)
Table 2: Linguistic variables for the ratings.
Linguistic values Triangular fuzzy numbers
Very low (VL) (0, 0, 0.2) Low (L) (0, 0.2, 0.4) Medium (M) (0.2, 0.4, 0.6) High (H) (0.4, 0.6, 0.8) Very high (VH) (0.6, 0.8, 1) Excellent (E) (0.8, 1, 1)
Table 3: Pairwise comparison matrix of main factors.
𝐶1 𝐶2 𝐶3 𝐶4
𝐶1 (1, 1, 1) (3/2, 2, 5/2) (1, 3/2, 2) (2, 5/2, 3)
𝐶2 (2/5, 1/2, 2/3) (1, 1, 1) (1/2, 1, 3/2) (1/2, 1, 3/2)
𝐶3 (1/2, 2/3, 1) (2/3, 1, 2) (1, 1, 1) (1, 3/2, 2)
𝐶4 (1/3, 2/5, 1/2) (2/3, 1, 2) (1/2, 2/3, 1) (1, 1, 1)
Initially, the fuzzy scale regarding relative importance to
measure the relative weights in FAHP is given in Table1. This
scale is proposed by Kahraman et al. and used for solving
several fuzzy decision making problems in the literature [37].
There are several scales available in the literature but this type of range is selected as consensual validation of the expert team. The linguistic variables for the problem are shown in
Table2. The same scale is also used for the hybrid method.
The fuzzy pairwise comparison matrix of the factors is
stated in Table3and matrices of criteria are calculated in a
similar way. The expert team is given the individual pairwise
comparison matrix by using the scale given in Table1. The all
pairwise matrices are evaluated according to the consistency ratio and it is seen that all ratios are relevant in decision making (i.e., the inconsistency values are under 0,1).
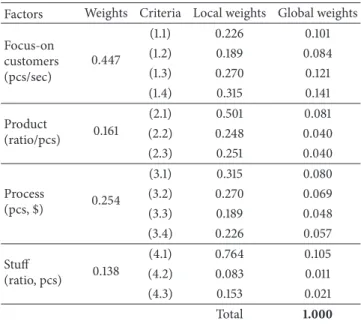
The global weights of criteria used in the evaluation process are calculated using FAHP. The results obtained from the calculations based on the pairwise comparison matrices
are presented in Table4. In this table, the global weights are
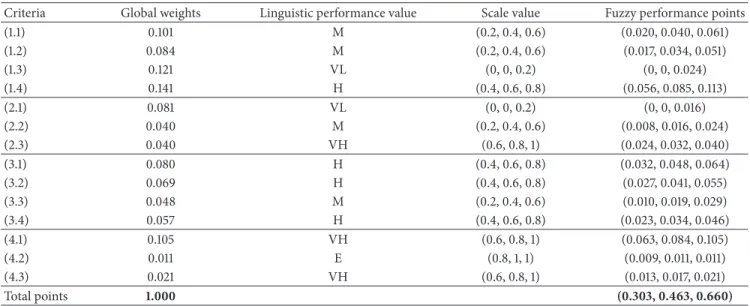
calculated, multiplying the weights and local weights. The obtained global weights and determined linguistic variables are multiplied and the total performances are calcu-lated. The results are defuzzified and the crisp performance values are obtained. The results of the algorithm at the end
of the FAHP-based approach are shown in Table5and the
sequences are given in Table6. According to the table, the
first performance in supply chain belongs to𝐴3.
Table 4: Calculated global weights of the criteria with FAHP.
Factors Weights Criteria Local weights Global weights
Focus-on customers (pcs/sec) 0.447 (1.1) 0.226 0.101 (1.2) 0.189 0.084 (1.3) 0.270 0.121 (1.4) 0.315 0.141 Product (ratio/pcs) 0.161 (2.1) 0.501 0.081 (2.2) 0.248 0.040 (2.3) 0.251 0.040 Process (pcs, $) 0.254 (3.1) 0.315 0.080 (3.2) 0.270 0.069 (3.3) 0.189 0.048 (3.4) 0.226 0.057 Stuff (ratio, pcs) 0.138 (4.1) 0.764 0.105 (4.2) 0.083 0.011 (4.3) 0.153 0.021 Total 1.000
Defuzzification formulation is given here as(𝑙+4𝑚+𝑢)/6.
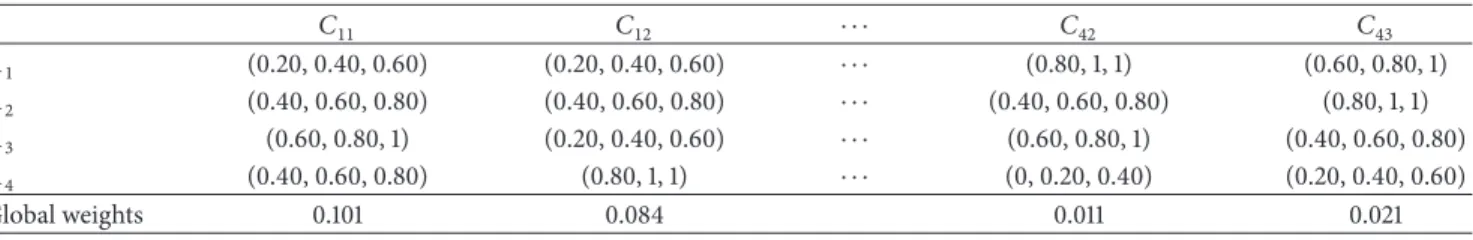
Fuzzy initial decision matrix of TOPSIS method con-structed for the evaluation of four suppliers (alternatives) of the electronic company by linguistic variables defined in
Table2is presented in Table7.
Using the global weights of criteria in Table 4, the
weighted evaluation matrix is established by multiplying global weights and each column of initial FTOPSIS decision
matrix and it is shown in Table8. Here, the fuzzy positive and
fuzzy negative ideal solutions are obtained.
The distance of each alternative from𝐷∗and𝐷−can be
currently calculated by using vertex method given by (2). The
next step is to solve the similarities to an ideal solution by
using (11). Then, the final results of FAHP-FTOPSIS hybrid
approach are summarized in Table9.
The positive and negative ideal solutions and also
similar-ities to ideal solution are calculated. As shown in Table9, the
scales are very close to each other. The ranks of the suppliers
are𝐴3,𝐴1,𝐴4, and𝐴2, respectively. The hybrid approach
succeeds to rank very close alternatives.
In the last step, the results are compared and analyzed
for both approaches. It is seen that𝐴3is the best alternative
supplier regarding chain performance for both methods but the sequences of the remaining performances of the suppliers are different although the methods used are the same global
weights. In Table 10, the sequences and the performance
values of two alternative evaluations are stated.
4. Conclusion and Discussion
In a competitive market, which has many suppliers dispersed in a wide geographical area with lots of opportunities for purchasing and distribution, beside the managerial activities of the companies makes it inevitable to high-dimensioned critical decision making for the managers. Furthermore, the
Table 5: Fuzzy performance of Supplier #1 (𝐴1).
Criteria Global weights Linguistic performance value Scale value Fuzzy performance points
(1.1) 0.101 M (0.2, 0.4, 0.6) (0.020, 0.040, 0.061) (1.2) 0.084 M (0.2, 0.4, 0.6) (0.017, 0.034, 0.051) (1.3) 0.121 VL (0, 0, 0.2) (0, 0, 0.024) (1.4) 0.141 H (0.4, 0.6, 0.8) (0.056, 0.085, 0.113) (2.1) 0.081 VL (0, 0, 0.2) (0, 0, 0.016) (2.2) 0.040 M (0.2, 0.4, 0.6) (0.008, 0.016, 0.024) (2.3) 0.040 VH (0.6, 0.8, 1) (0.024, 0.032, 0.040) (3.1) 0.080 H (0.4, 0.6, 0.8) (0.032, 0.048, 0.064) (3.2) 0.069 H (0.4, 0.6, 0.8) (0.027, 0.041, 0.055) (3.3) 0.048 M (0.2, 0.4, 0.6) (0.010, 0.019, 0.029) (3.4) 0.057 H (0.4, 0.6, 0.8) (0.023, 0.034, 0.046) (4.1) 0.105 VH (0.6, 0.8, 1) (0.063, 0.084, 0.105) (4.2) 0.011 E (0.8, 1, 1) (0.009, 0.011, 0.011) (4.3) 0.021 VH (0.6, 0.8, 1) (0.013, 0.017, 0.021) Total points 1.000 (0.303, 0.463, 0.660)
Table 6: Crisp values and sequences of the alternative suppliers’ performances.
Alternatives Total fuzzy points Defuzzification Rank
𝐴1 (0.303, 0.463, 0.660) 0.469 4
𝐴2 (0.421, 0.621, 0.748) 0.609 2
𝐴3 (0.510, 0.710, 0.902) 0.709 1
𝐴4 (0.413, 0.613, 0.768) 0.606 3
efficiency in decision making depends on exact evaluation of performance of suppliers in time windows.
SCM and the process of the evaluation of supplier performance can be defined as MCDA problems for the com-panies. The conventional evaluation methods are inadequate in dealing with the imprecise or vague nature of linguistic assessments. To overcome this difficulty, fuzzy multicriteria methods are proposed in all steps.
Though the purpose of AHP is to capture the expert’s knowledge, the conventional AHP cannot reflect the human thinking style. Therefore, FAHP and fuzzy extensions of AHP are developed to solve hierarchical fuzzy problems. This method has systematic approaches to alternative selection and problem justification by using the concepts of fuzzy theory and hierarchical structure analysis. Decision makers usually find that they are more confident to give interval judgments than fixed values judgments. This is because usually he/she is unable to explicit his/her preferences due to the fuzzy nature of the comparison process.
Using the FTOPSIS method, the decision maker’s fuzzy assignments with different rating view points and tradeoffs among different criteria are considered in the aggregation procedure. to ensure more accurate decision making. This study uses TFN for both FAHP and FTOPSIS. The reason for using a TFN is that it is intuitively easy for the decision makers to use and calculate.
In this study, the evaluation of alternative suppliers’ performance for a big electronic company is realized in wholly fuzzy processes. Firstly, the main factors and criteria for evaluation of the performance are determined by the expert team according to the company’s necessities. The global weights of these criteria are calculated using FAHP technique. The supply chain performances of the alternative companies are evaluated using these weights and linguistic values of each supplier. The same weights are embedded in the FTOPSIS method and a hybrid algorithm is performed. In consideration of the results of the algorithms, the sequences differed. Regarding this difference, it is conceivable that the alternatives have very close technical features and/or the approximations of the methods into the problems are varied. The FTOPSIS method is substituted with the FAHP in most cases in the literature but there is no comparative degree with each other in the experiences up to now. In this manner, the proposed studies used in the application bring more flexibility to the company’s performance evaluation system.
The first rank, that is, the best possible performance with
the scale value of 0.445, belongs to Supplier𝐴3. The scales
of four alternatives are very close which range between 0.433 and 0.445. In such a narrow interval, the performance of the proposed hybrid algorithm is very successful and flexible. The algorithm serves a holistic approach for the performance evaluation system combined with both MCDA methods in the literature. Furthermore, it is suggested that the proposed flexible model could be easily used by the companies in different sectors, taking into consideration their own criteria in the SCM system.
As a future extension to this study, the relationships between the factors and criteria could be considered using Analytical Network Process (ANP), which is a powerful method. Hence, it is believed that both of the approaches could be used to obtain more accurate result in evaluating the chain performance.
Table 7: Initial FTOPSIS decision matrix for four alternative companies. 𝐶11 𝐶12 ⋅ ⋅ ⋅ 𝐶42 𝐶43 𝐴1 (0.20, 0.40, 0.60) (0.20, 0.40, 0.60) ⋅ ⋅ ⋅ (0.80, 1, 1) (0.60, 0.80, 1) 𝐴2 (0.40, 0.60, 0.80) (0.40, 0.60, 0.80) ⋅ ⋅ ⋅ (0.40, 0.60, 0.80) (0.80, 1, 1) 𝐴3 (0.60, 0.80, 1) (0.20, 0.40, 0.60) ⋅ ⋅ ⋅ (0.60, 0.80, 1) (0.40, 0.60, 0.80) 𝐴4 (0.40, 0.60, 0.80) (0.80, 1, 1) ⋅ ⋅ ⋅ (0, 0.20, 0.40) (0.20, 0.40, 0.60) Global weights 0.101 0.084 0.011 0.021
Table 8: Weighted evaluation matrix for the alternatives.
𝐶11 𝐶12 ⋅ ⋅ ⋅ 𝐶42 𝐶43 𝐴1 (0.02, 0.04, 0.06) (0.02, 0.03, 0.05) ⋅ ⋅ ⋅ (0.01, 0.01, 0.01) (0.01, 0.02, 0.02) 𝐴2 (0.04, 0.06, 0.08) (0.03, 0.05, 0.07) ⋅ ⋅ ⋅ (0.00, 0.01, 0.01) (0.02, 0.02, 0.02) 𝐴3 (0.06, 0.08, 0.1) (0.02, 0.03, 0.05) ⋅ ⋅ ⋅ (0.01, 0.01, 0.01) (0.01, 0.01, 0.02) 𝐴4 (0.04, 0.06, 0.08) (0.07, 0.08, 0.08) ⋅ ⋅ ⋅ (0.00, 0.00, 0.00) (0.00, 0.01, 0.01) 𝐴∗ ̃V∗ 11= (1, 1, 1) ̃V∗12= (0, 0, 0) ⋅ ⋅ ⋅ ̃V∗42= (0, 0, 0) ̃V∗43= (0, 0, 0) 𝐴− V− 11= (0, 0, 0) ̃V−12= (1, 1, 1) ⋅ ⋅ ⋅ ̃V−42= (1, 1, 1) ̃V−43= (1, 1, 1)
Table 9: FTOPSIS results of ideal solutions and ranking of alterna-tives. Alternatives 𝐷∗𝑗 𝐷−𝑗 𝐶𝐶𝑗 Rank 𝐴1 3.656 2.896 0.442 2 𝐴2 3.657 2.794 0.433 4 𝐴3 3.524 2.821 0.445 1 𝐴4 3.625 2.820 0.438 3
Table 10: The comparison of both FAHP-based and FAHP-TOPSIS hybrid algorithms.
Alternatives FAHP
Hybrid (FAHP-FTOPSIS)
Rank Scales Rank Scales
𝐴1 4 0.469 2 0.442
𝐴2 2 0.609 4 0.433
𝐴3 1 0.709 1 0.445
𝐴4 3 0.606 3 0.438
Conflict of Interests
The authors declare that there is no conflict of interests regarding the publication of this paper.
References
[1] R. Ganeshan and T. P. Harrison, “An introduction to
sup-ply chain management,” 2003,http://lcm.csa.iisc.ernet.in/scm/
supply chain intro.html.
[2] L. M. Ellram, “Supply chain management: the industrial orga-nization perspective,” International Journal of Physical
Distribu-tion and Logistics Management, vol. 21, no. 1, pp. 13–22, 1991.
[3] C. A. Miller, The nature and design of supply chain performance
measurement systems-an empirical study [Ph.D. thesis], The
Pysillyvania State University, 2001.
[4] S. Holmberg, Measurement on an integrated supply chain [Ph.D.
thesis], Lund University, 1997.
[5] R. S. Kaplan and D. P. Norton, The Balanced Scorecard:
Translat-ing Strategy into Action, Harvard Business Scholl Press, Boston,
Mass, USA, 1996.
[6] P. C. Brewer and T. W. Speh, “Using the balanced scorecard to measure supply chain performance,” Journal of Business
Logistics, vol. 21, no. 1, pp. 75–94, 2000.
[7] J. L. Matthew and T. Milller, “A framework for integrating activity-based costing and the balanced scorecard into the logistics strategy development and monitoring process,” Journal
of Business Logistics, vol. 19, no. 2, pp. 131–154, 1998.
[8] F. T. S. Chan, “Performance measurement in a supply chain,”
International Journal of Advanced Manufacturing Technology,
vol. 21, no. 7, pp. 534–548, 2003.
[9] C. Wei, G. Liang, and M. J. Wang, “A comprehensive supply chain management project selection framework under fuzzy environment,” International Journal of Project Management, vol. 25, no. 6, pp. 627–636, 2007.
[10] A. F. Guneri, A. Yucel, and G. Ayyildiz, “An integrated fuzzy-lp approach for a supplier selection problem in supply chain management,” Expert Systems with Applications, vol. 36, no. 5, pp. 9223–9228, 2009.
[11] L. Napalkova and G. Merkuryeva, “Multi-objective stochastic simulation-based optimisation applied to supply chain plan-ning,” Technological and Economic Development of Economy, vol. 18, no. 1, pp. 132–148, 2012.
[12] Y. Chen, C. Chen, and C. Lai, “Extracting performance rules of suppliers in the manufacturing industry: an empirical study,”
Journal of Intelligent Manufacturing, vol. 23, no. 5, pp. 2037–
2045, 2012.
[13] Z. H. Che, T. Chiang, and Z. Che, “Using analytic network pro-cess and turbo particle swarm optimization algorithm for non-balanced supply chain planning considering supplier relation-ship management,” Transactions of the Institute of Measurement
and Control, vol. 34, no. 6, pp. 720–735, 2012.
[14] B. D. Rouyendegh and T. E. Erkan, “Selection the best supplier using AHP method,” African Journal of Business Management, vol. 6, no. 4, pp. 1454–1462, 2012.
[15] F. Torfi, R. Z. Farahani, and S. Rezapour, “Fuzzy AHP to determine the relative weights of evaluation criteria and Fuzzy TOPSIS to rank the alternatives,” Applied Soft Computing
Journal, vol. 10, no. 2, pp. 520–528, 2010.
[16] G. Bojadziev and M. Bojadziev, Fuzzy Sets and Fuzzy Logic
Applications, World Scientific Publishing, Singapore, 1998.
[17] L. A. Zadeh, “Fuzzy sets,” Information and Computation, vol. 8, pp. 338–353, 1965.
[18] P. J. M. van Laarhoven and W. Pedrycz, “A fuzzy extension of Saaty’s priority theory,” Fuzzy Sets and Systems, vol. 11, no. 3, pp. 229–241, 1983.
[19] J. J. Buckley, “Fuzzy hierarchical analysis,” Fuzzy Sets and
Systems, vol. 17, no. 3, pp. 233–247, 1985.
[20] D. Chang, “Applications of the extent analysis method on fuzzy AHP,” European Journal of Operational Research, vol. 95, no. 3, pp. 649–655, 1996.
[21] C. H. Cheng, “Evaluating naval tactical missile systems by fuzzy AHP based on the grade value of membership function,”
European Journal of Operational Research, vol. 96, no. 2, pp.
343–350, 1997.
[22] K. Zhu, Y. Jing, and D. Chang, “Discussion on extent analysis method and applications of fuzzy AHP,” European Journal of
Operational Research, vol. 116, no. 2, pp. 450–456, 1999.
[23] O. Kulak and C. Kahraman, “Fuzzy multi-attribute selection among transportation companies using axiomatic design and analytic hierarchy process,” Information Sciences, vol. 170, no. 2–4, pp. 191–210, 2005.
[24] O. Dur´an and J. Aguilo, “Computer-aided machine-tool selec-tion based on a Fuzzy-AHP approach,” Expert Systems with
Applications, vol. 34, no. 3, pp. 1787–1794, 2008.
[25] S. ¨On¨ut, T. Efendigil, and S. S. Kara, “A combined fuzzy MCDM
approach for selecting shopping center site: an example from Istanbul, Turkey,” Expert Systems with Applications, vol. 37, no. 3, pp. 1973–1980, 2010.
[26] X. Deng, Y. Hu, Y. Deng, and S. Mahadevan, “Supplier selection using AHP methodology extended by D numbers,” Expert
Systems with Applications, vol. 41, pp. 156–167, 2014.
[27] K. Zh¨u, “Fuzzy analytic hierarchy process: fallacy of the popular methods,” European Journal of Operational Research, vol. 236, no. 1, pp. 209–217, 2014.
[28] S. Chen and C. Hwang, Fuzzy Multiple Attribute Decision
Making, Springer, Berlin, Germany, 1992.
[29] T. Chu and Y. Lin, “An interval arithmetic based fuzzy TOPSIS model,” Expert Systems with Applications, vol. 36, no. 8, pp. 10870–10876, 2009.
[30] B. D. Rouyendegh, “Evaluating projects based on intuitionistic fuzzy group decision making,” Journal of Applied Mathematics, vol. 2012, Article ID 824265, 16 pages, 2012.
[31] S. Chen, “Evaluating weapon systems using fuzzy arithmetic operations,” Fuzzy Sets and Systems, vol. 77, no. 3, pp. 265–276, 1996.
[32] C. T. Chen, C. T. Lin, and S. F. Huang, “A fuzzy approach for supplier evaluation and selection in supply chain management,”
International Journal of Production Economics, vol. 102, no. 2, pp.
289–301, 2006.
[33] S. ¨On¨ut and S. Soner, “Transshipment site selection using the
AHP and TOPSIS approaches under fuzzy environment,” Waste
Management, vol. 28, no. 9, pp. 1552–1559, 2008.
[34] T. Wang and T. Chang, “Application of TOPSIS in evaluating initial training aircraft under a fuzzy environment,” Expert
Systems with Applications, vol. 33, no. 4, pp. 870–880, 2007.
[35] H. J. Zimmerman, Fuzzy Sets Theory and Its Applications, Kluwer Academic, Boston, Mass, USA, 1996.
[36] D. Y. Chang, “Extent analysis and synthetic decision,” in
Opti-mization Techniques and Applications, vol. 1, World Scientific
Publishers, Singapore, 1992.
[37] C. Kahraman, T. Erbay, and G. B¨uy¨uk¨ozkan, “A fuzzy optimiza-tion model for QFD planning process using analytic network approach,” European Journal of Operational Research, vol. 171, no. 2, pp. 390–411, 2006.
Submit your manuscripts at
http://www.hindawi.com
Hindawi Publishing Corporation
http://www.hindawi.com Volume 2014
Mathematics
Journal ofHindawi Publishing Corporation
http://www.hindawi.com Volume 2014 Mathematical Problems in Engineering
Hindawi Publishing Corporation http://www.hindawi.com
Differential Equations
International Journal of
Volume 2014
Hindawi Publishing Corporation
http://www.hindawi.com Volume 2014 Hindawi Publishing Corporationhttp://www.hindawi.com Volume 2014
Hindawi Publishing Corporation
http://www.hindawi.com Volume 2014
Mathematical PhysicsAdvances in
Complex Analysis
Journal ofHindawi Publishing Corporation
http://www.hindawi.com Volume 2014
Optimization
Journal ofHindawi Publishing Corporation
http://www.hindawi.com Volume 2014
Combinatorics
Hindawi Publishing Corporation
http://www.hindawi.com Volume 2014 International Journal of
Hindawi Publishing Corporation
http://www.hindawi.com Volume 2014
Journal of
Hindawi Publishing Corporation
http://www.hindawi.com Volume 2014
Function Spaces
Abstract and Applied Analysis
Hindawi Publishing Corporation
http://www.hindawi.com Volume 2014 International Journal of Mathematics and Mathematical Sciences
Hindawi Publishing Corporation http://www.hindawi.com Volume 2014
The Scientific
World Journal
Hindawi Publishing Corporation
http://www.hindawi.com Volume 2014
Hindawi Publishing Corporation
http://www.hindawi.com Volume 2014
Discrete Dynamics in Nature and Society
Hindawi Publishing Corporation
http://www.hindawi.com Volume 2014
Hindawi Publishing Corporation
http://www.hindawi.com Volume 2014
Discrete Mathematics
Journal ofHindawi Publishing Corporation
http://www.hindawi.com Volume 2014 Hindawi Publishing Corporationhttp://www.hindawi.com Volume 2014