Contents lists available atScienceDirect
Clinical Imaging
journal homepage:www.elsevier.com/locate/clinimag
Neuroradiology
Can unenhanced brain magnetic resonance imaging be used in routine
follow up of meningiomas to avoid gadolinium deposition in brain?
Feride Kural Rahatli
⁎, Fuldem Yildirim Donmez, Cagri Kesim, Kemal Murat Haberal,
Hale Turnaoglu, Ahmet Muhtesem Agildere
Baskent University, Faculty of Medicine, Department of Radiology, Ankara, Turkey
A R T I C L E I N F O
Keywords: Meningioma
Linear gadolinium based contrast agents Gadolinium deposition
Dentate nucleus Globus pallidus
A B S T R A C T
Purpose: We hypothesized that unenhanced brain MRI can be used in follow up of patients with intracranial meningioma to avoid gadolinium deposition in the brain and allow measurement of meningioma dimensions from pre-contrast T2-weighted images.
Methods: Dimensions of meningiomas were measured on pre-contrast T2, post-contrast T1 weighted images. Results: The sizes of meningiomas in post-contrast axial T1-weighted images were similar with that in pre-contrast axial T2-weighted images. Signal intensity increase was detected in dentate nucleus and globus pallidus (P < 0.05).
Conclusion: Gadolinium deposition could be avoided in patients with meningioma by using unenhanced brain MRI for follow up scans.
1. Introduction
Meningiomas arise from arachnoid gap cells; they are the most common type (13%–26%) of non-glial primary intracranial tumor [1,2], and mostly occur in the sixth or seventh decades [3,4]. Almost 90% of cases occur in the supratentorial compartment, and the female-to-male ratio is 2:1 [1]. According to the World Health Organization (WHO) histological classification, approximately 90% of meningiomas are benign (WHO grade I), 5%–7% are atypical (WHO grade II), and 1%–3% are malignant (WHO grade III) [5]. They are usually found incidentally by brain magnetic resonance imaging (MRI) or computed tomography performed for other reasons [5]. Symptomatic cases pre-sent clinically with headache, personality changes, paresis, and seizures [1]. On brain MRI scans, meningiomas are extra-axial, dural-based, well-defined tumors that are mostly isointense with gray matter on T1-and T2-weighted images T1-and show homogenous T1-and prominent (> 95%) enhancement after intravenous contrast media injection. Post contrast images increase diagnostic reliability of meningiomas by showing homogenous and prominent enhancement, dural tail, vascular clefts [6,7]. It has been reported that 60% of asymptomatic me-ningiomas [6,8] and calcified meningiomas [5,9] show no tumor growth. In practice most clinicians administer a conservative treatment for asymptomatic meningiomas, with contrast-enhanced brain MRI every 6 months to a year in routine follow ups [1,2,5] to evaluate the
lesion growth; the dimensions of the lesion are usually measured on post-contrast T1-weighted images and compared with previous scans.
Gadolinium-based contrast agents (GBCA) are used for enhanced brain MRI owing to the paramagnetic effect of gadolinium ion. Free gadolinium is toxic in biological systems; chelated forms must therefore be used to avoid toxicity. GBCAs are classified as linear non-ionic, linear ionic, macro cyclic non-ionic, and macro cyclic ionic. Linear forms are the most frequently used; an increased signal intensity in the dentate nucleus (DN) and globus pallidus (GP) was observed in pre-contrast axial T1-weighted images in consecutive MRI scans using linear GBCAs in patients without renal dysfunction [10–12]. Others have reported gadolinium deposition in postmortem brain tissue fol-lowing repeated use of linear GBCA independent of renal function [13,14]. T1 hyper intensity in the DN and GP has been linked to ga-dolinium deposition [13]. McDonald et al. injected multiple doses of linear and macro cyclic gadolinium based contrast agents to rats and found out those macro cyclic agents also deposits in brain which was two to four times lesser than linear agents [15].
The clinical effect of the gadolinium deposition in the brain is un-known. To the best of our knowledge in none of the previous studies gadolinium deposition in the brain was found to be associated with any clinical symptom [10,12,14].
We hypothesized that unenhanced brain MRI can be used in routine follow up of patients with intracranial meningioma in order to avoid
https://doi.org/10.1016/j.clinimag.2018.10.014
Received 21 November 2017; Received in revised form 1 October 2018; Accepted 12 October 2018
⁎Corresponding author at: Baskent University, Faculty of Medicine, Department of Radiology, 10. Sokak No:45, 06490, Bahcelievler, Ankara, Turkey.
E-mail address:[email protected](F.K. Rahatli).
Clinical Imaging 53 (2019) 155–161
0899-7071/ © 2018 Elsevier Inc. All rights reserved.
gadolinium deposition in the brain and allow measurement of me-ningioma dimensions from pre-contrast T2-weighted images. We in-vestigated whether measurements on pre-contrast T2-weighted images and post-contrast T1-weighted images are congruent. We calculated the signal intensity ratios for DN/pons, DN/cerebellum and GP/thalamus from the precontrast T1 weighted images if the signal intensity of globus pallidus and dentate nucleus increases with the usage of linear gadolinium based contrast agents which is linked to gadolinium de-position.
2. Materials and methods 2.1. Patient population
From November 2010 to October 2016, we retrospectively eval-uated 29 patients (age range: 26–86 years; median age: 61 years; 21 women, 8 men) in a routine follow up for intracranial meningioma who underwent consecutive brain MRI with linear non-ionic GBCA (gado-versetamide) at our institution. The study was approved by the local ethics committee. Of the 29 patients, 26 had five and three had six enhanced brain MRIs. A standard dose of 0.1 mmol/kg or 0.2 ml/kg of non-ionic contrast material was administered intravenously. The mean time interval between brain MRIs was 10 months (range: 1.66–21.3 months).
A total of 28 patients had one meningioma and one patient had two meningiomas. Exclusion criteria were: (1) an estimated glomerular fil-tration rate lower than 60 ml/min; (2) a history of brain hemorrhage, brain irradiation, brain surgery, intracranial infection such as
meningitis or encephalitis, demyelinating diseases, or metabolic dis-eases; (3) a history of malignancy or chemotherapy; and (4) the ex-istence of hepatic dysfunction.
2.2. MR imaging parameters and data analysis
MRI was performed on a 1.5 T MRI scanner (Avanto; Siemens, Erlangen, Germany) with a 16-channel phased array head coil. The standard MR imaging protocol included axial FLAIR (repetition time/ echo time [TR/TE]: 8000/84 ms, slice thickness: 5.5 mm,field of view [FOV]: 22 cm); axial T1-weighted images (TR/TE: 410/9.2 ms, slice thickness: 5.5 mm, FOV: 22 cm); axial T2-weighted images (TR/TE: 3630/103 ms, slice thickness: 5.5 mm, FOV: 22 cm); post-gadolinium-enhanced axial T1-weighted images; (TR/TE: 552/17 ms, slice thick-ness: 5.5 mm, FOV: 22 cm). A standard dose of gadoversetamide (0.1 mmol/kg or 0.2 ml/kg) was intravenously administered as a bolus. Scans were visually evaluated by a neuroradiologist with 6 years of experience.
Meningioma dimensions were measured on axial pre-contrast T2-weighted images and axial post-contrast T1-T2-weighted images based on anterior-posterior (AP) and medial-lateral (ML) lengths on thefirst and last scans. The measurements were made by two neuroradiologists 10 years and 6 years experienced in neuroradiology. The measurements were made independently the neuroradiologists were blinded to the names of the patients and the dates of the brain MRIs. Thefirst and last measurements were compared to determine lesion growth. Measurements on post-contrast T1- and pre-contrast T2-weighted images were evaluated for correlations.
Fig. 1. 69 year old male patient with frontal meningioma who underwent 6 enhanced brain MRIs with linear GBCA. Axial post-contrast T1 weighted (A), axial pre-contrast T2 weighted images (B) from thefirst brain MRI and axial post-contrast T1 weighted (C) and axial pre-contrast T2 weighted (D) images from the last brain MRI. The lesion size was measured as 32 × 21 mm (apxml) on axial T1-weighted image (A) and 32 × 20 mm on axial T2-weighted image (B) at the initial brain MR imaging. The lesion size was measured as 32 × 20 mm (apxml) on axial T1-weighted image (C) and 32 × 20 mm on axial T2-weighted image (D) at the sixth brain MR imaging. The measurements are congruent and there is no pro-gression in the meningioma.
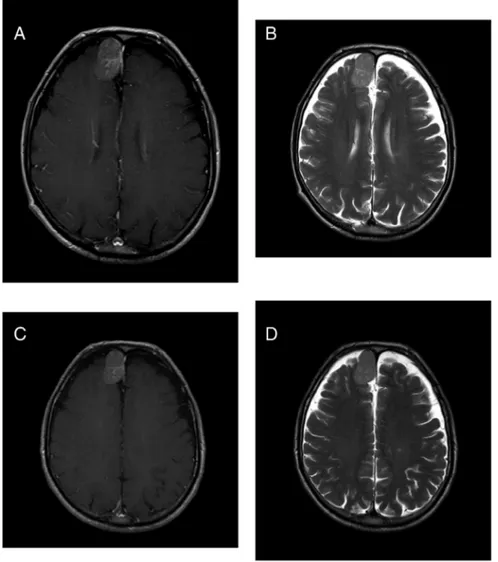
Fig. 2. 76 year old female patient with frontal me-ningioma who underwent 6 enhanced brain MRIs with linear GBCA. Axial post-contrast T1 weighted (A), axial pre-contrast T2 weighted images (B) from thefirst brain MRI and axial post-contrast T1 weighted (C) and axial pre-contrast T2 weighted (D) images from the last brain MRI. The lesion size was measured as 28 × 26 mm (apxml) on axial T1-weighted image (A) and 26 × 28 mm on axial T2-weighted image (B) at the initial brain MR imaging. The lesion size was measured as 35 × 36 mm (apxml) on axial T1-weighted image (C) and 35 × 37 mm on axial T2-weighted image (D) at the sixth brain MR imaging. The measurements show correlation. There is progression in the meningioma which can be both shown by axial post-contrast T1 weighted images and axial pre-contrast T2 weighted images.
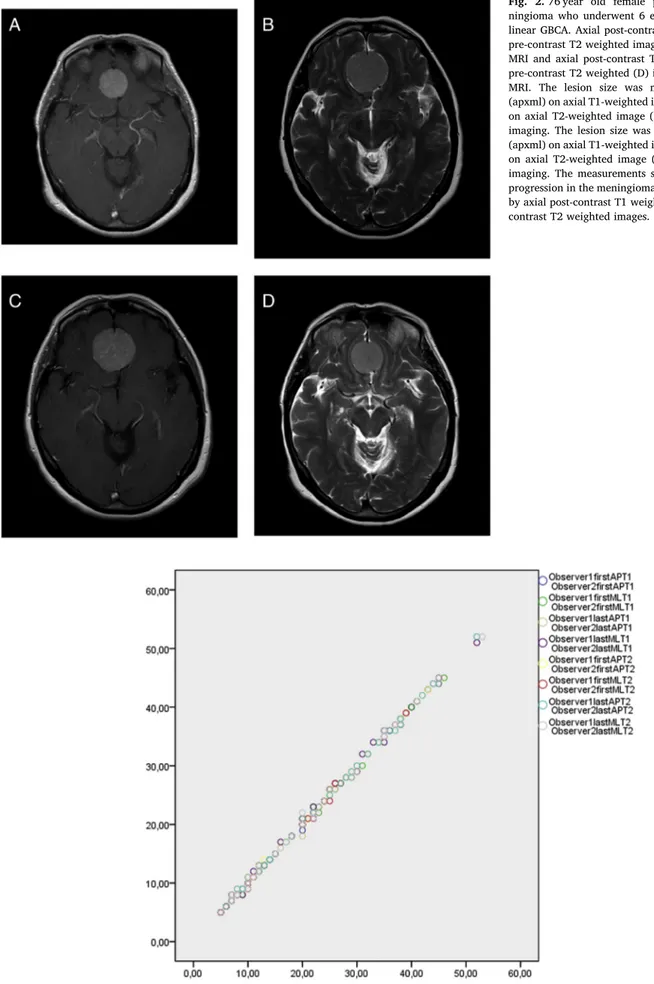
Fig. 3. Scatter plot diagram shows the dimensions of meningiomas measured by observer 1 versus observer 2 from thefirst and last brain MRIs on axial postcontrast T1 weighted images and axial precontrast T2 weighted images. R2= 0.99.
Quantitative analysis of images to assess hyper intensity in the DN and GP was carried out as previously described [10,11]. An operator-defined oval region of interest (ROI) was drawn on axial pre-contrast T1 weighted images around the right DN, central pons, right cerebellar white matter, right GP, and right thalamus for each brain MRI. The ROI wasfirst drawn as large as possible on the DN and GP, and the same size was used for the pons, cerebellar white matter, and thalamus. If the right side could not be examined due to artifacts or gliosis, the left side was used. The DN-to-pons signal intensity ratio (DN/pons) was calcu-lated by dividing the mean signal intensity of the DN by that of the pons. The DN-to-cerebellum and GP-to-thalamus signal intensity ratios (DN/cerebellum and GP/thalamus, respectively) were calculated in a similar manner for the respective brain regions.
In total, 148 brain MRI scans were examined for differences in DN/ pons, DN/cerebellum, and GP/thalamus signal intensity ratios. In 27 patients, GP/thalamus signal intensity ratios were measured from the right side. In two patients, GP/thalamus signal intensity ratios were measured from the left side due to chronic encephalomalacia in the right basal ganglia. DN/pons and DN/cerebellum signal intensity ratios were measured from the right side.
2.3. Statistical analysis
Data were analyzed using R v.3.2.1 software (R Foundation for Statistical Computing, Vienna, Austria), and the a priori significance level was set to P < 0.005. A one-sample t-test was used to determine assess differences in mean signal intensity ratios of the first and last examinations. Analyses were carried out for DN/pons, DN/cerebellum, and GP/thalamus ratios. Inter observer correlation agreement between the two readers' tumor measurements from thefirst and last brain MRIs from axial T1 post contrast and axial T2 pre contrast images was tested using interclass correlation coefficient test.
3. Results
A total of 22 of 30 meningiomas were in the supratentorial region and eight were in the infratentorial region. Meningioma size (AP × ML) varied from 6 × 5 mm2to 45 × 40 mm2. The size of six meningiomas in five patients increased, as determined from measurements on both axial pre-contrast T2-weighted images and axial post-contrast T1-weighted images (Figs. 1 and 2). The mean increase in AP length was 8 mm (minimum 5 mm–maximum 14 mm) and the mean increase in ML length was 7 mm (minimum 5 mm–maximum 10 mm). Measurements on axial post-contrast T1-weighted and axial pre-contrast T2-weighted images were congruent. Inter observer agreement was very high for all measurements (R = 0.99). (Fig. 3) Meningioma dimensions measured on thefirst and last MRI scans on pre-contrast axial T2-weighted images and post-contrast axial T1-weighted images as well as the follow-up time for each lesion, lesion localization, and demographicfindings are shown inTable 1.
A total of 20 meningiomas were isointense on both T1- and T2-weighted images and showed diffuse homogenous contrast enhance-ment on post-contrast T1-weighted images; 26 had a dural tail and cerebrospinalfluid cleft. In 10 of the meningiomas, calcification was detected as hypo intense areas on T2-weighted images and SWI se-quences. There were peritumoral hyper intensities in adjacent brain parenchyma consistent with edema on T2-weighted images in brain MRI scans of two meningiomas. Both lesions showed progression during the follow up but the peritumoral edema did not change. For the re-maining 29 lesions, there was no change in intensity in the adjacent brain parenchyma.
Median (IQR) DN/pons ratios for thefirst and last brain MRI scans were 1048 (0,0475) and 1126 (0,1035) respectively; median (IQR) DN/ cerebellum ratios for thefirst and last brain MRI scans were 1063 (0,05) and 1140 (0,111) respectively; and median (IQR) GP/thalamus ratios for thefirst and last brain MRI scans were 1073 (0,035) and 1123
Table 1
Age, gender, lesion localization, follow up time for each lesion and the dimensions of meningiomas measured from thefirst and last MRIs on both pre-contrast axial T2 weighted images and post-contrast axial T1 weighted images. The dimensions are consensus of the two readers.
Age Gender Lesion localization Mean follow up time (month) Dimensions onfirst MRI postcontrast T1W I (mm × mm) Dimensions onfirst MRI precontrast T2W I (mm × mm)
Dimensions on last MRI postcontrast T1W I (mm × mm)
Dimensions on last MRI precontrast T2W I (mm × mm) 70 F Infratentorial 5 38 × 23 36 × 18 38 × 23 36 × 17 80 F Infratentorial 10 14 × 7 14 × 6 14 × 8 14 × 7 68 F Supratentorial 14 40 × 45 39 × 44 45 × 51 44 × 52 61 M Supratentorial 22 10 × 8 9 × 8 11 × 7 9 × 8 49 F Supratentorial 17 29 × 24 26 × 24 27 × 24 26 × 24 64 M Infratentorial 19 38 × 12 37 × 12 38 × 13 38 × 12 72 F Supratentorial 38 41 × 30 42 × 29 41 × 32 42 × 29 42 F Supratentorial 23 10 × 8 9 × 8 10 × 9 9 × 8 57 F Supratentorial 32 12 × 10 12 × 10 12 × 10 12 × 10 58 M Supratentorial 32 28 × 22 29 × 21 28 × 21 29 × 21 86 F Supratentorial 24 23 × 26 21 × 24 30 × 34 28 × 31 86 F Supratentorial 24 40 × 40 38 × 39 52 × 45 52 × 45 71 M Supratentorial 27 43 × 38 43 × 37 44 × 39 44 × 37 26 F Infratentorial 47 21 × 22 21 × 21 21 × 22 21 × 21 57 F Supratentorial 30 22 × 20 21 × 20 23 × 20 22 × 20 32 F Infratentorial 44 19 × 18 17 × 18 18 × 18 17 × 17 64 F Supratentorial 34 7 × 8 7 × 8 7 × 8 7 × 8 55 F Supratentorial 36 6 × 5 6 × 5 6 × 5 6 × 5 81 F Infratentorial 60 28 × 26 28 × 26 28 × 27 28 × 26 50 F Supratentorial 36 14 × 14 13 × 13 20 × 20 18 × 18 65 F Supratentorial 50 28 × 26 26 × 28 35 × 36 35 × 37 60 F Supratentorial 42 10 × 10 8 × 11 10 × 10 8 × 11 76 F Supratentorial 44 29 × 25 29 × 24 38 × 34 37 × 32 36 F Supratentorial 46 13 × 10 13 × 9 13 × 10 13 × 9 62 F Infratentorial 47 34 × 36 34 × 35 34 × 36 34 × 36 48 F Supratentorial 66 15 × 11 15 × 10 16 × 12 15 × 11 55 F Supratentorial 60 27 × 17 25 × 15 26 × 17 25 × 15 84 F Infratentorial 60 12 × 8 13 × 7 12 × 8 13 × 8 69 M Supratentorial 61 32 × 21 32 × 20 32 × 20 32 × 20 72 F Supratentorial 64 8 × 10 9 × 10 8 × 10 9 × 10
(0,07), respectively. The difference in DN/pons ratio between the first and last scan was significantly > 0 (P < 0.05), with a mean value of 0.0931. Similar trends were observed for DN/cerebellum ratio (mean value = 0.0883) and GP/thalamus ratio (mean value = 0.058). The distribution of differences in DN/cerebellum, DN/pons, and GP/tha-lamus signal intensity ratios between thefirst and last MRI scan are shown inFig. 4. High signal intensities were observed in the DN and GP on axial pre-contrast T1-weighted images from a patient who received linear GBCA six times (Fig. 5).
4. Discussion
The majorfinding of this study is that the size of meningiomas in
post-contrast axial T1-weighted images was similar with that in pre-contrast axial T2-weighted images that is, both showed tumor growth. Our results also demonstrate that of DN/pons, DN/cerebellum, and GP/ thalamus signal intensity ratios increased with multiple administrations of linear non-ionic GBCAs in patients with normal renal function.
Meningiomas are easily diagnosed by enhanced brain MRI and show typical imagingfindings. Since brain MRI is widely used for diverse indications, most meningiomas are diagnosed incidentally. Those that are asymptomatic are routinely followed up with enhanced brain MRI [2], especially in elderly patients with co morbidities [2]. In general the size of the tumor is measured on post-contrast T1-weighted images and compared to that in the previous scan. In most cases untreated me-ningiomas followed up with brain MRI showed no progression of the lesion, and only a few cases with a tumor size smaller than 2 cm de-veloped symptoms during a median follow up period of 4.6 years, whereas 17% of patients with lesions > 3 cm developed symptoms during the follow up [16]. A study of 60 patients with asymptomatic meningiomas who were followed for 32 months revealed that none of the patients became symptomatic, 35 showed no progression, and 10 showed tumor growth at 2.4 mm/year [17]. In another report, four of 121 meningioma cases showed progression by serial brain MRI; 24 le-sions were calcified and none progressed or became symptomatic [18]. In the present study, the median follow up time was 36 months; six meningiomas in five patients showed progression but none of them became symptomatic, and calcified meningiomas did not show pro-gression, which is consistent with previous reports.
Increased signal intensity in the DN and GP on pre-contrast T1-weighted images was previously reported in patients with multiple sclerosis and brain irradiation history [19,20]. It's first reported by Kanda et al. that signal intensity of dentate nucleus on pre contrast T1 weighted images increases with six contrast enhanced brain MRIs with linear GBCAs [10]. Errante et al. found that dentate nucleus to pons signal intensity ratio increases with serial contrast enhanced brain MRI using linear GBCA in patients with multiple sclerosis and brain metas-tasis [21]. Ramalho et al. found increase in the signal intensity of dentate nucleus after four contrast enhanced brain MRIs with linear GBCA [22]. In the current study we also found increased signal in-tensity in the DN and GP on pre contrast T1 weighted images after minimumfive contrast enhanced brain MRIs with linear GBCA. In the current study the signal intensity increase in dentate nucleus and globus pallidus are similar with the previous studies. Our patients did not have a history of malignancy, head irradiation, or multiple sclerosis, unlike the patients in previous studies.
Gadolinium was found to be stored in the brain tissue of patients who received a minimum of four administrations of non-ionic linear GBCA [14], in the skin of a patient without renal dysfunction who had undergone 61 enhanced MRI scans with GBCAs [23], as well as in the bones [24]. McDonald et al. showed deposition of gadolinium in rats after both multiple and linear macro cyclic GBCA administration and they concluded that tissue deposition of gadolinium after usage of macro cyclic GBCA was lesser than linear GBCAs [24]. Kanda et al. and Radbruch et al. compared linear and macro cyclic GBCAs in different studies. They both found signal intensity increase in the dentate nucleus and globus pallidus on T1 weighted pre contrast images after serial linear GBCA usage but not by the macro cyclic GBCAs [11,12]. In our institution, a non-ionic linear GBCA (gadoversetamide) is routinely used unless the patient has renal dysfunction so we did not compare linear GBCA with macro cyclic GBCA.
The clinical effect of the gadolinium deposition in the brain is un-known. According to our knowledge in none of the previous studies gadolinium deposition in the brain was found to be associated with any clinical symptom. In the current study we did notfind any neurological symptom from the medical data of patients. There is e few studies about the value of Positron Emission Tomography (PET) as an alternative imaging technique in the diagnosis, treatment planning and diagnosis of meningioma recurrence [25].
Fig. 4. a. Box plot diagram showing median (IQR) DN/cerebellum signal in-tensity ratios from thefirst and last brain MRIs.
b. Box plot diagram showing median (IQR) DN/pons signal intensity ratios from thefirst and last brain MRIs.
c. Box plot diagram showing median (IQR) GP/thalamus signal intensity ratios from thefirst and last brain MRIs.
There are some limitations of the current studyfirstly our sample size was small, secondly we did not compare the linear gadolinium based contrast agents with macro cyclic gadolinium based contrast agents for deposition.
5. Conclusion
In the current study the size of meningiomas in post-contrast axial T1-weighted images was compatible with that in pre-contrast axial T2-weighted images that is, both showed tumor growth. We also observed gadolinium accumulation in the brain corresponding to the increase in signal intensity in the DN and GP with multiple administrations of linear GBCA. Although the clinical consequences are unknown gadoli-nium deposition could be avoided in patients with meningioma by using unenhanced brain MRI for follow up scans.
Conflicts of interest and source of funding There is no conflict of interest.
This research did not receive any specific grant from funding agencies in the public, commercial or not-for-profit sectors.
References
[1] Rockhill J, Mrugala M, Chamberlain MC. Intracranial meningiomas: an overview of diagnosis and treatment. Neurosurg Focus 2007;23:E1.
[2] Alexiou GA, Gogou P, Markoula S, Kyritsis AP. Management of meningiomas. Clin Neurol Neurosurg 2010;112:177–82.
[3] Bondy M, Ligon BL. Epidemiology and etiology of intracranial meningiomas: a re-view. J Neurooncol 1996;29:197–205.
[4] Longstreth Jr. WT, Dennis LK, McGuire VM, Drangsholt MT, Koepsell TD. Epidemiology of intracranial meningioma. Cancer 1993;72:639–48.
[5] Whittle IR, Smith C, Navoo P, Collie D. Meningiomas. Lancet 2004;363:1535–43. [6] Marosi C, Hassler M, Roessler K, Reni M, Sant M, Mazza E, et al. Meningioma. Crit
Rev Oncol Hematol 2008;67:153–71.
[7] Rokni-Yazdi H, Sotoudeh H. Prevalence of“dural tail sign” in patients with different intracranial pathologies. Eur J Radiol 2006;60:42–5.
[8] Yano S, Kuratsu J. Indications for surgery in patients with asymptomatic me-ningiomas based on an extensive experience. J Neurosurg 2006;105:538–43. [9] Nakamura M, Roser F, Michel J, Jacobs C, Samii M. The natural history of incidental
meningiomas. Neurosurgery 2003;53:62–70.
[10] Kanda T, Ishii K, Kawaguchi H, Kitajima K, Takenaka D. High signal intensity in the dentate nucleus and globus pallidus on unenhanced T1-weighted MR images: re-lationship with increasing cumulative dose of a gadolinium-based contrast material. Radiology 2014;270:834–41.
[11] Kanda T, Osawa M, Oba H, Toyoda K, Kotoku J, Haruyama T, et al. High signal intensity in dentate nucleus on unenhanced T1-weighted MR images: association with linear versus macrocyclic gadolinium chelate administration. Radiology 2015;275:803–9.
[12] Radbruch A, Weberling LD, Kieslich PJ, Eidel O, Burth S, Kickingereder P, et al. Gadolinium retention in the dentate nucleus and globus pallidus is dependent on the class of contrast agent. Radiology 2015;275:783–91.
[13] Kanda T, Fukusato T, Matsuda M, Toyoda K, Oba H, Kotoku J, et al. Gadolinium-based contrast agent accumulates in the brain even in subjects without severe renal dysfunction: evaluation of autopsy brain specimens with inductively coupled plasma mass spectroscopy. Radiology 2015;276:228–32.
[14] McDonald RJ, McDonald JS, Kallmes DF, Jentoft ME, Murray DL, Thielen KR, et al. Intracranial gadolinium deposition after contrast-enhanced MR imaging. Radiology 2015;275:772–82.
[15] McDonald RJ, McDonald JS, Dai D, Schroeder D, Jentoft ME, Murray DL, et al. Comparison of gadolinium concentrations within multiple rat organs after in-travenous administration of linear versus macrocyclic gadolinium chelates. Radiology 2017 Nov;285(2):536–45.
[16] Sughrue ME, Rutkowski MJ, Aranda D, Barani IJ, McDermott MW, Parsa AT.
Fig. 5. Axial pre-contrast T1 weighted images showing the typicalfinding of hyperintensities in DN and GP. Images were acquired from the first MRI (A,B) and sixth MRI (C,D) with linear GBCA.
Treatment decision making based on the published natural history and growth rate of small meningiomas. J Neurosurg 2010;113:1036–42.
[17] Olivero WC, Lister JR, Elwood PW. The natural history and growth rate of asymptomatic meningiomas: a review of 60 patients. J Neurosurg 1995;83:222–4. [18] Firsching RP, Fischer A, Peters R, Thun F, Klug N. Growth rate of incidental
me-ningiomas. J Neurosurg 1990;73:545–7.
[19] Roccatagliata L, Vuolo L, Bonzano L, Pichiecchio A, Mancardi G. Multiple sclerosis: hyperintense dentate nucleus on unenhanced T1-weighted MR images is associated with the secondary progressive subtype. Radiology 2009;251:503–10.
[20] Kasahara S, Miki Y, Kanagaki M, Yamamoto A, Mori N, Sawada T, et al. Hyperintense dentate nucleus on unenhanced T1-weighted MR images is associated with a history of brain irradiation. Radiology 2011;258:222–8.
[21] Errante Y, Cirimele V, Mallio CA, Di Lazzaro V, Zobel BB, Quattrocchi CC. Progressive increase of T1 signal intensity of the dentate nucleus on unenhanced magnetic resonance images is associated with cumulative doses of intravenously administered gadodiamide in patients with normal renal function, suggesting
dechelation. Invest Radiol 2014;49:685–90.
[22] Ramalho J, Semelka RC, AlObaidy M, Ramalho M, Nunes RH, Castillo M. Signal intensity change on unenhanced T1-weighted images in dentate nucleus following gadobenate dimeglumine in patients with and without previous multiple adminis-trations of gadodiamide. Eur Radiol 2016;26:4080–8.
[23] Roberts DR, Lindhorst SM, Welsh CT, Maravilla KR, Herring MN, Braun KA, et al. High levels of gadolinium deposition in the skin of a patient with normal renal function. Invest Radiol 2016;51:280–9.
[24] Murata N, Gonzalez-Cuyar LF, Murata K, Fligner C, Dills R, Hippe D, et al. Macrocyclic and other non-group 1 gadolinium contrast agents deposit low levels of gadolinium in brain and bone tissue: preliminary results from 9 patients with normal renal function. Invest Radiol 2016;51:447–53.
[25] Galldiks N, Albert NL, Sommerauer M, Grosu AL, Ganswindt U, Law I, et al. PET imaging in patients with meningioma - report of the RANO/PET group. Neuro Oncol 2017;19:1576–87.