FAKULTÄT MASCHINENBAU
Master of Science in Manufacturing TechnologyInstitut für Umformtechnik und Leichtbau Prof. Dr.-Ing. Dr. h.c. Matthias Kleiner Prof. Dr.-Ing. Dr.-Ing. E.h. A. Erman Tekkaya
Master Thesis
Experimental and Numerical Analysis of Deep Drawability
of Aluminium Alloys AA5754-H22 and AA6061-T6
by Onur Erbaş
Matriculation no: 162950
Supervisors:
Prof. Dr.-Ing. Dr.-Ing. E.h. A. Erman Tekkaya Assist. Prof. Dr. Mehmet İpekoğlu
M.Sc. Hamad ul Hassan
This Master thesis project is carried out by the collaboration between Technical University Dortmund, Turkish-German University and Mercedes-Benz Türk A.Ş., Istanbul. This thesis has been completed under guidance and constant supervision of Prof. Dr.-Ing. Dr.-Ing. E.h. A. Erman Tekkaya (Institut für Umformtechnik und Leichtbau, TU Dortmund) and Assist. Prof. Dr. Mehmet İpekoğlu (Dept. of Mechatronic Systems Engineering, Turkish-German University).
First and foremost, I would like to express my appreciation and thankfulness to my supervisor Prof. Dr.-Ing. Dr.-Ing. E.h. A. Erman Tekkaya, for motivating me all the time with innovative ideas in metal forming technology world.
I am deeply thankful Assist. Prof. Dr. Mehmet İpekoğlu for being my supervisor and providing valuable guidance and support. His continuous help and support in all stages has always made me confident.
I would like to express my gratefulness and appreciation to M.Sc. Hamad ul Hassan for his guidance, suggestions and invaluable help. Without his encouragement, this thesis would not have materialized.
I also would like to express my deep gratitude and respect to the team manager of the production planning department Onur Darcan and my colleagues Caner Sürel and Sultan Çil for their help, support and constructive criticism.
I also want to thank to the employees of the Institute of Metal Forming and Lightweight and Zwick Avrasya Ltd. for their help in performing experiments.
Finally, yet importantly, I would like to express my heartfelt thanks to my beloved parents and my sister for their help and wishes for my success. Without their support, it would have been impossible for me to finish university easily.
In the recent years sheet metal forming technologies are challenged by the higher fuel economy and concerns about global warming in the automotive industry. Deep drawing is one of the most commonly used sheet metal forming process in automotive industry. Lighter and safer materials are used for automotive production to reduce the weight of vehicles. Aluminium alloys, due to their low density compared to steels, are an important group of materials, in particular for light weight construction of transport vehicles.
The primary purpose of this master thesis is to determine deep drawability of two different aluminium alloys. It discusses the right material to deep draw an emergency valve cup on the bus side panel. Therefore, suitable process parameters and possible cup position according to the edge of the sheet panel are chosen for required quality of the product.
In order to estimate the formability of two different aluminium alloys, they are firstly characterized with tensile and Nakajima test. Then deep drawing experiment with different process parameters is carried out to produce emergency valve cup. The experimental investigation is followed by a numerical analysis which investigates deep drawing process through simulation software.
Keywords: Deep Drawing, Deep Drawability, Thickness Distribution, Blankholder
Table of Contents
List of Figures iii
List of Tables vii
Formula Symbols and Abbreviations ix
1 Introduction 1
1.1 Motivation and Objective of the Thesis ... 2
1.2 Outline of the Thesis ... 3
2 State of the Art 5 2.1 Metal Forming ... 5
2.1.1 Bulk Metal Forming ... 6
2.1.2 Sheet Metal Forming ... 7
2.2 Deep Drawing ... 9
2.2.1 Mechanics of Deep Drawing ... 9
2.2.2 Stress Zones of Deep Drawing ... 12
2.2.3 Engineering Analysis of Deep Drawing ... 13
2.2.4 Formability in Deep Drawing ... 15
2.2.5 Deep Drawing Operations ... 17
2.2.6 Defects in Deep Drawing ... 18
2.3 Aluminium and Aluminium Alloys ... 19
2.3.1 Comparison of Aluminium and Steel ... 20
2.3.2 Aluminium and Aluminium Alloys in Automotive Industry ... 21
2.3.3 Aluminium Alloys AA5754-H22 and AA6061-T6 ... 23
3 Aim and Scope of the Thesis Work 26 4 Experiments for Material Characterization 28 4.1 Tensile Test ... 28
4.1.1 Specimen Preparation ... 28
4.1.3 Results ... 31
4.2 Nakajima Test ... 36
4.2.1 Specimen Preparation ... 36
4.2.2 Experimental Setup ... 38
4.2.3 Results ... 40
5 Deep Drawing Experiment 43 5.1 Experimental Setup ... 43
5.2 Results ... 46
5.2.1 Thickness Distribution of the Drawn Parts ... 46
5.2.2 Straightness of the Edge of the Drawn Parts ... 52
6 Numerical Analysis 55 6.1 Introduction to Finite Element Analysis and AutoForm ... 55
6.2 Modeling of the Deep Drawing Experiment ... 56
6.3 Results ... 61
6.3.1 Thickness Distribution of the Drawn Parts ... 62
6.3.2 Forming Limit Diagram and Wrinkling Analysis of the Drawn Parts ... 64
6.3.3 Comparison of Deep Drawing Experiment and Simulation Results ... 69
6.3.4 The Effect of Lubrication and Mesh Size on Simulation Results ... 73
7 Cost Analysis 76
8 Conclusion 79
List of Figures
Figure 1.1: Three dimensional view of the deep drawn part ... 3
Figure 2.1: Classification of metal forming operations (Groover, 2012) ... 5
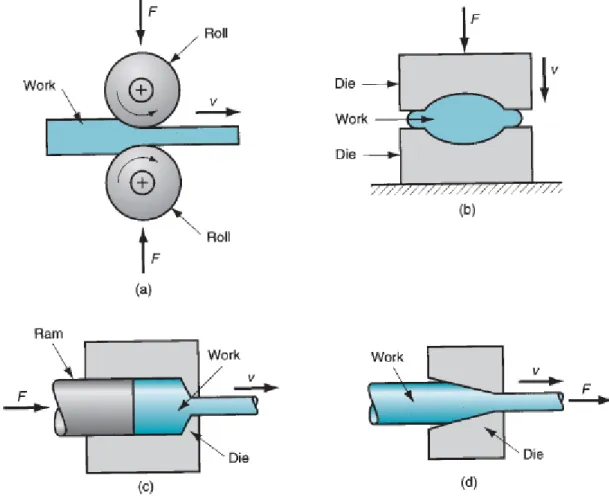
Figure 2.2: Basic bulk deformation processes: (a) rolling, (b) forging, (c) extrusion, and (d) drawing (Groover, 2012) ... 6
Figure 2.3: Basic sheet metal working operations: (a) bending, (b) drawing, (c) shearing: (1) as punch first contacts sheet, and (2) after cutting (Groover, 2012) .... 8
Figure 2.4: (a) Drawing of a cup-shaped part: (1) start of operation before punch contacts work, and (2) near end of stroke; and corresponding workpiece: (1) starting blank (2) drawn part (Groover, 2012) ... 10
Figure 2.5: Stages in deformation of the work in deep drawing: (1) punch makes initial contact with work, (2) bending, (3) straightening, (4) friction and compression, and (5) final cup shape (Groover, 2012) ... 11
Figure 2.6: Stresses at drawn cup in deep drawing process ... 12
Figure 2.7: Important variables in deep drawing (Boljanovic, 2004) ... 13
Figure 2.8: Tensile test specimen directions... 16
Figure 2.9: Characteristic limit curves and zones of forming limit diagram (Tisza and Kovács, 2012) ... 17
Figure 2.10: Common defects of drawn parts: (a) flange wrinkling, (b) wall wrinkling, (c) tearing, (d) earing, and (d) surface scratches (Groover, 2012) ... 19
Figure 2.11: Average aluminium content per car by years (EAA) ... 22
Figure 2.12: Classification of wrought aluminium alloys (Alumatter) ... 23
Figure 4.1: Tensile test specimen ... 28
Figure 4.2: Set of tensile test specimens (AA6061-T6, 0°) ... 29
Figure 4.3: Zwick Roell Z250 tensile test machine and the specimen gripped to jaws ... 30
Figure 4.4: AA5754-H22 45° tensile test specimen: a) before the tensile test b) after
the tensile test ... 30
Figure 4.5: True stress-strain diagram for AA5754-H22 and AA6061-T6 ... 31
Figure 4.6: Flow curve of AA5754-H22 ... 34
Figure 4.7: Flow curve of AA6061-T6 ... 35
Figure 4.8: Extrapolated flow curves of AA5754-H22 and AA6061-T6 ... 36
Figure 4.9: General Nakajima test specimen ... 37
Figure 4.10: Nakajima test specimens ... 37
Figure 4.11: Zwick Roell BUP1000 machine... 38
Figure 4.12: Nakajima test specimen: a) before the Nakajima test b) after the Nakajima test ... 39
Figure 4.13: Photos of specimen which is attached to the BUP1000 machine: a) before the fracture b) after the fracture ... 40
Figure 4.14: Strain distribution of AA6061-T6 before the fracture: a) major strain b) minor strain ... 41
Figure 4.15: Forming limit curves of AA5754-H22 and AA6061-T6 ... 42
Figure 5.1: Distance of cup center to the edge of the die: a) 130 mm b) 80 mm ... 43
Figure 5.2: Tool setup for deep drawing ... 44
Figure 5.3: CAD drawing of deep drawing tool setup ... 45
Figure 5.4: Stages of deep drawing experiment: (1) positioning (2) initial contact .... 46
Figure 5.5: The aluminium alloy specimen for thickness measurement ... 46
Figure 5.6: Preparation of the specimen for thickness measurement: (1) first cut (2) second cut (3) third cut ... 47
Figure 5.7: Thickness measurement setup and the specimen under microscope ... 47
Figure 5.8: Cross section of the deep drawn part with different thickness measurement points ... 48
Figure 5.9: AA5754-H22 thickness distribution with different blankholder forces for
80 mm distance away from the cup center to the edge of die ... 49
Figure 5.10: AA6061-T6 thickness distribution with different distances away from the
cup center to the edge of die for 200 kN blankholder force ... 50
Figure 5.11: Thickness distribution of AA5754-H22 and AA6061-T6 for 200 kN and
2000kN blankholder force with 100 mm distance away from the cup center to the edge of die ... 51
Figure 5.12: The edge of the drawn cup in flange area with different distances away
from the cup center to the edge of die: a) 130 mm distance b) 80 mm distance ... 52
Figure 6.1: 3D finite element model of the deep drawing ... 56 Figure 6.2: Process generator for deep drawing process in AutoFormplus R3: 1) gravity
2) closing 3) drawing ... 57 Figure 6.3: Material chart for AA6061-T6 in AutoFormplus R3 ... 59
Figure 6.4: Mesh properties in AutoFormplus R3: a) accuracy of the mesh ... 60
Figure 6.5: Meshing in AutoFormplus R3: a) mesh of the sheet before deep drawing
b) meshing of the deep drawn cup ... 61 Figure 6.6: Thickness distribution of deep drawn part for 200 kN blankholder force
and 80 mm distance away from the cup center to the edge of die: a) AA5754-H22
b) AA6061-T6 ... 62 Figure 6.7: Thinning distribution of deep drawn part for 2000 kN blankholder force
and 80 mm distance away from the cup center to the edge of die: a) AA5754-H22
b) AA6061-T6 ... 63 Figure 6.8: Formability regions of forming limit diagram ... 64 Figure 6.9: Forming limit diagrams of both aluminium alloys with 80 mm distance
away from the cup center to the edge of die and 200 kN blankholder force:
Figure 6.10: Forming limit diagrams of both aluminium alloys with 80 mm distance
away from the cup center to the edge of die and 2000 kN blankholder force:
a) AA5754-H22 b) AA6061-T6 ... 66 Figure 6.11: Forming limit diagrams of AA5754-H22 with 200 kN blankholder force: a) 80 mm distance away from the cup center to the edge of the die b) 130 mm distance
away from the cup center to the edge of the die ... 67
Figure 6.12: Forming limit diagram with ... 68 Figure 6.13: Thickness distribution of AA5754-H22 and AA6061-T6 for 200 kN
blankholder force with 80 mm distance away from the cup center to the edge of die for both experiment and simulation ... 70
Figure 6.14: Thickness distribution of AA5754-H22 for 200 kN and 2000 kN
blankholder force with 100 mm distance away from the cup center to the edge of die for both experiments and simulations ... 71
Figure 6.15: Thickness distribution of AA5754-H22 for 200 kN and 100 mm distance
away from the cup center to the edge of die for different friction coefficients ... 74
Figure 6.16: Thickness distribution of AA5754-H22 for 200 kN and 100 mm distance
away from the cup center to the edge of die for different mesh sizes ... 75
List of Tables
Table 2.1: Comparison of physical and mechanical properties of aluminium and steel
... 20
Table 2.2: Alloy choice for automotive panels: Europe vs. North America (Miller et al., 2000) ... 23
Table 2.3: Chemical composition of AA5754-H22 and AA6061-T6 in percentage (%) (Aalco) ... 25
Table 2.4: Physical properties of AA5754-H22 and AA6061-T6 (Aalco) ... 25
Table 2.5: Mechanical properties of AA5754-H22 and AA6061-T6 (Aalco) ... 25
Table 4.1: Tensile test specimen dimension ... 28
Table 4.2: Elastic modulus and yield stress and ultimate tensile strength of each specimen configuration ... 32
Table 4.3: The r value, average and planar anisotropy values of each specimen configuration ... 33
Table 4.4: Strain-hardening exponent and strength coefficient values of each specimen configuration ... 33
Table 4.5: Nakajima test specimen dimensions ... 37
Table 5.1: Deep drawing experiment parameters ... 43
Table 5.2: Dimensions of deep drawing tool setup ... 45
Table 5.3: Gap distances of AA5754-H22 and AA6061-T6 for different distances of cup center to the edge of the die and different blankholder forces ... 53
Table 6.1: Maximum wrinkling criterion strain values of AA5754-H22 and AA6061-T6 for different distances of cup center to the edge of the die and blankholder forces 69 Table 6.2: Deep drawing simulation parameters ... 73
Table 7.1: Cost of the hollow part of fuel filler flap panel with purchase and adhesive bonding ... 77
Table 7.2: Cost of the hollow part of fuel filler flap panel with deep drawing ... 77 Table 7.3: Total cost saving of with the deep drawn part with production instead of
Formula Symbols and Abbreviations
Formula SymbolsSymbol Unit Description
F N Force D mm Diameter R mm Radius c mm Clearance t mm Thickness r - Anisotropy coefficient ɛ - Strain L mm Length
E GPa Young’s modulus
RP0.2 MPa Yield stress
Rm MPa Tensile strength
n - Strain hardening exponent
K MPa Strength coefficient
kf MPa Flow stress
φ - True strain
P Pa Pressure
A mm2 Area
R - Average anisotropic exponent
Indices Indice Description 0° Rolling direction 45° Diagonal direction 90° Transverse direction l Length direction t Thickness direction w Width direction
Abbreviations
Abbreviation Description
ACEA European Automotive Manufacturers Association
ICCT International Council of Clean Transportation
EAA European Aluminium Association
AA Aluminium Association
DR Drawing Ratio
FLD Forming Limit Diagram
FLC Forming Limit Curve
IADS International Alloy Designation System
PLC Portevin-Le Chatelier
FEM Finite Element Method
CAD Computer Aided Design
3D Three-Dimensional
1 Introduction
Sheet metal forming is one of the manufacturing processes, in which plastic deformation is used to change the shape of the flat metal sheet. It is used in almost every sector of industrial production such as automotive, aircraft, home appliance and food industry.
In the recent years automotive industry became economically and socially more significant compared to the other industries. According to the European Automotive Manufacturers Association (ACEA) 63.1 million passenger cars and 31 million commercial vehicles have been produced around the world in 2012. Now 1 billion vehicles are on the road, which is expected to reach 1.7 billion by the International Council of Clean Transportation. (ICCT)
Sheet metal forming technologies are challenged by the improvements in the automotive industry in the last several decades. More successful and economical production is the unavoidable result of increasing demands of the customer, safety requirements and market competitions. On the other hand, in recent years, environmental and safety concerns leads the industry to develop innovative new materials. (Tisza, 2013) Lighter and safer materials are used for automotive production to reduce the weight of vehicles.
Aluminium alloys, due to their low density compared to steels, are an important group of materials, in particular for light weight construction of transport vehicles. The more aluminium is used in the production of a vehicle, the less is the weight of the vehicle and the less is the fuel consumption. (Kleiner et al., 2003) European Aluminium Association (EAA) evaluates that 10% of vehicle weight reduction improves 8–10% of fuel economy. With the rising demand for environment-friendly vehicles, besides steel as a structural material, aluminium alloys in automobiles are recently also widely used in car manufacturing mostly for body production. Aluminium usage in automotive industry has grown more than 50% in the final 10 years. According to EAA (2012), the average amount of aluminium used in a vehicle produced in Europe is 140 kg.
Deep drawing is one of the most commonly used processes in sheet metal forming. According to DIN8584 deep drawing is where a sheet metal blank is formed into a hollow body open on one side or a hollow body is formed into a hollow body with a smaller cross section. This production process is used for mass production and for manufacturing of small series, such as packaging, aircraft and automotive industry. It is applied in automotive industry for the manufacturing of the vehicle body parts. (Lange, 2006)
The important variables in deep drawing are the sheet metal material, ratio of blank to punch diameter, radius of die and punch corner, blankholder force, and lubrication. Blankholder is one of the most important parameters to avoid wrinkling and tearing in the deep drawn part. (Groover, 2012)
In the deep drawing process, it is important to optimize the process parameters to obtain a product with required quality. To achieve the optimization, a large number of trials can be performed with various parameters to obtain the best result. (Ramesh and Reddy, 2013) Experimental investigations should be supported with numerical analyses such as simulations, because it is not always possible to realize all experiments. Apart from that, various other configurations of the deep drawing experiments can be investigated. Numerical investigations serve the validation of the experimental investigations.
1.1 Motivation and Objective of the Thesis
The motivation behind the thesis is to choose between two different materials for deep drawing process in terms of deep drawability to produce the emergency valve cavity on bus side panel with required quality by reducing the production cost and time.
Figure 1.1: Three dimensional view of the deep drawn part
This motivation can be achieved through characterization of two different aluminium alloys AA5754-H22 and AA6061-T6, deep drawing experiment with different process parameters and its numerical analysis with a simulation software. The main objective of the thesis is to find out the best suitable material among the two options for the deep drawing, determine the required process parameters and determine a possible cavity position according to the edge of the sheet panel.
1.2 Outline of the Thesis
There are eight chapters in this thesis work. The thesis structure is organized as follows:
Chapter 1. Introduction
This chapter gives a general introduction and outline for the motivation and objective behind this thesis.
Chapter 2. State of the Art
This chapter gives an overview about the state of the art of subjects such as metal forming, deep drawing and aluminium and aluminium alloys. The metal forming processes which are bulk and sheet metal forming are briefly explained, whereas the
deep drawing is described in detail. Except the mechanics and engineering analysis of the deep drawing, detailed information about different operations and possible defects are given with the formability in deep drawing. Moreover, this chapter contains information about aluminium, aluminium alloys, AA5754-H22 and AA6061-T6 in automotive industry.
Chapter 3. Aim and Scope of the Thesis Work
This chapter describes the aim and scope of the thesis work.
Chapter 4.Experiments for Material Characterization
This chapter covers two different experiments to characterize AA5754-H22 and AA6061-T6, namely the tensile test and Nakajima test. Both tests include specimen preparation, experimental setup and results sections.
Chapter 5. Deep Drawing Experiment
This chapter includes the deep drawing experiment with different process parameters and materials to produce the desired part. It contains the experimental setup and the results of the experiments.
Chapter 6. Numerical Analysis
This chapter is devoted to the numerical analysis of the deep drawing experiments. First, it gives a short introduction about finite element analysis and the simulation software AutoForm which is used in the thesis. Next, the finite element model is described in detail and after that the results of the simulations are given. In the end of the chapter, simulation results, a comparison of the results with the results of the deep drawing experiments and further simulation investigations are discussed.
Chapter 7. Cost Analysis
This chapter contains cost analysis which explains the cost saving attained if the emergency valve cavity on bus panel is deep drawn instead of purchased.
Chapter 8. Conclusion
This chapter presents the conclusions of the thesis work and contains recommendations for further studies.
2 State of the Art
2.1 Metal Forming
Forming is defined as a group of manufacturing methods where the given shape of a workpiece is converted into another shape without altering its mass or material composition. Deformation is caused by the die which applies stresses more than the yield strength of the metal. The geometry of the die shapes the metal. Metal forming is basically divided into two main groups based on the workpiece thickness; bulk metal forming and sheet metal forming. In both processes, the surfaces of the deforming metal and the tools are in contact. In bulk forming, the input material is in billet, rod, or slab form. (Simiatin, 2005) In sheet metal forming, on the other hand, a piece of sheet metal is plastically deformed by forces, often without important changes in sheet thickness. (Lange, 2006) Figure 2.1 illustrates how metal forming processes are classified.
Figure 2.1: Classification of metal forming operations (Groover, 2012)
Metal forming
Bulk deformation
Rolling processes Forging processes Extrusion processes
Wire and bar drawing
Sheet metalworking
Bending operations Deep or cup drawing
Shearing processes Miscellaneous
2.1.1 Bulk Metal Forming
Bulk forming is one the manufacturing processes in which plastic deformation is used to change the shape of the metal workpiece between tools or dies. Bulk forming processes involve significant amounts of plastic deformation. The cross section of workpiece changes without volume change. The surface-area-to-volume ratio is relatively small. The term bulk describes the workpiece that has this low area-to-volume ratio. Mostly, hot or warm working conditions are preferred. Basic bulk deformation processes are shown Figure 2.2.
Figure 2.2: Basic bulk deformation processes: (a) rolling, (b) forging, (c) extrusion,
and (d) drawing (Groover, 2012)
Rolling
In rolling, thickness of a slab or plate is reduced by two rotating cylindrical rolls. The rolls draw the workpiece into the gap and squeeze it. Most rolling processes require
high investments such rolling mills as equipment. Most of the rolling processes are hot working processes as large amount of deformation is needed. (Groover, 2012)
Forging
In forging, the workpiece is compressed between two opposing dies. The shape of the die is imparted to workpiece. It is widely used in industry to produce parts with different high strengths for automotive and other applications. Most of the operations are carried out hot or warm to reduce strength and increase ductility. (Groover, 2012)
Extrusion
In extrusion, the workpiece is forced to flow through a die opening taking its own cross section. It is a compression process which has many advantages such as shape variety, close tolerances and near or net shape forming. (Groover, 2012)
Drawing
In drawing, the diameter of a wire or bar is reduced by pulling it through a die opening. The process is similar to extrusion, the only difference is that the material is pulled through the die. Compressive stresses are important as well as tensile stresses as the metal is squeezed down while passing through the die. Drawing is called “bar drawing” when the stock materials is a large diameter bar and rod. In wire drawing small diameter stock is used. (Groover, 2012)
2.1.2 Sheet Metal Forming
Sheet metal forming deals with plastic deformation of metallic material with a high cross section to volume ratio. The workpieces used are metal sheets, strips and coils. In this process the cross section of the workpiece does not change, only the form of the workpiece changes. It is carried out with two tools called a punch and a die. Sheet metal forming has generally two types, cold forming which is carried out at room temperature and hot forming in which material is heated to higher temperatures than the recrystallization temperature of the metal that is being formed. Basic sheet deformation processes are shown Figure 2.3.
Figure 2.3: Basic sheet metal working operations: (a) bending, (b) drawing, (c) shearing: (1) as punch first contacts sheet, and (2) after cutting (Groover, 2012) Bending
Bending is the straining of sheet metal around a straight axis. When it is considered that the metallic sheet has a neutral axis, the material inside is compressed while the outside material is stretched. The deformation of metal is plastic in nature thus making it permanent after the stress is removed. The change of sheet thickness in bending is negligible. V-bending and edge bending are two common methods of bending process. Sheet metal workpieces are bent to produce final desired shapes but since plastic and elastic deformation occurs during bending, springback effect occurs. When force is removed from the workpiece material due to the elasticity of the material it tends to recover its original shape. The most common problem in bending process is springback. (Groover, 2012)
Drawing
Drawing is a process used to form a sheet metal in various shapes such as cup, box, complex or hollow parts. It is carried out by pressing a sheet of metal over a die cavity with the help of a punch. The punch has the same shape but different size than die cavity. Die cavity is just sufficient to allow the sheet to be pushed by the punch into the die. The sheet metal takes the form of the die which is mostly cylindrical. (Groover, 2012)
Sheet metal cutting
Sheet metal cutting is done by either shearing or punching of the sheet metal. In shearing, the punch compresses the metal which results in plastic deformation followed by penetration of the punch and finally it ends in the fracture of the sheet metal. In blanking cutting is carried out along a closed outline in single step to separate the piece from the surrounding. The part that is cut out is the desired part in blanking and it is scrap in punching. They both have the same principles. (Groover, 2012)
2.2 Deep Drawing
Deep drawing is a manufacturing process of forming sheet metals into geometrical or irregular shapes. The sheet metal is forced by a punch to flow between surfaces of a punch and a die. (Boljanovic, 2004)
2.2.1 Mechanics of Deep Drawing
A basic drawing operation of a cup-shaped sheet metal part can be seen in Figure 2.4. The blank diameter is Db is drawn into a die with a Dp punch diameter. Both punch and die have the corner radii which are respectively, Rp and Rd. There is a clearance c between the sides of the punch and die. The punch applies a downward force F which causes deformation and in the same time a downward holding force is applied to the blankholder, Fh. (Groover, 2012)
Figure 2.4: (a) Drawing of a cup-shaped part: (1) start of operation before punch
contacts work, and (2) near end of stroke; and corresponding workpiece: (1) starting blank (2) drawn part (Groover, 2012)
As the punch moves downward to the final position, the workpiece is formed with the shape of the punch and die cavity. The stages of deep drawing are illustrated in
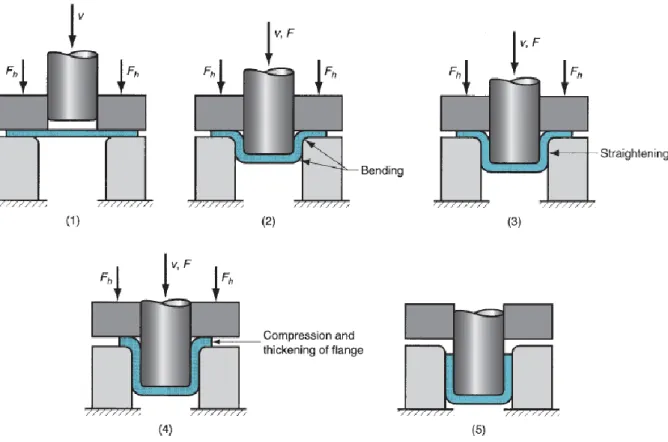
Figure 2.5: Stages in deformation of the work in deep drawing: (1) punch makes
initial contact with work, (2) bending, (3) straightening, (4) friction and compression, and (5) final cup shape (Groover, 2012)
At step 1, the blankholder force Fh is applied and the punch begins to move towards the sheet material. In the next step, the sheet material is exposed to a bending operation. The sheet is bent over the corner of the punch and the corner of the die. In the third step, the punch keeps moving down and in the same time a straightening in the metal appears that was previously bent over the die radius. The sheet metal from the flange is drawn into the die opening to form the cylinder wall. In step 4, as the metal in the flange moves to the center, it is exposed to three different states of stress: First one is compression in the circumferential direction. Second one is the tension in the radial direction and third one is a relatively small compression in the thickness direction. Since the metal volume remains constant, and since the circumferential stress is relatively large, the sheet will be thicker as it moves in the flange area. With the downward motion of the punch, metal flow caused by drawing and compression, continues. Some thinning in the cylinder walls occurs as well. Final step shows the completed drawing process. (Groover, 2012)
2.2.2 Stress Zones of Deep Drawing
Deep drawing is defined as a tensile-compressive forming among sheet metal forming processes. During deep drawing, because of punch and blankholder force, different stress zones are formed such as force application zone at the punch region, force transmission zone and bending zone at the cup wall and forming zone at the flange. (Yalçın, 2010)
Tensile stress is produced along the surface at different points, and it has maximum value near the end of the punch. The sheet does not bend along the cup wall, and near the punch profile necking occurs. The flange is subjected to compressive hoop stress, radial tensile stress and compressive stress due to blank holder. The wall thickness decreases from top to bottom. In the Figure 2.6 the stress distribution along the profile is shown.
Figure 2.6: Stresses at drawn cup in deep drawing process
The flange of drawn cup is exposed to a compressive hoop stress because it is drawn towards the center and radial tensile stress. The compressive stress of the blankholder acts in the axial direction. If the compressive hoop stress is high or if the metal in the flange is not restricted, wrinkling of the metal in the flange occurs. The flange faces
compressive hoop stress and a radial tensile stress. As a result, the flange tends to swell because of the circumferential shrinking. However, because of bending under the punch and die profile, the metal undergoes thinning. The pressed metal at the center of the blank is exposed to biaxial tensile stress because of the punch. The metal in the gap between die wall and punch is subjected to longitudinal and hoop tensile stresses. (Schüler, 1998)
2.2.3 Engineering Analysis of Deep Drawing
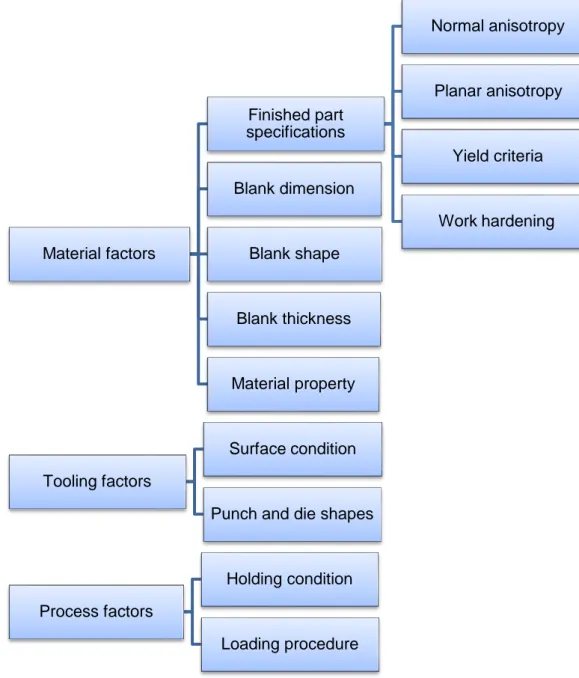
In deep drawing there are several factors affecting the process. They are categorized into three main groups which are shown below in the Figure 2.7.
Figure 2.7: Important variables in deep drawing (Boljanovic, 2004)
Material factors Finished part specifications Normal anisotropy Planar anisotropy Yield criteria Work hardening Blank dimension Blank shape Blank thickness Material property Tooling factors Surface condition Punch and die shapes
Process factors
Holding condition Loading procedure
The guidance to analyse deep drawing is some calculations of clearance, drawing ratio, reduction, thickness-to-diameter ratio, drawing force and holding force.
Clearance
There is a clearance c between the sides of the punch and die. This clearance must be about 10% greater than the sheet thickness.
(2.1)
Drawing ratio
Failure in deep drawn parts results from thinning of the cup wall under high tensile stresses most of the time. It should resist thinning under the stresses. Deep drawability is indicated by the drawing ratio. (Kalpakjian & Schmid, 2007)
Drawing ratio (DR) is defined as the ratio of the blank diameter Db to the punch diameter Dp for cylindrical shape.
(2.2) Upper limit for drawing ratio is 2.0, although the actual limit should consider die corner radii, friction conditions, depth of drawing and characteristics of the sheet metal such as ductility.
Reduction
Reduction is related to the drawing ratio. Upper limit for reduction should be less than 0.50.
(2.3)
Thickness-to-diameter ratio
This ratio is thickness of the starting blank t divided by the blank diameter Db. t/Db is expressed as percent and it is desired to have a value higher than 1%.
Drawing force
The force needed to draw the sheet metal can be calculated by the formula given below:
( ) ( ) (2.4) F is drawing force in N; t is original blank thickness in mm; TS is tensile strength in MPa; and Db is blank diameter in mm; and Dp is punch diameter in mm.
Holding force
The holding force in drawing operation can be calculated by the formula given below: * ( ) + (2.5) Fh is holding force in N; Y is yield strength of the sheet metal in MPa; t is starting sheet
thickness in mm and Rd is corner radius in mm. (Groover, 2012)
2.2.4 Formability in Deep Drawing
There are some tests to estimate the formability of sheet metals. The main two groups of tests are experimental and numerical analysis. For experimental analysis, mechanical tests such as tensile or Nakajima tests are carried out. (Tekkaya et al., 2000) The numerical analysis investigates the formability through simulation software.
Anisotropy
Anisotropy is a parameter to evaluate the formability of sheet materials. The reason that materials show anisotropic characteristics is crystallographic structure, which is produced by elements such as grain boundaries or phases. (Lange & Pöhlandt, 1985) The uniaxial tensile test is executed to obtain the r value. The anisotropy coefficient, r is the ratio of width strain to thickness strain.
r = (2.6)
The anisotropy coefficient changes with longitudinal strain during the tensile test. Therefore a particular strain value e.g. in ɛ = 15% is can be taken in measurements. Isotropic materials have an r value of 1. If the anisotropy coefficient is higher than 1, the material mainly flows in the width direction and possesses a high resistance to plastic flow in the direction of the sheet thickness. Otherwise, the sheet material tends to flow in the thickness direction. Most of the sheet metals show different properties with rolling (0⁰), diagonal (45⁰) and transverse (90⁰) directions of the coil (see Figure
Figure 2.8: Tensile test specimen directions
The average anisotropy is calculated through the sum of the anisotropy coefficient in rolling (r0⁰), 2 times diagonal (r45⁰) and transverse (r90⁰) divided by 4.
(2.7) If the material has a low average anisotropy coefficient it thins more than a material with a high anisotropy coefficient. From this reason high anisotropy corresponds to good deep drawability, which means deeper drawn parts.
Another term to define the anisotropy is the planar anisotropy. The subtraction of two times r45⁰ value from the sum of the r0⁰ and r90⁰ is divided by 4 indicates planar
anisotropy.
(2.8) The earing tendency increases as the planar anisotropy increases.
Forming Limit Diagram
The forming limit diagram (FLD) predicts the formability and the safety limit of a material in sheet metal forming processes. It includes failure limits for principal strain ratios/strain paths from equibiaxial tension/stretch forming, plane strain and uniaxial strain. It also covers the strain limit where necking begins for different principal strain ratios. The FLD can be obtained both theoretically and experimentally. Many researchers have developed different experimental methods with changing the shape and size of the specimens used in the tests such as limit dome height (LDH) test, Marciniak test or Nakajima test. The main advantage of the Nakajima test is that the
forming tool is very simple and it also allows the determination of the FLC on the whole usual domain of the strains. (Altan and Tekkaya, 2012)
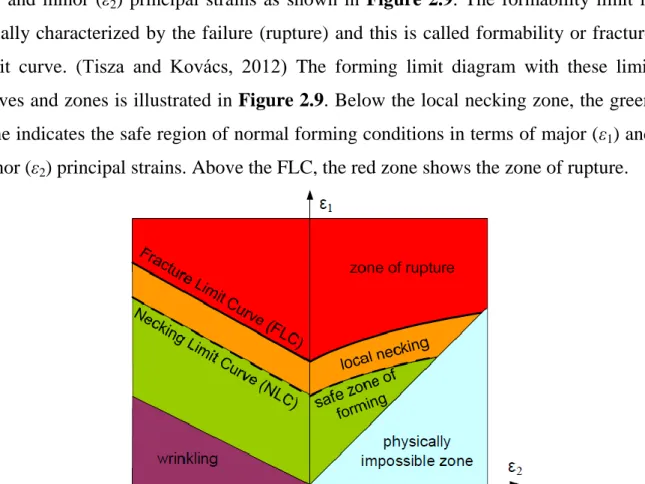
Forming limit diagrams show the formability limits in the coordinate system of major (ε1) and minor (ε2) principal strains as shown in Figure 2.9. The formability limit is
usually characterized by the failure (rupture) and this is called formability or fracture limit curve. (Tisza and Kovács, 2012) The forming limit diagram with these limit curves and zones is illustrated in Figure 2.9. Below the local necking zone, the green zone indicates the safe region of normal forming conditions in terms of major (ε1) and minor (ε2) principal strains. Above the FLC, the red zone shows the zone of rupture.
Figure 2.9: Characteristic limit curves and zones of forming limit diagram (Tisza and
Kovács, 2012)
2.2.5 Deep Drawing Operations
There are other variations of basic deep drawing of a cylindrical shape which is operated by blankholder in a single step.
Redrawing
If the drawing ratio for a required shape is too high, then the drawing should be completed in more than one step. The further drawing steps are referred as redrawing. For the initial drawing step, the maximum reduction of starting blank should be 40% to 45%, for the second drawing which is the first redrawing process it should be 30% and for the further steps, the reduction should be 16%. (Groover, 2012)
Reverse Drawing
When the drawn part is placed upside down on the die to achieve a second drawing operation, it is called reversed drawing. The reverse redrawing is an easier process when compared to drawing. The reason is that the sheet metal is bent in the same direction in the outside and inside corners of the die in reverse drawing and it causes less strain hardening and drawing force. (Groover, 2012)
Ironing
The flange of the deep drawn part is compressed by squeezing of the blank perimeter which pursues a smaller circumference. Due to compression the sheet metal close to the outer edge of blank becomes thicker while moving forward. If the thickness of the stock is bigger than the drawing clearance, it will be ironed and squeezed to the clearance size. (Groover, 2012)
Various Other Drawing Operations: Shallow or tolerable depths may be used to
create some specific types of parts. A part of them contains drawing, stretching or mixing of those operations. With male or female dies, parts may be embossed, which means the process of the shallow draws made on a sheet with matching male and female dies. This method is used mostly for decorative purposes. (Kalpakjian & Schmid, 2007)
At some processes the part can be drawn without a blankholder. If the thickness of the sheet metal is enough to avoid wrinkling, the deep drawing process may be applied without a blankholder. In that case, the dies should be specifically modeled. (Kalpakjian & Schmid, 2007)
Drawbead: It is often necessary to use drawbeads during deep drawing in order to
control the material flow. During the process, drawbeads limit the flow of the sheet metal by bending and unbending. The beaded sheet has a higher precision and less prone to wrinkle, which reduces the amount of blackholder forces required.
2.2.6 Defects in Deep Drawing
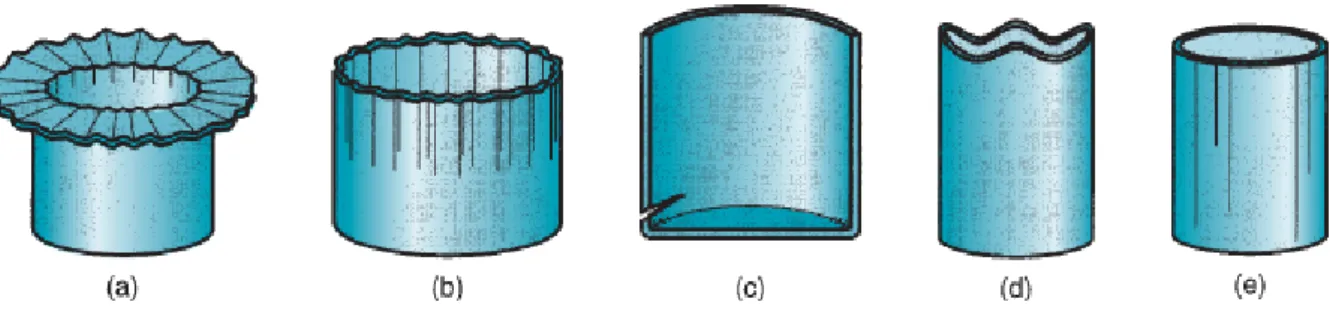
Deep drawing operation is more complex than other sheet metal operations, which can cause some defects in the drawn parts which can be seen below in Figure 2.10.
Figure 2.10: Common defects of drawn parts: (a) flange wrinkling, (b) wall
wrinkling, (c) tearing, (d) earing, and (d) surface scratches (Groover, 2012)
Wrinkling in the flange
They are radially formed ridges in the not drawn part of the sheet metal because of the compressive stresses.
Wrinkling in the wall
When the wrinkled flange is drawn, the ridges occur in the vertical wall of the part.
Tearing
It is an open crack which is located in the vertical wall mostly close to the bottom of the drawn part. The reason for tearing is high tensile stresses which lead to thinning. Another reason can be drawing the part from a sharp die corner.
Earing
Anisotropy causes formation of irregularities such as earing, in the upper edge of drawn sheet metal. Isotropic materials do not have this defect.
Surface scratches
If the lubrication is not sufficient or the die and punch are not smooth, in surface some scratches can be observed on the surface. (Groover, 2012)
2.3 Aluminium and Aluminium Alloys
Sheet metal forming processes, especially deep drawing process is strongly dependent on the materials used. After iron, aluminium is now the second most widely used metal in the world. Aluminium and aluminium alloys have a relatively low density (2.7 g/cm3), superior malleability, good thermal and electrical conductivity, and excellent corrosion resistance in some common environments. Because of the high ductility, most of them are easily formed. Its ductility is preserved at low temperatures as well. (Callister, 2007)
2.3.1 Comparison of Aluminium and Steel
Steel and aluminium are extensively used materials with a large range of applications. Steel is an alloy, and on the other hand aluminium is an element. However, aluminium is usually mixed with other elements and become an alloy to prevent chemical reactions. Some properties of both materials can be found in Table 2.1.
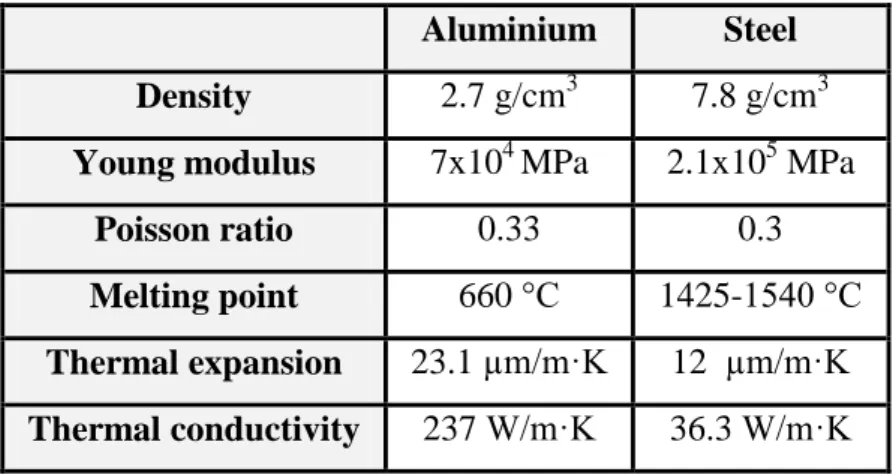
Table 2.1: Comparison of physical and mechanical properties of aluminium and steel
Aluminium Steel Density 2.7 g/cm3 7.8 g/cm3 Young modulus 7x10⁴ MPa 2.1x10⁵ MPa
Poisson ratio 0.33 0.3 Melting point 660 °C 1425-1540 °C Thermal expansion 23.1 µm/m·K 12 µm/m·K Thermal conductivity 237 W/m·K 36.3 W/m·K
The relatively low density of aluminium is an important reason to prefer aluminium rather than steel in automotive industry. The density of steel is three times more than the density of aluminium, however to achieve the same performance a larger thickness should be used, which limits the weight reduction to half. (EAA, 2013)
The Young’s modulus of aluminium is almost one third of that of steel. This causes larger springback effects and problems at the elastic recovery of aluminium sheets. Furthermore, aluminium and steel materials have different strain hardening coefficients, which means different stress–strain behavior in work hardening.
Another difference between steel and aluminium is that the normal anisotropy value of steel is larger than 1, whereas aluminium has a -value smaller than 1. This has an effect on the shape variations of steel and aluminium sheets after forming processes. Apart from that, the thickness variations of these materials for the same deep drawing operations may be different. Normal anisotropy ( -value) influences the maximum drawability of the sheet, whereas planar anisotropy (Δr) leads to earing. (Öztürk et al., 2010) Sheet metals with having greater -values are more suitable for deep drawing as the thinning should be smaller and thus the formability is better. A high -value allows
deeper drawn products. In shallow parts a high value may reduce the chance of wrinkling or ripples in the part. (Marciniak et al., 2002) If the value of the planar anisotropy value is large, the orientation of the sheet with respect to the die or the part to be shaped will be important. In such cases, earing problem can occur.
Another advantage of aluminium is its high corrosion resistance. It derives from aluminium’s high activity, which leads it to react simply with oxygen. When aluminium reacts with oxygen and aluminium oxygen is produced, a slab is created over the aluminium surface, which is prevented from reacting further. Opposite to the aluminium, steel shows a weaker resistance to corrosion, because its reaction with oxygen causes rust which separates from the surface and leaves it unprotected against more reactions.
Owing to different grain structures, the final surface qualities of aluminium and steel sheets are different. Especially, the formation of large grains in aluminium due to large deformations causes aesthetic problems on sheets surface.
2.3.2 Aluminium and Aluminium Alloys in Automotive Industry
The decision to choose the right material in the automotive industry is governed by several factors. The increasing need for higher fuel economy caused by concerns about global warming and energy usage has an important influence on the choice of materials. The manufacturers are trying to improve conventional engine efficiency and reduce the weight of the vehicle. European Aluminium Association (EAA) evaluates that 10% of vehicle weight reduction improves 8–10% of fuel economy. Use of lightweight materials can help reduce vehicle weight and improve fuel economy. It leads to a decreased use of steel and iron. In automotive industry, aluminium is considered better than steel because it gives a higher strength/weight ratio. Increasing use of aluminium in vehicles starting from 1990 can be seen in Figure 2.11.
Figure 2.11: Average aluminium content per car by years (EAA)
Aluminium usage in automotive industry has grown more than 50% in the final 10 years. According to EAA a total of about 140 kg of aluminium in a vehicle in 2012 is predicted to rise to around 160-180 kg by 2020. Future use areas for aluminium applications are trunk lids, hoods and doors hanging on a steel frame.
The biggest difference between aluminium and steel is its excellent bare metal corrosion. Most of the steels are supplied zinc coated to have acceptable paint durability, which is not necessary for aluminium. Strength of aluminium as structural sheet materials may be a limiting factor in some specific areas such as impact energy absorption and good deep drawing. Wide range of aluminium materials with different surface qualities can be chosen with the help of design and process experience to satisfy customers’ request. The choice of the aluminium alloys differs from region to region as well. It is shown in Table 2.2.
Table 2.2: Alloy choice for automotive panels: Europe vs. North America (Miller et
al., 2000)
Europe North America
Alloys 6xxx-T4 5754-O
Surface texture EDT MF
Pre-treatment Zr/Ti conversion conversion Lubrication oil or dry-lubricant oil
In the future it is expected that new alternative materials will gain importance. Aluminium is one of them and threats sheet steel even though it cannot be the main material of a car in the next decade. The drawback of aluminiums is the high material and manufacturing costs, recycling and regulations. (Miller et al., 2000)
2.3.3 Aluminium Alloys AA5754-H22 and AA6061-T6
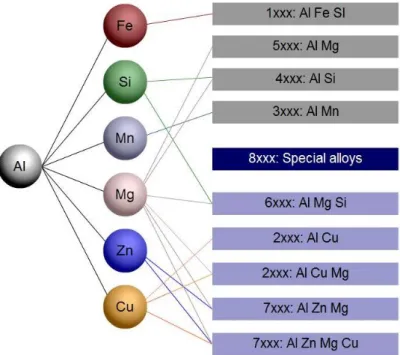
The mechanical strength of aluminium can be improved by alloying, but it reduces resistance to corrosion. Main alloying elements are copper, magnesium, silicon, manganese and zinc. Aluminium alloys can be classified as cast or wrought. Figure
2.12 describes the classification of wrought aluminium alloys according to the
International Alloy Designation System (IADS). (Callister, 2007)
There are 8 types of wrought alloys. These are designated by a 4 digit number which are followed by letters. A prefix is used to show the standard AA of the Aluminium Association. The first digit indicates the series. The second digit indicates alloy modifications of an existing alloy. The third and fourth digits have different meanings, depending on the first one. For series from 2xxx to 8xxx, the two digits identify a specific alloy without physical significance. They only show to vary between various alloys. (Alumatter)
AlMg-alloys (5xxx) are recommended for high formability, adequate strength and excellent corrosion resistance. AlMgSi-alloys (6xxx) are recommended for good formability, mechanical properties after painting process and corrosion resistance, in combination with a very good surface finish. (Alumatter) In scope of the master thesis these both aluminium alloy series will be compared.
The mechanical properties of the same alloy can change depending on the thermo-mechanical processing of the alloy during or after production. There are two categories of alloys which can be seen in Figure 2.12: Heat treatable and non-heat treatable alloys. Heat treatable alloys can be precipitation or age hardened. They have many possibilities for tempering to achieve different mechanical properties. In heat treatable alloys, mechanical properties are achieved through hot and/or cold working mechanisms during or after production work hardening operations like strain hardening, with annealing. (Alumatter)
The type of strengthening is shown with the temper designation T or H, meaning heat treated or strain hardened, respectively. Others indicate whether the alloy is annealed (O), solution treated (W), or used as it is as-fabricated condition (F). The numbers which stand after the T or H show the amount of strain hardening, the heat treatment type, or other special aspects of the processing of the alloy. (Callister, 2007)
The metals which are used during the experiments are AA5754-H22 and AA6061-T6. Their thickness is 2.5 mm. At AA5754-H22, the temper designation H22 shows that it is work hardened by rolling then annealed to quarter hard. At 6061-T6, the temper designation T6 shows that the solution heat treated and artificially aged.
In Table 2.3, 2.4 and 2.5 composition and properties of both alloys used during the experiments and deep drawing are shown. (Aalco)
Table 2.3: Chemical composition of AA5754-H22 and AA6061-T6 in percentage (%)
(Aalco)
AA Mn Fe Mg Si Cu Zn Ti Cr
5754-H22 0.5 max 0.4 max 2.6-3.2 0.4 max - - - - 6061-T6 0.15 max 0.7 max 0.8-1.2 0.4-0.8 0.15-0.40 0.25 max 0.15 max 0.04-0.35
Table 2.4: Physical properties of AA5754-H22 and AA6061-T6 (Aalco)
AA Density Melting point Thermal expansion Thermal conductivity Electrical resistivity 5754-H22 2.66 g/cm³ 600 °C 24x10-6/K 147 W/m.K 4.9x10⁻⁸ Ω.m 6061-T6 2.70 g/cm³ 650 °C 23x10-6/K 166 W/m.K 4.0x10⁻⁸ Ω.m
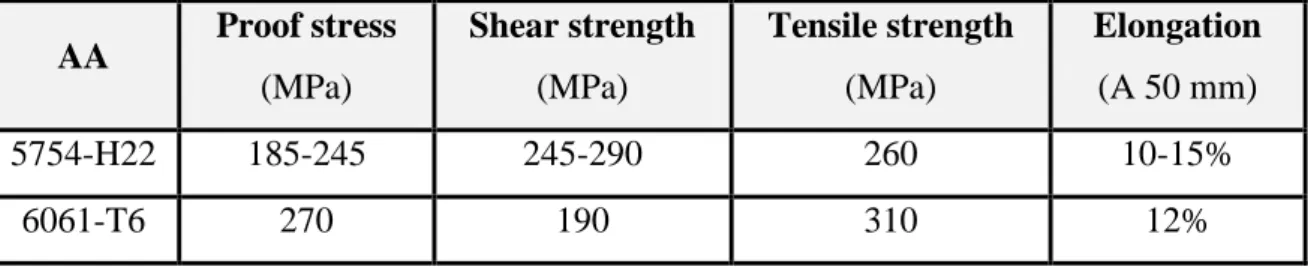
Table 2.5: Mechanical properties of AA5754-H22 and AA6061-T6 (Aalco)
AA Proof stress (MPa) Shear strength (MPa) Tensile strength (MPa) Elongation (A 50 mm) 5754-H22 185-245 245-290 260 10-15% 6061-T6 270 190 310 12%
3 Aim and Scope of the Thesis Work
The company Mercedes-Benz Türk A.Ş. is currently producing coaches for distant journeys and busses for schools and municipalities in collaboration with EvoBus which belongs to Daimler AG. There are two emergency valves on the flap panels in all busses except municipality type. These valves are crucial for the vehicle as they allow people to open different type of side panels manually in an emergency case. The emergency valves are mounted into the hollow parts of flap panels. These hollow parts are produced with deep drawing process. One of them is on fuel filler flap panel which all busses have. For the time being, this hollow part is supplied by an external company and then adhered to the flap panel. After that the emergency valve is mounted to hollow part of the flap panel.
To reduce the cost of bus production, a project is started to produce these hollows by deep drawing process with the hydraulic press which is already available in Mercedes-Benz Türk A.Ş. Another major reason for trying to make an in-house production is to lower the dependence to an external supplier. If there would be a production problem in the supplier, a bottleneck can occur in Mercedes-Benz Türk A.Ş. The geometry of this hollow part is already known. For the production of this part, a die is produced by an external company. The main interest of this project is to choose the most suitable material for the production of this part and find out which process parameters lead to the deep drawing without any failure and desired quality.
An expected problem of the deep drawing of emergency valve cup is the wrinkling of the sheet metal in the edges of the flap panel preventing a straight line in the panel. Because of aesthetic concerns, emergency valve cup is located close to the edge of the flap panel. However, there is also need for space for other cables behind the cup. The position of the emergency valve cup must be optimized.
In scope of the master thesis, the materials 2.5 mm thick aluminium alloys AA5754-H22 and AA6061-T6 are examined. EvoBus and Mercedes-Benz Türk A.Ş. are already using these 2 alloys for their flap panels. Due to this reason it is suggested to investigate AA5754-H22 and AA6061-T6.
First, materials are characterized with a tensile test. The reason of not using the given values from literature is that the specifications of an aluminium alloy can vary from supplier to supplier. Even though Mercedes-Benz Türk A.Ş. purchases its aluminium alloys from the same company, the chemical composition and mechanical properties can change over time. It cannot be known how long the aluminium alloys are kept before delivery which may cause aging of aluminium. Next step is conducting Nakajima test in order to obtain formability of materials. With the help of this information deep drawing will be carried out with different blankholder forces and varying distance of the emergency valve cup to the edges of the flap panel to find the best location without any quality issues.
4 Experiments for Material Characterization
For the characterization of Aluminium Alloys 5754-H22 and 6061-T6, the tensile tests and Nakajima tests are conducted.
4.1 Tensile Test
The purpose of tensile test is to obtain data, which is used in selecting materials for engineering applications. Uniaxial tensile test is a universal test which is conducted to obtain material parameters such as ultimate strength, yield strength, % elongation, % area reduction and Young’s modulus. These properties are also used to predict the material behaviour. (Davis, 2004)
4.1.1 Specimen Preparation
The tensile test specimens are prepared according to DIN ISO 6892-1 standard. This standard is for tensile testing of metallic materials in room temperature. The specimen is illustrated in Figure 4.1.
Figure 4.1: Tensile test specimen
Table 4.1: Tensile test specimen dimension
Symbol Explanation Dimension (mm)
ao original thickness of a flat test piece 2.5 bo original width of the parallel length of a flat test piece 20
Lc parallel length 120
Lo original gauge length 80
Lt total length of test piece 280
To prepare the tensile test specimens, first the number of specimens must be determined. For the sake of accuracy, each test is repeated 5 times with each specimen set. To obverse the anisotropy of the materials 3 different types of specimens are needed, namely 0, 45 and 90 degrees according to rolling direction of sheet metal. Tensile test specimens are prepared according to DIN ISO 6892-1 standard. The sheet metal aluminium alloys are first cut with hydraulic shearing machine Ras and then pressed in eccentric press Dirinler to the shape of a tensile test specimen. The final step of preparing specimen is to rasp the edges manually to smooth the edges and remove burrs.
5 specimens are prepared for AA6061-T6 0° as shown in Figure 4.2. Each specimen is labeled with material type, degree and number of specimen.
Figure 4.2: Set of tensile test specimens (AA6061-T6, 0°) 4.1.2 Experimental Setup
The tensile tests are held in the laboratory of the Zwick Avrasya Ltd. which works with the material testing department of Mercedes-Benz Türk A.Ş. The experiment is conducted according to DIN ISO 6892-1 standard, method A which donates that the speed of the cross head changes when the materials begins to yield. Zwick Roell Z250 machine is used with testXpert II 3.5 software. The tensile test setup is shown in
Figure 4.3: Zwick Roell Z250 tensile test machine and the specimen gripped to jaws
There are in total 30 specimens, half of them are AA5754-H22 and the other half is AA6061-T6. Each batch has 0, 45 and 90 degrees specimens. Each degree has 5 specimens so that the average can be taken to reduce the possible errors and have a more reliable result. All specimens are cleaned to remove any dust and dirt on the surface. After that the exact dimensions of the specimen is measured as length, thickness and depth.
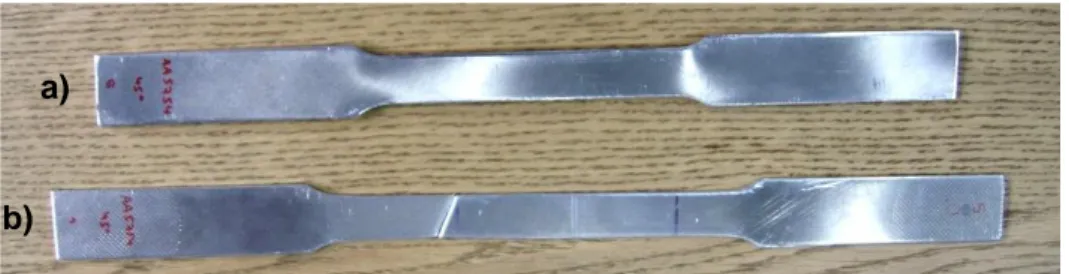
In the beginning the machine is set to zero so that residual stresses are removed. The machine is then connected to the computer and force, change in length and width is recorded until the specimen is fractured. A fractured specimen is shown in Figure 4.4.
Figure 4.4: AA5754-H22 45° tensile test specimen: a) before the tensile test b) after
the tensile test a)
4.1.3 Results
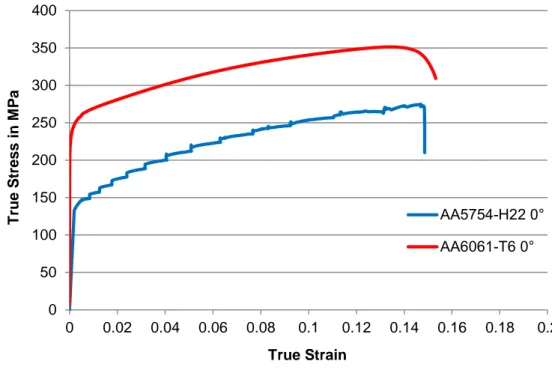
In tensile test, the force is obtained as a function of the elongation of the gauge length. There are two types of stress-strain curves: engineering and true. Both curves overlap in elastic region. In plastic region the true stress-strain curve is above of the engineering stress-strain curve. True stress-strain curve gives a more direct measure of the material’s response in the plastic flow range. From this reason below, true stress-strain curve is drawn in Figure 4.5.
Figure 4.5: True stress-strain diagram for AA5754-H22 and AA6061-T6
The stress-strain curve of AA5754-H22 is serrated when it undergoes plastic deformation. This deformation in room temperature is discontinuous because of a phenomenon which is called as Portevin–Le Chatelier (PLC) effect. It is marked by the formation of deformation bands that not only just leave unwanted traces on the surface of the product, but also reduces the ductility of the aluminium alloy. The strength of aluminium alloys are increased their strength by alloying elements, such as magnesium, in solid solution. (Herdawandi et al., 2007)
Elastic modulus is the description of a material’s tendency to be deformed elastically when a force is applied to it. On stress-strain diagram, elastic modulus can be calculated as stress divided by strain according to Hooke’s law.
0 50 100 150 200 250 300 350 400 0 0.02 0.04 0.06 0.08 0.1 0.12 0.14 0.16 0.18 0.2 T ru e S tr es s in M P a True Strain AA5754-H22 0° AA6061-T6 0°
The values of E, the elastic modulus, RP0.2, yield stress and Rm, the ultimate tensile strength are calculated directly with the testXpert II 3.5 software on computer which is installed on the Zwick tensile test machine. Yield stress is where the necking starts and the ultimate tensile strength is the maximum stress in true stress-strain curve.
Table 4.2: Elastic modulus and yield stress and ultimate tensile strength of each
specimen configuration
AA
E (GPa) RP0.2 (MPa) Rm (MPa)
0° 45° 90° 0° 45° 90° 0° 45° 90° 5754-H22 66.25 66.5 67.25 131 125.5 123.75 255.5 249 249.5
6061-T6 67.75 66.75 67.25 263.25 256.5 258.75 353 347 350.5
The anisotropy plays a very important role during forming processes. Due to anisotropy sheet shows different properties in different directions such as rolling direction, transverse and 45° of the coil. It is indicated by the r value which is the ratio of width strain to thickness strain.
For example for AA6061-T6 90 degrees, anisotropy coefficient in strain point is considered as 10%, hence;
= = = 0.0953 (4.1) = = = -0.0334 (4.2) To calculate the r value, volume constancy must be used.
(4.3) To find the r value; r =
( ) = 0.53 (4.4)
Apart from anisotropy coefficients, the average and planar anisotropy is calculated as well, see Table 4.3.
Table 4.3: The r value, average and planar anisotropy values of each specimen configuration AA r Δr 0° 45° 90° 5754-H22 0.62 0.72 0.65 0.68 -0.09 6061-T6 0.47 0.66 0.53 0.58 -0.16
The r value is maximum for aluminium alloys in the direction of 45º with respect to the rolling direction. Aluminium alloys from 5 and 6 series exhibit smaller r values when compared to stainless steels. In such conditions, sheet metal is very prone to thinning. (Aleksandrović et al., 2009)
A high anisotropy value corresponds to good drawability. At high r values, the sheets exhibit significant resistance to thinning when being drawn into a part such as a cup. The difference in planar anisotropy is related to the earing tendency of the sheet metal, which increases as the planar anisotropy increases. (Öztürk et al., 2010)
The rate of work-hardening is always measured from true stress and true strain data. True stress-strain curves will fit a simple power law expression, known as the Ludwik equation:
(4.5)
In the equation, is yield stress, n is the strain-hardening exponent and K is the strength coefficient.
Table 4.4: Strain-hardening exponent and strength coefficient values of each specimen
configuration AA n K (MPa) 0° 45° 90° 0° 45° 90° 5754-H22 0.238 0.236 0.238 431.4 413.2 417 6061-T6 0.147 0.145 0.145 464.2 452.5 457.6
The strain-hardening exponent which is the slope of the flow curve in the plastic area determines how much the metal can stretch before necking. Materials with have higher
n values have better formability than those with low n values. Moreover, higher n values mean greater difference between yield and ultimate tensile strengths.
The flow curve can be determined by plotting the flow stress variation of aluminium alloy specimens with the average equivalent stress. The graph begins with the yield stress where material begins to flow. Below Figure 4.6 and 4.7 shows the flow curves of AA5754-H22 and AA6061-T6 respectively.
Figure 4.6: Flow curve of AA5754-H22 100 150 200 250 300 0 0.05 0.1 0.15 0.2 T ru e S tr es s in M P a True Strain AA5754-H22 0° AA5754-H22 45° AA5754-H22 90°
Figure 4.7: Flow curve of AA6061-T6
The values of n, the strain-hardening exponent and K, the strength coefficient are calculated directly with the testXpert II 3.5 software. Yield stress was already calculated which shows the stress at the time at which material starts to deform plastically. Only 0 degrees of the aluminium alloys are calculated as the sheets are deep drawn in the rolling direction. The functions for aluminium alloys and their flow charts are given below. They are extrapolated according to Ludwik equation:
AA5754-H22 0 degrees, ̅ (4.6)
AA6061-T6 0 degrees, ̅ (4.7)
In the equation, is flow stress and ̅is equivalent strain.
200 250 300 350 400 0 0.05 0.1 0.15 0.2 T rue S tr e s s in M P a True Strain AA6061-T6 0° AA6061-T6 45° AA6061-T6 90°