Carcinoma Cell Line Discrimination in Microscopic
Images Using Unbalanced Wavelets
Furkan Keskin, Alexander Suhre, Tiilin Er�ahin, Rengiil �etin-Atalay and A. Enis �etin, Fellow, IEEE
Abstract-Cancer cell lines are widely used for research pur poses in laboratories all over the world. In this paper, we present a novel method for cancer cell line image classification, which is very costly by conventional methods. The aim is to automatically classify 14 dif1'erent classes of cell lines including 7 classes of breast and 7 classes of liver cancer cells. Microscopic images containing irregular carcinoma cell patterns are represented by randomly selected subwindows which possibly correspond to foreground pixels. For each subwindow, a correlation descriptor utilizing the fractional unbalanced wavelet transform coeffi cients and several morphological attributes as pixel features is computed. Directionally selective textural features are preferred primarily because of their ability to characterize singularities at multiple orientations, which often arise in carcinoma cell lines.
A Support Vector Machine (SVM) classifier with Radial Basis Function (RBF) kernel is employed for final classification. Over a dataset of 280 images, we achieved an accuracy of 88.2 %, which outperforms the classical correlation based methods.
Index Terms-Carcinoma cell line, microscopic image process ing, correlation descriptor, unbalanced wavelet.
I. INTRODUCTION
A
UTOMATIC classification of biomedical images is an emerging field, despite the fact that there is a long history of image recognition techniques [1]. Automated clas sification of carcinoma cells through morphological analysis will greatly improve and speed up cancer research conducted using established cancer cell lines as in vitro models. Distinct morphologies of different types and even sub-types of cancer cells reflect, at least in part, the underlying biochemical differences, i.e., gene expression profiles. Moreover, the mor phology of cancer cells can infer invasivenes of tumor cell and hence the metastatic capability. In addition, an automated morphological classification of cancer cells will enable the correct detection and labelling of different cell lines. Predicting labels of cancer cell lines in a fast and accurate manner via a pattern classification approach will greatly enhance biologists' ability to identify different types of cell lines without the need to scrutinize each and every microscopic image one by one. Although cell lines are being used widely as in vitro models in cancer research and drug development, mislabeling cell lines or failure to recognize any contamination may lead to misleading results. Short tandem repeat (STR) analysis is being used as a standard for the authentication of human cell lines. However, this process takes a long time and has to beF. Keskin, A. Suhre and A. E. <;etin are with the Department of Electrical and Electronics Engineering, Bilkent University, Bilkent, Ankara, 06800, Turkey. e-mail: [email protected]
T. Ersahin and R. <;etin-Atalay are with the Department of Molecular Biology and Genetics, Bilkent University, Bilkent, Ankara, 06800, Turkey.
carried out by an expert. Automated analysis, on the other hand, will provide the scientists a fast and easy-to-use tool that they can use in their own laboratories to verify their cell lines.
In this study, discrimination of 14 classes of biomedical images is achieved, which are all images of cancer cell lines. The dataset in hand consists of two types of cancer cell lines, namely breast cancer and liver cancer (hepatocellular carcinoma). The breast cancer cell lines used in our study are
BT-20, Cama-l, MDA-MB-157, MDA-MB-361, MDA-MB-453, MDA-MB-468 and T47D, while the liver cancer cell lines are
Focus, Hep40, HepG2, Huh7, m v, PLC and SkHepl. Sample images from breast cancer and liver cancer cell lines are shown in Figures 1-8.
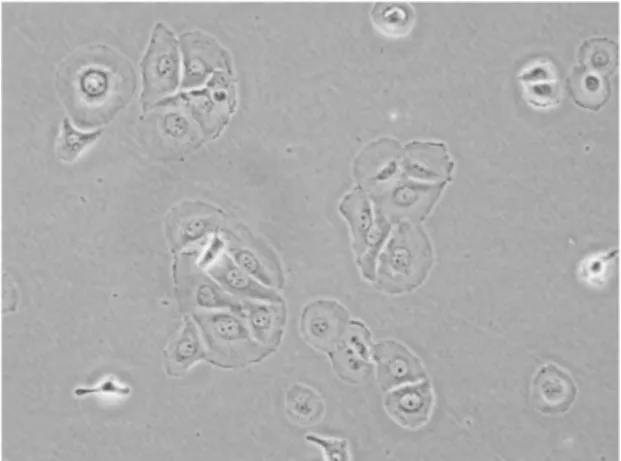
Fig. 1: Sample image from BT-20 class
Fig. 2: Sample image from Focus class
We adopt a correlation based approach by exploiting pixel level attributes to construct local region descriptors encoding 978-1-4673-3140-1/12/$31.00 ©2012 IEEE
Fig. 3: Sample image from HepG2 class
Fig. 4: Sample image from MDA-MB-157 class
correlations of several attributes inside a region of interest. Pixel attributes are extracted using directional difference scores and directionally selective fractional wavelet transform. Since background regions occur frequently in a cancer cell line image, we randomly sample subwindows from the foreground image regions after foreground-background segmentation and each microscopic image is represented by correlation matrices of certain number of subwindows sampled randomly from the whole image. Finally, an SVM classifier with RBF kernel is trained to learn the class boundaries.
This paper is organized as follows. In Section 2, feature ex traction steps are described comprising image decomposition method by directionally selective fractional wavelet transform, directional difference score computation and correlation matrix construction. In Section 3, SVM based correlation matrix clas sification algorithm is explained along with the foreground background segmentation by EM algorithm and random sub window selection. Section 4 presents the experimental results and Section 5 concludes the paper.
II. FEATURE EXTRACTION
A. Directionally Selective Fractional Wavelet Transform
Microscopic cancer cell line images contain significant amount of oriented singularities. To characterize the singu larities at multiple orientations, we propose the directionally selective fractional wavelet transform (DS-FWT) for analysis
2
.'
'.
Fig. 5: Sample image from MV class
Fig. 6: Sample image from PLC class
of microscopic images [2]. Fractional wavelet decomposition [3] is based on two-channel unbalanced lifting structures whereby it is possible to decompose a given discrete-time signal x [n] sampled with period T into two sub-signals Xl [n] and x2[n] whose average sampling periods are pT a�d
. �T, respectively. Fractions
p
andq
are rational numbers satlsfYIng the condition:ljp
+ljq
= 1. In FWT, a structure similar tothe lazy filterbank forwards every
pth
sample of the original signal to the upper-branch and remainingp-l
samples out ofp
samples go to the lower branch. An example of an unbalanced lifting structure withp
= 3 : 1 andq
= 3 : 2 is shown inFigure 9.
In Figure 9, upper branch sub-signal samples xL [n] are updated using the neighboring lower-branch samples as
1 2 3 2 1
xL [n] = -x[3n- 2]+-x[3n- l]+-x[3n]+-x[3n+l]+gx[3n+2]
9 9 9 9 (1)
where x[n] is the original input signal to the filterbank. Lower branch detail signal samples are predicted from the upper branch and the difference is transmitted to the output lower branch: [3n+2] _ 2xdif]+XL[if+l] X 2 3 ' [3n+l] _ 2xd�]+xd�] X 2 3 ' n is even (2) n is odd
Fig. 7: Sample image from SkHepJ class
Fig. 8: Sample image from T47D class
We extended the fractional wavelet transform to two dimensional signals in a non-separable manner and use it to extract directionally selective textural features from cancer cell line images. 2-D DS-FWT unbalanced lifting structure with p = 9 : 1 and q = 9 : 8, which produces five directional subbands, is shown in Figure 10.
In this study, DS-FWT is used with p = 25 : 1 and q = 25 : 24. A 2-D image is divided into 5x5 nonoveriapping cells and eight values corresponding to eight orientations between o and 7r are computed inside each cell. With J (x, y) denoting
the center pixel of the cell, fractional wavelet features can be computed by taking differences between the center pixel and the weighted region sums as follows:
:WLJ··,
. , : ' x[n] .•.... . . ...:
WiJ
... .
. , . , '., I , l , • , • ,Fig. 9: Unbalanced lifting scheme with p = 3 : 1 and q = 3 : 2
downsampling ratios. o • d. 'b f • • • g. h. I • • --r--+---+--�-� r---'�--+---+--+--'� �---0+�
Fig. 10: 2-D non-separable extension of the unbalanced lifting structure with p = 9 : 1 and q = 9 : 8.
D3(X, y) = J(x, y) -
L
wijJ(x + i, y + j) 2>i>-2 (5) 2�j�-2 O>ij D4(X, y) = J(x, y) -L
wijJ(x + i, y + j) 2>i>-2 l�j�-l O>ij (6)where Di(x, y), i = 1...8, represents the directional feature for the ith direction, Wij denotes the weight associated with D1(x,y)= J(x,y)-
L
wijJ(x+i,y+j)l>i>-l 2�j�-2
(3) the corresponding pixel in the neighborhood of the center pixel and Li,j Wij = 1. The subband images Di(X, y) for i = 5 ... 8 are computed in a similar manner. They repre sent 7r / 4 counterclockwise rotated versions of the differences
Di(x, y), i = 1...4, respectively. Each Di can be regarded as a directional detail subband whose size is five times smaller D2(x, y) = J(x, y) -
L
wijJ(x + i, y + j)l>i>-l 2�j�-2 O?ij
(4) than that of the original size. To obtain an approximation subband the same size as the detail subbands, we decimate the image by a factor of five using anti-aliasing filters and
obtain an approximation image Ia(x, y). Thus, we obtain 9 attributes for each pixel (x,y) of the image la, which are the intensity Ia(x, y) and 8 values Di(x, y) obtained from fractional wavelet transformation. These values will be used as features in correlation matrix computation.
B. Directional Differences
In order to account for the large morphological variation of the images in our dataset, we evaluated differences between pixels in various directions. Consider a point PI on a two dimensional function I(x, y). Now consider a second point P2. The Euclidean distance between PI and P2 is d and P2 lies on line that has an orientation of angle a with respect to the x-coordinate, i.e., P2 lies on a circle, which's center point is PI and has a radius d. The difference between PI and P2 can be written as
T
(
d,
a)
= II(x,y) - I(x + d· cosa,y + d· sina)l. (7)Now consider we want to compute a couple of difference values for equidistant concentric circles where the largest circle has radius
R
and the smallest has radiusRj
A, whereA is an integer with values ranging from [1,
R].
When the parametersR
and A are fixed, we can rewrite the above equation asT(i,
a) =I
I(X,y) - I(x +i�.
cosa,y +i�.
sina)l
,(8) where
i
E 1, 2, ... , A. We can compute a score for each a value by computing a function with respect toi,
as(9) For example, F) can be the median function. In that case So: is simply the median of all the differences between the center pixel and the points at distances
i �
at the fixed orientationa. We use these scores as features in correlation matrix computation. Three different functions, namely median, max and mean functions, are employed for F) in this study. For each image Ia(x, y) obtained in Section II-A, 8 output images of the same size are generated as the result of the function
F), corresponding to 8 different orientations when the radius d is chosen as 5 in the experiments. Hence, in addition to DS FWT features, each pixel (x,y) of the image Ia has 8 attributes, which denote the scores So: for 8 different a values.
C. Correlation Matrices for Cell Line Description
Successfully employed in texture classification [4], pedes trian detection [5] and flame detection [6], covariance descrip tors enable the combination of different features over an image region of interest. Given an intensity image I of size mxn, we define a mapping ¢ from image domain to feature domain as
F(x,y) = ¢(I,x,y) (10)
where each pixel (x,y) is mapped to a set of features and F is the mxnxd dimensional feature function. For a given
4
subwindow R consIstIng of n pixels, let (fk)k=l...n be the d-dimensional feature vectors extracted from R. Then, the covariance matrix of region R can be computed as
1 n
C
= -- '"'(fk - fL)(fk - fL)Tn-l L... k=l
(11) where fL is the mean of the feature vectors inside the region R. The covariance matrix is symmetric positive-definite and of size dxd. There exists a very efficient multiplier-less im plementation of covariance descriptors, called co-difference matrices, which have been shown to yield comparable per formances to the original ones [7].
Correlation descriptors are obtained by normalizing covari ance matrices. Correlation matrix estimation is perfonned as [8] A • •
{JC(i,j),
C(l,J)
= C(i,j) VC(i,i)C(j,j) , ifi
= j otherwise (12) WithD(x,y)
= [DI(x,y) ... Ds(x,y)] (13)and
s�(x,y)
= [S�,(X,y) ... S�8(X,y)] (14)where al ... as correspond to the eight orientations of direc tional difference score estimation and k = 1, 2,3 denote,
respectively, the median, max and mean functions F) in Section II-B, feature mapping functions employed in this study are
¢I(I,X,y) = [Ia(x,y)
D(x,y) s�(x,y)]T,
(15)¢2(I,x,y) = [Ia(x,y)
D(x,y) s�(x,y)]T,
(16)where IIxl and IIxxl denote the first- and second-order deriva
tives at (x, y) of the image Ia.
III. CLASSIFICATION USING A MULTICLASS SVM The images in our dataset show a large amount of back ground pixels. Clearly, the background is not discriminative. Therefore, we address the issue of segmenting the images into foreground and background before classification. For our dataset a simple thresholding scheme is not sufficient for segmentation, since foreground pixels have a large variance and may therefore have values higher and lower than the background pixels. We modeled the image as a mixture of two Gaussians, representing the foreground and background pixels, respectively. Using this model, an Expectation-Maximization (EM) algorithm was applied for segmentation.
in carcinoma cell line images, s analysis square windows are randomly selected, as in [9], from each image with the two constraints: the percentage of the foreground pixels in the selected region of an image must be above 50 and the variance of the selected region must exceed an image dependent threshold, which is the variance of the whole image.
For each subwindow, a covariance matrix is computed using Equation (11) for each of the feature mapping functions in (15)-(18). The image signature is composed of s covariance matrices of the same size. Each class is represented by sx#(images in each class) covariance matrices. Covariance matrices are symmetric positive-definite and do not lie in the Euclidean space; so, they are vectorized resulting in
d( d + 1) /2-dimensional vectors for dxd matrices. A multiclass SVM classifier is trained with REF kernel in the d( d + 1) /2-dimensional vector space using the training points. SVM algorithm is implemented using LIBSVM library [10]. For each test subwindow, the corresonding covariance descriptor is vectorized and fed into the trained SVM model for prediction. Therefore, there exist s labels for each microscopic image corresponding to s subwindows, and the image in question is assigned the label that gets the majority of votes among s labels. The above process is re-executed using correlation matrices instead of covariance matrices.
IV. EXPERIMENTS
The dataset used in this study consists of 280 microscopic human carcinoma cell line images with each of the 14 classes having 20 images. All the images in the dataset were acquired at 20x magnification. The size of each image is 3096x4140 pixels. 7 classes belong to breast cancer cell lines and the other classes belong to liver cancer. Breast cancer cells tend to be smaller and round whereas liver cancer cells tend to be more spread out and have pods. Moreover, breast cells generally do not contain dots within the cytoplasm.
We adopt a 20-fold cross-validation strategy for the exper iments. The dataset is divided into 20 disjoint subsets and each subset consisting of 14 images is used exactly once as the test set. For k = 1...20, kth subset is formed by taking
the kth indexed image of each class. We run 20 experiments, choosing each image as the test image only once for each class, and obtain the average image classification accuracy over 20 runs. The number of selected random subwindows is taken to be s = 100. We perform the above experiment for
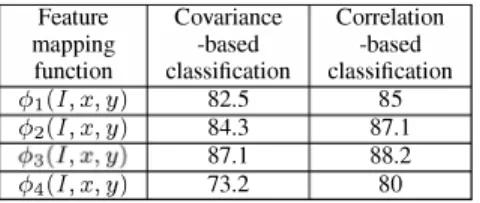
both covariance and correlation matrices, and for four different mapping functions in (15)-(18). SVM RBF kernel parameters are chosen as 'Y = 0.5 and C = 1000. Experimental results
are shown in Table I.
It can be seen from Table I that correlation matrix-based method outperforms the covariance method for all map ping functions. This can be attributed to the normalization performed in correlation computation. Unbalanced wavelet features based classification methods (15)-(17) have higher accuracies than the classical covariance/correlation method in (18). It is clearly demonstrated via experiments that image classification accuracy can be enhanced by exploiting the
and directional scores obtained by median, max and mean functions.
Feature Covariance Correlation
mapping -based -based
function classification classification
(PI(1,x,y) 82.5 85
<P2(1, x, y) 84.3 87.1
<P3(I,x,y) 87.1 88.2
<P4(1, x, y) 73.2 80
TABLE I: Average classification accuracies (in %) of carcinoma cell line images over 20 runs using SYM with RBF kernel
V. CONCLUSION
In this paper, fractional wavelet transform and region co variance framework are successfully applied to classify the cancer cell line images. We demonstrate that automatic classi fication of microscopic carcinoma cell line images can be reli ably performed using directionally selective fractional wavelet transform (DS-FWT) and correlation descriptors. Fractional wavelet transformation is achieved by using unbalanced lift ing structures where sampling intervals of upper and lower branches are different. Covariance and correlation descriptors are computed for features extracted from DS-FWT subbands and directional difference scores. Promising classification re sults are obtained with the experiments, which reveal the ability of the proposed features to characterize breast and liver carcinoma cell line textures.
REFERENCES
[I] M. Dundar, S. Badve, Y. Raykar, R. Jain, O. Sertel, and M. Gurcan, "A multiple instance learning approach toward optimal classification of pathology slides," in Pattern Recognition (ICPR), 2010 20th Interna
tional Conference on, August 2010, pp. 2732 -2735.
[2] F. Keskin and A. E. Cetin, "Directionally selective fractional wavelet transform using a 2-d nonseparable unbalanced lifting structure," in
MUSCLE International Workshop on Computational Intelligence for
Multimedia Understanding, December 13-15 2011.
[3] K. Habiboglu, Y.H.; Kose and A. E. Cetin, "Fractional wavelet trans form using an unbalanced lifting structure," in Independent Component Analyses, Wavelets, Neural Networks, Biosystems, and Nanoengineering
IX, Proc. SPlE 8058, 805805, 20 II.
[4] O. Tuzel, F. Porikli, and P. Meer, "Region covariance: A fast descriptor for detection and classification," in In Proc. 9th European Conf. on
Computer Vision, 2006, pp. 589-600.
[5] --, "Pedestrian detection via classification on riemannian manifolds,"
Pattern Analysis and Machine Intelligence, IEEE Transactions on,
vol. 30, pp. 1713-1727,2008.
[6] Y. Habiboglu, O. Gunay, and A. Cetin, "Flame detection method in video using covariance descriptors," in Acoustics, Speech and Signal
Processing (ICASSP), 2011 IEEE International Conference on, May
2011, pp. 1817 -1820.
[7] H. Tuna, I. Onaran, and A. Cetin, "Image description using a multiplier less operator," Signal Processing Letters, IEEE, vol. 16, no. 9, pp. 751 -753, sept. 2009.
[8] Y. H. Habiboglu, O. Gunay, and A. E. Cetin, "Real-time wildfire detec tion using correlation descriptors," in 19th European Signal Processing Conference (EUSIPCa 2011), Special Session on Signal Processing for
Disaster Management and Prevention, 2011.
[9] R. Maree, P. Geurts, J. Piater, and L. Wehenkel, "Random subwindows for robust image classification," in Computer Vision and Pattern Recog
nition, 2005. CVPR 2005. IEEE Computer Society Conference on, vol. 1,
[10] c.-C. Chang and C.-J. Lin, "LIBSYM: A library for support vector machines," ACM Transactions on Intelligent Systems and
Technology, vol. 2, pp. 27:1-27:27, 2011, software available at
http://www.csie.ntu.edu.tw/ cjlin/libsvm.