Molecular Modelling and Activity Analysis of
Mycobacterium tuberculosis DNA Gyrase
B ATPase Active Site
Acta Pharm. Sci. Vol 55 No: 1. 2017 DOI: 10.23893/1307-2080.APS.0551
Barkın Berk1*, Zafer Şahin1
*Corresponding author: Barkın Berk E-mail address: [email protected]
1 İstanbul Medipol University, School of Pharmacy, 34810, İstanbul, Turkey.
INTRODUCTION
According to the World Health Organization (WHO), on average, 8 to 10 mil-lion people are exposed to tuberculosis (TB) every year and this number is still increasing. Pulmonary tuberculosis originating from Mycobacterium
tubercu-losis (MT) is one of the major causes of death in patients infected with the
hu-ABSTRACT
Computer-based algorithms and statistical techniques such as receiver operating characteristic (ROC) curves are increasingly used for the design of new ligands. X-ray crystallographic data and homology models allow examining the interac-tions between ligands and biomacromolecules using different algorithms and techniques. DNA gyrase enzyme inhibition is an alternative approach to clinical antimicrobial therapy for multi-drug resistant Mycobacterium tuberculosis (MT). In this study, different datasets were created by enriching 1,442,716 compounds using known DNA GyrB ATPase inhibiting molecules. HTVS was performed on a previously designed homology model of MT DNA GyrB ATPase active site and true-positive scores were verified using ROC curves. Furthermore, 11 mole-cules with high scores were tested for their activity and the compound with the 5-(4-aminophenoxy)-2-(3-aminophenyl)-2,3-dihydro-1H-isoindole-1,3-dione structure was found to have similar activities to standard novobiocin. Finally, mo-lecular interaction field and distance/interaction probability analyses were per-formed on the pose to identify new probable active derivatives of this compound. Keywords: HTVS, ROC curves, Docking, Mycobacterium tuberculosis, DNA Gy-rase B ATPase
man immunodeficiency virus. Clinically, the most common problem concerning tuberculosis is its ‘multidrug resistance’ since there is no regime or new drug that can overcome this resistance1.
Mycobacterium is an organism which has its own idiosyncratic family, Myco-bacteriaceae with 140 well-defined and investigated species2. Of the species
of this family that have spread over wide areas, M. tuberculosis, M. bovis, M.
africanum, and M. microti are responsible for the development of
tuberculo-sis, and M. leprae and its subspecies are responsible for the development of leprosy3.
The genome structure of MT consists of 4,411,529 base pairs and 4,000 genes providing this species with various and rapid coding capacity and ease of adapta-tion to the development of multidrug resistance unlike any other subspecies of the same family4. There are two different approaches to seeking a treatment
op-tion for multi-drug resistant tuberculosis (MDR-TB). The first is to find and vali-date new biomacromolecular targets in the biochemical pathways of MT or test molecules with known structures over validated targets that have not previously been tested for MDR-TB. However, this is not the first preference due to the fast adaptation capacity of MT. The second approach involves an exploration of new compounds including tetracycline, cephalosporin and quinolone ring systems and further investigation of existing and validated targets 5.
DNA gyrase is a type of topoisomerase II, introducing supercoils to DNA us-ing ATP hydrolyse energy. It is constructed by GyrA and GyrB subunits, which merge to form the heterodimer A2B2 structure. The amino terminal of the GyrB subunit (43kDa) is responsible for ATPase activity and the carboxy-terminal (47kDa) facilitates the interaction between protein A and DNA. Together, GyrA and GyrB break and reunite DNA. In this process, GyrB utilises the energy re-leased from ATP hydrolyse at the N-terminal6. With this function, either the
DNA or ATP binding cavities can be blocked by inhibitors for the termination of growth; therefore, DNA gyrase of MT has become a precious dual target for the treatment of MDR-TB.
Fluoroquinolones, DNA binding cavity inhibitors, are the only group of DNA gyrase inhibitors that are clinically used. However, along with rapid bacterial re-sistance, fluoroquinolones present with serious side effects and toxicity7.
There-fore, the catalytic domain (ATPase) of GyrB N-terminal has become a popular topic of research8.
In general, a computer-assisted drug design follows ligand- and structure-based methodologies, in which ligand libraries are virtually screened using various techniques. In the past few decades, these designs have led to the development
of successful drug molecules including dorzolamide, imatinib and raltegravir 9-14.
Although various valuable crystal structures of the DNA gyrase of MT have been proposed to enlighten its working mechanism 15-17, none has so far demonstrated
the interaction between major inhibitor novobiocin and the catalytic domain (ATPase) of GyrB. Previously, we designed a homology model of MT DNA GyrB ATPase active site using the crystal structure of the 43K ATPase domain of
Ther-mus thermophilus gyrase B in complex with novobiocin (RSCB Pdb id; 1KIJ) as
a template and maintaining novobiocin and water in the hydrophobic pocket, which are assumed to be important for the ligand activity 18.
In the present study, we prepared various datasets for the enrichment of 1,442,716 compounds from the ZINC database using known DNA GyrB ATPase active molecules and performed high throughput virtual screening (HTVS) with different docking protocols to evaluate the role of water molecules in the ligand-binding cavity. In addition, the evaluation of docking scores using ROC curves allowed us to verify the true positive binders that can be used as cores in future studies. Moreover, eleven molecules with the highest score were tested using the MT gyrase supercoiling assay against the novobiocin standard for inhibitor ac-tivities. Finally, we identified molecular interaction fields (MIF) and performed a distance/interaction probability analysis on the active ligand to investigate how new probable active derivatives can be produced from the core.
METHODOLOGY Materials
The dataset used in this study is a pre-prepared subset of the ZINC data bank, ‘clean-leads-subset (# 11)’ (logP values < 3.5, molecular weight < 350, rotational number of bonds £7 and 1.442.716 compounds,). The compounds selected for biological testing were purchased from Molport Chemicals (Latvia) with 99.5% minimum purity and used after confirming the results of the LC-MS/MS and elemental analysis supplied by the dealer.
The preparation of the protein structure and ligands, trial and test sets, grid files, docking and scoring were performed using algorithms from the Maestro mod-ules (Schrodinger Inc, USA). For the preparation of ROC curves and interac-tion graphics, the Molecular Operating Environment (MOE) software (Chemical Computing Group Inc., Canada) was used and the MIF analysis was performed in the GRID 22c software (Molecular Discovery Inc, UK).
The biological activities were tested using the MT gyrase supercoiling assay (In-spiralis Inc. UK, MTS001 and MTS002) and novobiocin as the reference stand-ard (CAS, 1476-53-5, AppliChem, Germany).
Homology modelling and preparation of protein structure
The homology model used in this study was simulated using the crystallographic structure of Thermus thermophilus Gyrase B 43k ATPase domain in a complex form with novobiocin (Pdb id; 1KIJ, resolution; 2.30 Ao). This structure was
cho-sen due to its 43% sequence similarity (Basic Local Alignment Search Tool, E value: 2e-77) to the MT DNA GyrB sequence of the UniProtKB database (Uni-ProtKB/Swiss-Prot P0C5C5). During modelling, various water molecules which were assumed to be responsible for ligand-protein interactions were maintained as recommended in previous research19. Furthermore, the protein preparation
wizard from the workflows menu of Maestro was utilised for hydrogen inser-tion, rotamer adjustment and H-bond optimization using the parameters of Op-timized Potentials for Liquid Simulations (OPLS 2005) force field.
Preparation of trial and test sets
Initially, the ‘clean-leads-subset (# 11)’ with the characteristics given above were downloaded from the ZINC database in the sdf format. This dataset was enriched with 29 DNA gyrase ATPase site ligands, the activity of which had pre-viously been proven. The ligands were prepared using the LigPrep module of Maestro (Schrodinger Inc.) by generating possible ionization (pH 7±2) and tau-tomeric states. Duplicated structures and salt forms were eliminated. During the course of the study, the enriched dataset was used as a whole as the ‘test set’ and randomly selected 11,000 plus 29 active compounds were used as the ‘trial set’.
Preparation of grid files
All the grid files for the MT DNA gyrase ATPase active sites were prepared using the Maestro Glide-Receptor Grid Generation tool. A receptor-binding pocket was defined by taking 6 A° surrounding area of novobiocin as the centroid. During preparation, the original ligand was excluded and a scaling factor of 1.0 and a partial charge cut-off of 0.25 were used as the parameters for the Van der Walls ra-dius-scaling factor. Using these parameters, two different grid files were prepared; - Unrestricted (positioning all the compounds based on the original ligand being the centroid)
- Restricted with ASP 79 and/or HOH 539 (either making bond with ASP 79 and/or HOH 539 or defining the position of ligands based on the position of HOH 539)
Trial set docking, scoring and ROC curves
The trial set was docked using Glide HTVS, SP and XP protocols in the unre-stricted and reunre-stricted grid files. The basic settings for HTVS, SP and XP algo-rithms were set as; treating the receptor as rigid and the ligands as flexible,
dock-ing without usdock-ing a core pattern comparison algorithm, usdock-ing the constraints from grid files if needed, writing 100,000 poses per docking run and performing a post-docking minimization on the top five poses. The glide docking score was used as the principal score parameter. Then, the results were transferred to the MOE software in the sdf format, re-opened, lined up in an ascending manner corresponding to the maximum docking score for each compound and evaluated using ROC curves with SVL scripts in MOE.
Test set, docking, scoring and ROC curves
The test set was docked using the Glide HTVS methodology and restricted grid files. Then, to reduce the computer load, 240,000 molecules with the highest score were re-docked following the SP protocol and rescored in place by the XP algorithm. For experimental consistency, the basic settings for HTVS, SP and XP algorithms and the steps followed for the evaluation of ROC curves were kept the same as those used for the trial set.
Biological activity
Eleven compounds were tested with the MT gyrase supercoiling assay at the concentrations of 1 mg/20, 50, 100 µL using novobiocin as the reference standard for comparison purposes. Furthermore, the most active compound, 5-(4-aminophenoxy)-2-(3-aminophenyl)-2,3-dihydro-1H-isoindole-1,3-dione (10), was re-evaluated in the concentration range of 0.1to 2 mg/100 µL (2.8-57 mM) compared to the same concentrations of novobiocin (1.6-32 mM).
DNA gyrase supercoiling assays were performed according to the manufactur-er’s instructions and analysed by monitoring the conversion of relaxed pBR322 plasmid to its supercoiled form using DNA gel electrophoresis. Essentially, 1 U of either E. coli or S. aureus DNA gyrase was first diluted in a 5×gyrase buffer and incubated in an assay buffer (35 mM Tris HCl at pH 7.5, 24 mM KCl, 4 mM MgCl 2, 2 mM DTT, 1.8 mM spermidine, 1 mM ATP, 6.5% w/v glycerol, and 0.1 mg/mL BSA) with 0.5 µg of pBR322 plasmid and compound dilutions at 37 ◦C
for 30 min. Reactions were stopped with the addition of stop dye (40% sucrose, 100 mM Tris HCl at pH 7.5, 1 mM EDTA, and 0.5 mg/mL bromophenol blue) and loaded onto TAE agarose gel (1%). Gels were visualised using a gel docu-mentation system (Bio-Rad ChemiDoc). Since high levels of dimethyl sulfoxide (DMSO) are known to affect DNA gyrase activity, titration was used to deter-mine the minimum amount of DMSO to be used in the assays, and 5% DMSO (with negligible or no effect on gyrase) was chosen to dilute the compounds20. MIF and distance/interaction probability analysis
5-(4-aminophenoxy)-2-(3-aminophenyl)-2,3-dihydro-1H-isoindole-1,3-dione (10) was converted to the pdb format and re-opened in the greater user interface of GRID 22c (Molecular Dis-covery Inc, England). During grid manufacturing process, automatic settings were used for loading, file correction and site marking around ligands. The calculations were run using the following; R-NH2 (including unbounded electrons), R1R2NH (including unbounded electrons), CONH2, ROR, RCOR, R-OH, Ph-OH, water and hydrophobic probes and charges were kept the same. All visualisations were per-formed in the MOE software. The distance/interaction probability analysis was conducted using the ‘Ligand-receptor contacts (visualisation+scoring) svl’.
RESULTS AND DISCUSSION
Trial set docking, scoring and ROC curves
The enriched trial set was docked to the homology model and scored using HTVS, SP and XP algorithms with both unrestricted and restricted grid files. During this process, the native ligand novobiocin was docked to its original posi-tion smoothly (RMSD 0.83-0.85 Ao) showing similarities and interactions with
the original x-ray crystallographic data.
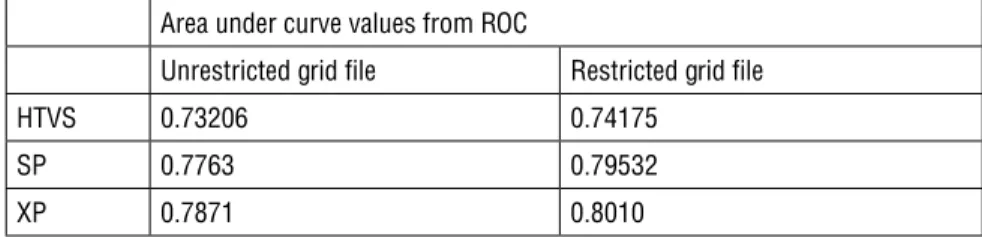
A weakness of the docking program is related to the scoring functions. In this study, we used maximum docking scores for ROC curves to evaluate accuracy powers in discriminating interaction patterns. The ROC curves used in these ex-periments are plots of the true positive rate (sensitivity) against the false positive rate (specificity) for different possible cut points. They show the trade-off be-tween sensitivity and specificity where any increase in sensitivity is accompanied by a decrease in specificity. The closer any curve follows first the left-hand and then the top border of the ROC space, the higher the accuracy is. The accuracy of our tests depended on how the groups being tested were separated into those with and without experimental activity. Accuracy is measured by the area under the ROC curve. An area of 1 represents a perfect test and an area of 0.5 indicates a poor test. Similar to the regression analysis, when an area approaches 1, the power of discrimination increases. Table 1 presents the area under curve (AUC) values of the grid files for each algorithm.
Table 1: Area under curve values of the trial set using restricted and unrestricted grid files according to HTVS, SP and XP protocols
Area under curve values from ROC
Unrestricted grid file Restricted grid file
HTVS 0.73206 0.74175
SP 0.7763 0.79532
The clear steady increase shown in Table 1 indicates that using a restricted grid file restricted with ASP 79 and/or HOH 539 or by defining the position of ligand based on the position of HOH 539 both gave better results in terms of ligand positioning during docking and successfully discriminated false positives. In the light of these results, we decided to continue with the restricted grid file for the further evaluation of the test set.
Test set docking, scoring and ROC curves
Based on the ROC evaluated AUC from the trial set, deciding on further dockings restricted to certain bonding to ASP 79 and/or HOH 539 is a challenge since it is virtually essential to eliminate all the water molecules. The reason for this is that in some docking algorithms such as molecular dynamic and induced fit in which both the receptor and the ligands are flexible to a certain degree, the free water molecules can easily cause various problems. This is why in this study we kept the receptor rigid and the ligand flexible. In addition, previous crystallographic data showed that bonding with ASP 79 through bridging water exactly in this position facilitates further interactions18.
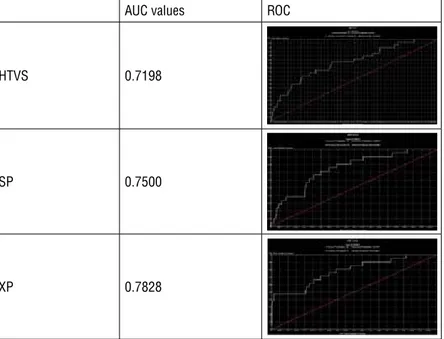
In the test set, over a million compounds were processed during docking cal-culations and AUC was reduced only by 2%. Then, to decrease the process time and computer load after HTVS, we decided to have a cut-off point for 240,000
AUC values ROC
HTVS 0.7198
SP 0.7500
XP 0.7828
Figure 1: Area under curve and ROC curves of the test set using the restricted grid file and the HTVS, SP and XP protocols
compounds with high scores and further docked and rescored them with SP and XP protocols. Figure 1 shows the AUC and ROC values for each protocol using the grid file restricted with ASP 79 and/or HOH 539.
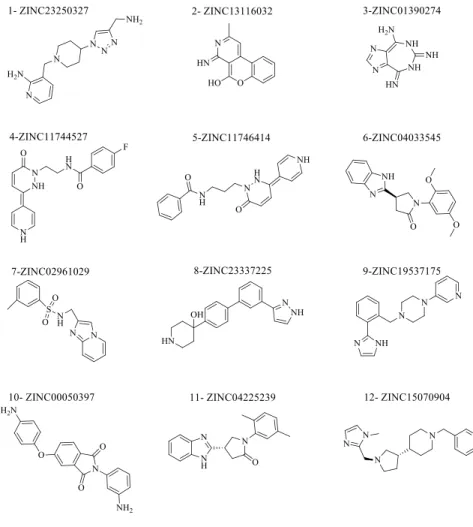
Of the 239,737 compounds scored by the XP algorithm using the chosen grid file, 12 with the highest score were sorted in descending order with ZINC database codes and evaluated for biological activity (Figure 2). The reason for selecting the top 12 compounds was that Compound 13 was the first active compound after the docking procedure and had the following structure; methyl 3-{[(4-[(3,4-dichlo-robenzyl)oxy]-1H-indazol-3-yl)methyl]amino}cyclohexanecarboxylate. This ac-tive structure of Compound 13 has also been reported in previous studies21,22.
Figure 2: Compounds of the test set that scored highest using the XP algorithm.
Biological activity
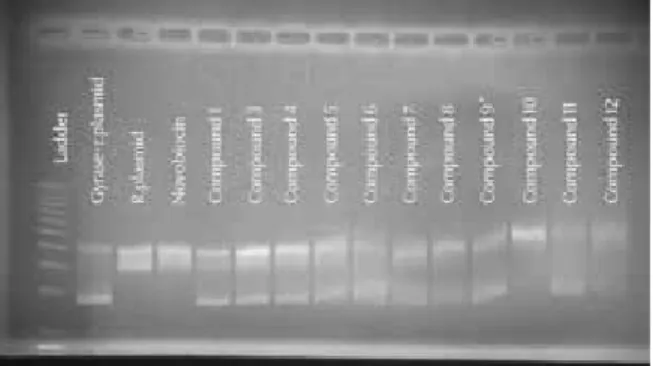
Compound 2 was synthesized with <95% purity and thus was discarded from biological testing. The remaining eleven compounds were tested against stand-ard novobiocin with the MT gyrase supercoiling assay at the concentrations of 1 mg/20µL, 1 mg/50µL and 1 mg/100µL (w/v). Among all compounds, only Com-pound 10 with the 5-(4-aminophenoxy)-2-(3-aminophenyl)-2,3-dihydro-1H-izoindole-1,3-dione structure showed a similar inhibitor activity compared to the standard. The results of gel electrophoresis at 1 mg/100µL concentration of each compound are given in Figure 3.
Figure 3: Results of gel electrophoresis with 1 mg/100µL (w/v) dilution super-coiled (Gyrase+r. plasmid), relaxed (r. plasmid) Novobiocin (r. plasmid+gyrase+novobiocin)
Additional analyses for the activity of Compound 10 were performed in decreas-ing order within a concentration rage of 0.1 to 2 mg/100 µL (2.8-57 mM) com-pared to the same concentrations of novobiocin (1.6-32 mM) (Figure 4). The re-sults clearly showed that Compound 10 had similar effectiveness to the standard and needed further evaluation as a core.
Figure 4: Efficiency scale of increasing concentrations of novobiocin and Compound 10 in the existence of gyrase super-coiled and relaxed plasmid (Gyrase + Plasmid).
MIF and distance/interaction probability analysis
The MIF analysis between the homology model and Compound 10 based on the selected probes of GRID 22c demonstrated that ROR and RCOR probes were not effective. The visualisations of R-NH2 (including unbounded electrons), R1R2NH (including unbounded electrons), CONH2, R-OH, Ph-OH, water and hydropho-bic probes are presented in Figure 5.
Figure 5: MIFs of Compound 10 with different probes
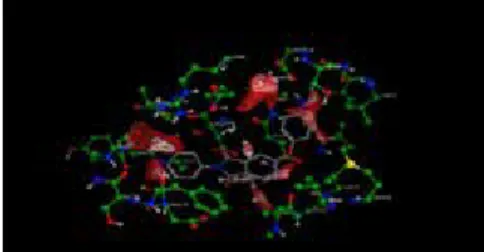
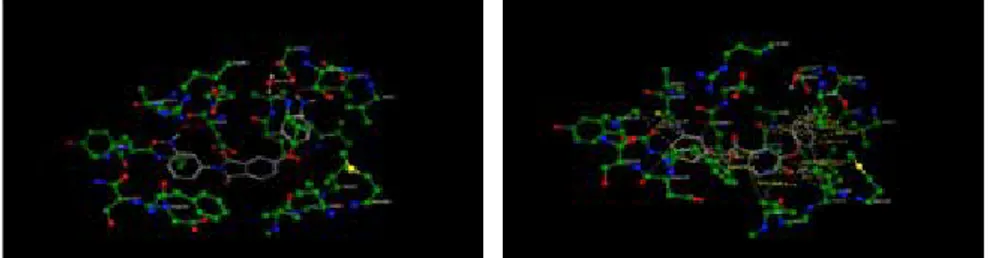
H-bond and hydrophobic interaction distances and probabilities between Com-pound 10 and the homology model were examined using the ‘Ligand-receptor contacts (visualisation+scoring)’ svl in the MOE software based on Bohm’s simi-lar calculation algorithm (Figure 6).
Both primary amine groups belonging to the phenoxy and phenyl substituents of Compound 10 were susceptible to the H-bonds with ASP 79 and 55 at a percent-age of 81 (distance (d):2.7Ao) and 22 (d: 3.4Ao), respectively. Furthermore, hy-R-NH2 (red) and R1R2NH (white)
R-OH (red) and Ph-OH (white) H2O (yellow)
drophobic interaction tendencies were observed between the ligands’ aromatic groups and the active site. The first was between the 4-aminophenyl group and the surrounding Asp 55, Phe 109, Ser, 111 and Ala 11 amino acids. The second interaction was between the central isoindole ring and the surrounding Phe 109, Val 113, Val 123 (81-89%, d: 4.4-4.6 Ao)). Finally, the 3-aminophenyl group and
the surrounding Ala 53, Ile 84, Val 125 and Val 171 were found to have a hydro-phobic interaction(81-92%, d: 4.3-4.6 Ao).
The MIF analysis showed that the 4-aminophenyl group fits into the hydropho-bic pocket surrounded by Val; 49, 77, 125, 171, Ile 84 and Arg 92. The same site controls the condensed phenyl part of the isoindole ring providing an angle be-tween the ether bridge and the 4-aminophenyl group. The 3- aminophenyl group interacts with Ala 59, Ser 111 and Asp 110 alpha carbons on the loop site of a protein. Therefore, the most appropriate structures for the hydrophobic pocket appear to be the aromatic ones. The substituted amines, hydroxyl or the amide functional group seemed to facilitate better interactions than the primary amine of the phenyl group. The distance between the isoindole ring and the 4-ami-nophenoxy group should be maximum 1.4 Ao. Ether bridge is not actually a
re-quirement for receptor-ligand interaction. Furthermore, the 4th carbon of the
isoindole ring can be converted to nitrogen for more suitable interactions. In addition, we suggest that amino substation on the 3rd carbon of the phenyl group
should be re-located to the 4th and 5th positions to increase the activity. The
at-tachment of probable hydrogen bonding groups to the phenyl ring appears to be suitable for accurate bonding with Asp55. The results indicate that preserving the isoindole ring system is important for modifications to the ring system and for hydrophobic stabilisation with the surrounding amino acids.
The results of this study showed that ROC curves can be effectively used for the correction of scoring functions not only in x-ray crystallographic data, but also in homology models. For future work, we are planning to use the results of MIF and interaction probability to design new isoindole derivatives, which may be beneficial for DNA gyrase B ATPase inhibition.
Figure 6: H-bond and hydrophobic interaction distances and probabilities between Compound 10 and the homology model (H-bonds: left-white, hydrophobic interactions: right-yellow)
ACKNOWLEDGEMENT
This work was financially supported by the Scientific and Technological Re-search Council of Turkey (TÜBİTAK), Grant Number: SBAG-110S017.
REFERENCES
1. Tomioka, H.; Namba, K., [Development of Antituberculous Drugs: Current Status and Future Prospects]. Kekkaku : [Tuberculosis] 2006, 81 (12), 753-774.
2. Us, D.; Berk, B.; Gurdal, E., et al., Mannich Base Derivatives of 3-Hydroxy-6-Methyl-4h-Pyran-4-One with Antimicrobial Activity. Turk. J. Chem. 2010, 34 (3), 447-456.
3. Katoch, V. M., Infections Due to Non-Tuberculous Mycobacteria (Ntm). Indian J. Med. Res. 2004, 120 (4), 290-304.
4. Cole, S. T.; Brosch, R.; Parkhill, J., et al., Deciphering the Biology of Mycobacterium Tubercu-losis from The Complete Genome Sequence. Nature 1998, 393 (6685), 537-544.
5. Khisimuzi, M.; Zhenkun, M., Mycobacterium Tuberculosis DNA Gyrase as a Target for Drug Discovery. Infect. Disord. Drug Targets 2007, 7 (2), 159-168.
6. Maxwell, A., DNA Gyrase as a Drug Target. Trends Microbiol. 1997, 5 (3), 102-109. 7. Leone, R.; Venegoni, M.; Motola, D., et al., Adverse Drug Reactions Related to the Use of Fluoroquinolone Antimicrobials: An Analysis of Spontaneous Reports and Fluoroquinolone Consumption Data from Three Italian Regions. Drug Safety 2003, 26 (2), 109-120.
8. Us, D.; Gurdal, E.; Berk, B., et al., 4h-Pyran-4-One Derivatives:; Leading Molecule for Prepa-ration of Compounds with Antimycobacterial Potential. Turk. J. Chem. 2009, 33 (6), 803-812. 9. McInnes, C., Virtual Screening Strategies in Drug Discovery. Curr. Opin. Chem. Biol. 2007,
11 (5), 494-502.
10. Greer, J.; Erickson, J. W.; Baldwin, J. J.; Varney, M. D., Application of the Three-Dimen-sional Structures of Protein Target Molecules in Structure-Based Drug Design. J. Med. Chem. 1994, 37 (8), 1035-1054.
11. Gubernator, K.; Bèohm, H.-J., Structure-Based Ligand Design. Wiley-VCH: Weinheim ; New York, 1998; p xiv, 153 p.
12. Capdeville, R.; Buchdunger, E.; Zimmermann, J.; Matter, A., Glivec (Sti571, Imatinib), a Rationally Developed, Targeted Anticancer Drug. Nat. Rev. Drug Discov. 2002, 1 (7), 493-502. 13. Kroemer, R. T., Structure-Based Drug Design: Docking and Scoring. Curr. Protein Sept. Sci. 2007, 8 (4), 312-328.
14. Rester, U., From Virtuality to Reality - Virtual Screening in Lead Discovery and Lead Opti-mization: A Medicinal Chemistry Perspective. Curr. Opin. Drug Discov. Devel. 2008, 11 (4), 559-568.
15. Blower, T. R.; Williamson, B. H.; Kerns, R. J.; Berger, J. M., Crystal Structure and Stability of Gyrase-Fluoroquinolone Cleaved Complexes from Mycobacterium Tuberculosis. Proc. Natl.
Acad. Sci. U S A 2016, 113 (7), 1706-1713.
16. Agrawal, A.; Roue, M.; Spitzfaden, C., et al., Mycobacterium Tuberculosis DNA Gyrase At-pase Domain Structures Suggest a Dissociative Mechanism That Explains How Atp Hydrolysis Is Coupled to Domain Motion. Biochem. J. 2013, 456 (2), 263-273.
17. Shirude, P. S.; Madhavapeddi, P.; Tucker, J. A., et al., Aminopyrazinamides: Novel and Spe-cific Gyrb Inhibitors That Kill Replicating and Nonreplicating Mycobacterium Tuberculosis.
ACS Chem. Biol. 2013, 8 (3), 519-523.
18. Lamour, V.; Hoermann, L.; Jeltsch, J. M., et al., An Open Conformation of the Thermus Thermophilus Gyrase B Atp-Binding Domain. J. Biol. Chem. 2002, 277 (21), 18947-18953. 19. Berk, B.; Us, D.; Oktem, S., et al., Molecular Modeling and Antimycobacterial Studies of Mannich Bases: 5-Hydroxy-2-Methyl-4h-Pyran-4-Ones. Turk. J. Chem. 2011, 35 (2), 317-330. 20. Maxwell, A.; Burton, N. P.; O’Hagan, N., High-Throughput Assays for DNA Gyrase and Other Topoisomerases. Nucleic Acids Res. 2006, 34 (15), e104.
21. Tanitame, A.; Oyamada, Y.; Ofuji, K., et al., Design, Synthesis and Structure-Activity Rela-tionship Studies of Novel Indazole Analogues as DNA Gyrase Inhibitors with Gram-Positive Antibacterial Activity. Bioorg. Med. Chem. Lett. 2004, 14 (11), 2857-2862.
22. Tanitame, A.; Oyamada, Y.; Ofuji, K., et al., Potent DNA Gyrase Inhibitors; Novel 5-Vi-nylpyrazole Analogues with Gram-Positive Antibacterial Activity. Bioorg. Med. Chem. Lett. 2004, 14 (11), 2863-2866.