ESSAYS ON MACROECONOMICS
A Ph.D. Dissertation
by
HATİCE GÖKÇE KARASOY CAN
Department of
Economics
İhsan Doğramacı Bilkent University
Ankara
ESSAYS ON MACROECONOMICS
The Graduate School of Economics and Social Sciences of
İhsan Doğramacı Bilkent University
by
HATİCE GÖKÇE KARASOY CAN
In Partial Fulfillment of the Requirements for the Degree of DOCTOR OF PHILOSOPHY IN ECONOMICS
THE DEPARTMENT OF ECONOMICS
İHSAN DOĞRAMACI BİLKENT UNIVERSITY ANKARA
ABSTRACT
ESSAYS ON MACROECONOMICS
Karasoy Can, Hatice GökçePh.D., Department of Economics Supervisor: Assist. Prof. Dr. Sang Seok Lee
May 2018
This dissertation consists of four essays on macroeconomics with a special empha-sis on monetary economics and corporate finance. It presents empirical evidence for the floating rate channel in monetary policy transmission, highlighting the role of debt maturity when measuring cash flow exposure and its association with future path of policy. It then builds a theoretical model with New Key-nesian properties in which endogenous borrowing constraints are source of am-plification of fundamental shocks. The two blocks of the thesis, both empirical and theoretical essays, uncover the floating rate channel of monetary policy, with a comprehensive understanding and interpretation of corporate debt maturity, nature of repayment structure and forward guidance.
The first essay investigates firm level stock price changes around monetary policy announcements in an event study framework, and finds that firms that have issued more floating rate debt see their stock prices affected more. Importantly,
it shows that debt maturity is a crucial component of cash flow exposure. The firms with floating rate liabilities at longer maturities experience steeper fall in their stock prices. In addition to this, it provides further evidence regarding the floating rate channel by demonstrating that for the firms which hedge themselves against interest rate risk, the effect of the policy shock is mitigated. This indicates financial market sophistication, which is further explored in the form of statistical tests.
Further, it is the path, or forward guidance component of monetary policy shock that triggers this channel since this is the aspect of the policy that shapes ex-pectations about future short rates hence future floating rate debt payments. The results show that, in the zero lower bound period the floating rate channel continued to be effective because of forward guidance surprises.
It is shown that this effect is not a result of rule of thumb behavior, and that the marginal stock market participant actually studies and correctly interprets the liability side of firm balance sheets. The tests of financial market sophistication, which are novel, contribute to the empirics of market rationality. Furthermore, the floating rate exposure at the time of monetary policy surprises predicts future investment and profitability, verifying the pricing decision and also providing evidence of another channel for monetary policy, due to financial effects. In short, this essay provides a detailed analysis of neo-classical monetary policy transmission involving firm balance sheets and provides a small glimpse of what lies behind Bernanke and Gertler’s (1995) “black box”.
regression model specifications to those in the first essay. This essay discusses the existence of floating rate channel for samples of different firm size classes, and for samples including or excluding specific sub-sectors. It shows that for small-sized firms, the channel is not evident, presumably resulting from the fact that their access to floating rate debt market is limited. This warrants further analysis, which will be taken up in the future. It confirms the cash flow effect and the protective power of hedging increases when the analysis excludes both financials and utilities sectors. Furthermore, it analyzes various specifications with additional control variables, time fixed effects, and provides further evidence for the zero lower bound period.
The third essay builds a simple model in which both short term and long term debt co-exist. The essay is motivated by empirical papers which show that firms match their debt maturity structure and asset maturity. The model assumes that the sector which has long-lived capital is financed by long term debt, and the sector which has short-lived capital is financed by short term debt. The simple model provides an environment to discuss the sector-specific effects of the aggregate shocks and macro-prudential policies.
In the second part of the essay, the simple real model is extended to a New Keynesian dynamic stochastic general equilibrium model which embeds nominal frictions due to price stickiness, which creates a role for monetary policy. The extended model has various policy implications. The impulse response functions to a similar monetary policy shock show that floating rate debt might be more disruptive for consumption. Moreover monetary policy is less effective in the
floating rate case. These are in accordance with the findings of floating rate debt literature.
Moreover it shows that lengthening the maturity of floating rate debt puts long term debt financed entrepreneurs into a more vulnerable position. This supports empirical findings in the first and second essay. The specific type of corporate debt that is used to finance investment, which eventually turns into production, plays a significant role in determining future cash flows, and that in turn is quite important for understanding monetary policy transmission.
The fourth essay, which is the final essay of the thesis, is included to fulfill the publication requirement. It assesses empirically whether consumer confidence in-dices contain information about future private consumption growth in Turkey. To this end, empirical models for quarterly total, durable and nondurable consump-tion growth with and without sentiment indicators are presented, and in-sample forecasts and one-step-ahead out-of-sample forecasts from recursive OLS esti-mates are evaluated. It is demonstrated that consumer confidence indices are informative about consumption, however once other macro economic variables (e.g., exchange rate, labor income, real interest rate etc.) are included, gains from them in out-of-sample forecasts decrease significantly. Moreover there is no clear evidence for either precautionary savings motive or permanent income hypothesis.
Keywords: Cash flow effect of monetary policy, Financial frictions, Floating rate debts, Interest rate risk hedging, New Keynesian models with debt maturity.
ÖZET
MAKROEKONOMİ ÜZERİNE MAKALELER
Karasoy Can, Hatice GökçeDoktora, İktisat Bölümü
Tez Danışmanı: Dr. Öğr. Üyesi Sang Seok Lee Mayıs 2018
Bu tez, özellikle parasal iktisat ve kurumsal finans alanı ile ilgili dört makaleden oluşmaktadır. Tezde, parasal aktarımda değişken faizden borçlanmanın rolü ile ilgili deneysel bulgular ortaya konmuş ve yatırımların bir kısmının borçlanarak karşılandığı teorik bir modelde, uzun dönemli ve değişken faizli borçların rolü, yeni Keynesgil bakış açısı ile tartışılmıştır. Para politikasının geleceğe ilişkin sür-prizlerinin (sözlü yönlendirme), mevcut faiz oranına ilişkin sürprizlerinden farkı ve nakit akışı beklentilerinde borç vadesinin önemi gösterilmiş; hem deneysel hem de teorik olarak değişken faizli borçlanmanın parasal aktarımdaki etkisi tartışılmıştır.
İlk makalede, hisse senedi piyasasında işlem gören büyük ölçekli firmaların hisse senedi fiyatlarının para politikasından nasıl etkilendikleri incelenmiştir. Vaka analizi çerçevesinde incelenen bulgular, para politikası karar günlerinde (Federal Open Market Committee meeting days) değişken faizden borçlanan firmaların
hisse senedi fiyatlarının, politika şoklarına daha yüksek tepki verdiğini göster-mektedir. Beklenen nakit akışı değişiminin ölçümünde, değişken faizli borç tu-tarı kadar borcun vadesinin de önemli olduğu vurgulanmaktadır. Ayrıca, ken-disini faiz oranı riskine karşı korumaya alan (hedging) firmalar, şoklardan da daha az etkilenmektedir. Bu kanalın işlerliğinin, para politikasının bugünkü faiz oranına ilişkin sürprizlerinden ziyade; geleceğe yönelik sürprizlerine (sözlü yön-lendirme) bağlı olduğu gösterilmiştir. Bu etkinin piyasa katılımcıları tarafından benimsenmiş bir ataletten kaynaklanmadığı; yatırımcıların, firmaların bilanço-larını, borç ve faiz oranı riskine karşın korunma bilgilerini gerçekten takip edip etmedikleri çeşitli istatistiksel testlerle tartışılmıştır. Son olarak, para politikası şokuna maruz kalındığı esnada sahip olunan değişken faizli borcun yarattığı nakit akışı beklentisinin, sonraki dönemlerdeki sermaye yatırımı, stok ve karlılık gibi değişkenleri anlamlı ölçüde etkilediği gösterilmiştir.
İkinci makalede, ilk makaleye ilave deneysel testler sunulmaktadır. Bu bölümde firma örnekleminin orta ve küçük ölçekli firmaları da içerek şekilde genişletilmesi, finansal ya da elektrik, su, gaz dağıtımı gibi sektörlerin dahil edilip edilmemesi durumunda ortaya çıkan sonuçlar tartışılmıştır. Ayrıca ilk makalede tartışılan parasal aktarım mekanizmasının, sıfır alt tabanı döneminde de (2009-2014) çalış-maya devam ettiğine ilişkin ek analizler yapılmıştır.
Üçüncü makalede, kısa ve uzun vadeli firma borcunun birlikte incelenebildiği ba-sit bir teorik model kurulmuştur. Literatürde, firmaların borçlanacakları vadeyi seçerken önemli motivasyonlarından birisinin varlık ve nakit akışlarının vadesi olduğu gösterilmektedir. Buradan hareketle uzun ömürlü sermayeye sahip olan
firmaların uzun vadeli borçlanabileceği, kısa ömürlü sermayeye sahip olan fir-maların ise kısa vadeli borçlanabileceği bir yaklaşım benimsenmiştir. Böylece her iki borçlanma tipine karşı makro ihtiyati tedbirler dahil olmak üzere çeşitli şokların tartışılabileceği bir temel hazırlanmıştır.
Bu makalenin ikinci kısmında, modele fiyat katılıkları gibi Yeni Keynesyen özel-likler eklenmiş ve para politikasının rolü incelenmiştir. Genişletilmiş model, pek çok politika sorusunun tartışılabileceği bir yapıdadır. Benzer sıkılaştırıcı para politikası şoklarına maruz kalan, sabit faizli ve değişken faizli uzun dönemli borçlanma araçlarını kullanan modeller kendi aralarında kıyaslandığında; değişken faizli ekonomide tüketimin daha kötü etkilendiği ve para politikasının daha etki-siz olduğu gözlenmektedir. Bu bulgu, değişken faiz ve parasal aktarımı inceleyen literatür ile uyumludur. Ayrıca, değişken faizli borcun ortalama vadesinin uzun ve kısa olduğu modeller birbirleri ile kıyaslandığında; daha uzun vadenin, fir-maları şoklardan daha fazla etkilenir hale getirdiği gösterilmiştir. Bu bulgular, ilk makaledeki ampirik sonuçlar ile uyumludur.
Son makale ise yayın zorunluluğunu yerine getirmek amacı ile teze eklenmiştir. Türkiye ekonomisine ilişkin olan bu bölüm, tüketici güven endekslerinin özel tüke-tim büyümesini tahmin etme gücünü değerlendirmektedir. Buna göre, toplam tüketim, dayanıklı mal tüketimi ve dayanıksız mal tüketimindeki büyümeler için, çeyreklik veri ile en küçük kareler yöntemi kullanılarak güven endekslerini dahil eden ve etmeyen tahmin modelleri oluşturulmuştur. Ayrıca ihtiyati tasarruf hipotezi de test edilmiştir. Sonuçlar, güven endekslerinin özel tüketim büyüme-sine ilişkin bilgi içerdiğine; ancak bu bilginin, diğer makro değişkenler tahmin
modellerine eklendiğinde önemini büyük ölçüde kaybettiğine işaret etmektedir.
Anahtar Kelimeler: Borçlanma vadesi, Finansal friksiyonlar, Para politikası, Vaka analizi, Yeni Keynesyen modeller.
ACKNOWLEDGEMENTS
The creation of a doctoral thesis is only possible by a group of supportive indi-viduals for whom I am full of indebted.
First and foremost, I would like to express my sincere gratitude to my advisor Professor Sang Seok Lee for his continuous support and encouragement through my journey. I feel honored and fortunate to have been his first PhD student. As being such an exceptional thesis advisor with his intellectual discipline and diligence, he will continue to constitute a role model for the rest of my academic life.
I am also grateful to Professor Refet Gürkaynak. It was his inspirational class that motivated me to study macroeconomics in the first place. His approach to research, eagerness to dig more and curiosity has taught a lot to me. With his guideline and thought-provoking conversations, I was able to come up with an interesting research question.
Through my years at Bilkent, I had the privilege to meet with and learn from excellent scholars. I gratefully acknowledge the support and guidance of Tanseli Savaşer, Başak Tanyeri, Banu Demir Pakel, and Çağrı Sağlam throughout my graduate studies. I would also like to thank Serdar Sayan, Onur Taş and Levent
Akdeniz for evaluating and commenting on my thesis.
My years at Bilkent endowed me with great friends. First, I would like to thank Elif Özcan who happens to be my first roommate at dormitory, my best compan-ion and fellow traveler to Bilkent in the past couple of years. I feel very happy that we shared this journey together. I would also like to thank all friends from my graduate school for their continuous support and making my graduate years en-joyable; Seçil Yıldırım, Gülserim Özcan, Alican Aytaç, Sümeyra Korkmaz, Merve Demirel, Berk İdem and Ömer Faruk Akbal.
The financial support of TÜBİTAK during my studies is acknowledged.
I am also very indebted to people at the Central Bank of Republic of Turkey, Monetary Policy and Research Department for their flexibility and encourage-ment. Special thanks to Murat Duran, Mustafa Bulut and Binnur Balkan for all the fun and cheerful memories. I am very grateful to my supervisor Hande Küçük Yeşil who has been not only a manager but also a close friend. She pro-vided continuous support and sympathy to me throughout my graduate studies. I am grateful to Tayyar Büyükbaşaran for being the most supportive office mate. I would also like to thank Çağlar Yüncüler with whom; I shared first publication experience which is very valuable to me.
I am grateful for the support and camaraderie provided by the brilliant team of friends. I would like to thank to Sema Yılmaz, Demet Yavuz, Çiğdem Usta and Türkan Karatay. Since my undergraduate years, they are always there for me. They are the ones who always supported me through thick and thin, and cheer me up when I need. I am grateful to Özge Gün for her everlasting friendship.
Even though, we live in different countries now, I always feel her support and affection for me.
None of my accomplishments in this life, including this dissertation, would be possible if it were not for my parents. I cannot thank enough for their endless support, kindness and love, I owe it all to them. I am also thankful to them for blessing me with the most amazing brother one could have, Bayındır. He is my best friend, and there is no better feeling than knowing that he is, and always will be there when I need. I am deeply grateful to Ayşe, who has become a true sister to me. I thank her not only for providing me moral and emotional support but also her creativity and ability to come up with excellent solutions when I ask something.
Last but not least, I would like to thank Yusuf, who brightens up my world with his existence. I am not grateful to him only for his support for this dissertation but for all the things he brought into my life. I am thankful for his eternal love and continuous encouragement. He is my other half and I am truly blessed to have him.
TABLE OF CONTENTS
ABSTRACT . . . . iii
ÖZET . . . . vii
TABLE OF CONTENTS . . . xiv
LIST OF TABLES . . . .xviii
LIST OF FIGURES . . . xxi
CHAPTER 1: INTRODUCTION . . . . 1
CHAPTER 2: STOCK MARKET’S ASSESSMENT OF MON-ETARY POLICY TRANMISSION: THE CASH FLOW EFFECT . . . . 9
2.1 Introduction . . . 9
2.2 Related Literature . . . 13
2.3 Data and Summary Statistics . . . 17
2.3.1 Monetary Policy Data . . . 17
2.3.2 Firm-level Data . . . 21
2.4 Cash Flow Effect of Monetary Policy . . . 28
2.4.2 Results . . . 31
2.5 Sophistication or Rules of Thumb? . . . 38
2.6 Robustness . . . 41
2.7 Balance Sheet Regressions . . . 46
2.8 Conclusion . . . 53
CHAPTER 3: ROBUSTNESS CHECKS TO THE CASH FLOW EFFECT . . . . 56
3.1 Introduction . . . 56
3.2 Different Sample Selections . . . 57
3.3 Stock Returns in One Day Window . . . 60
3.4 Different Data Treatments . . . 60
3.5 Different Control Measures . . . 62
3.6 Time Fixed Effects . . . 68
3.7 More Evidence on the Cash Flow Effect during the ZLB Period . 71 3.8 Conclusion . . . 73
CHAPTER 4: MODELING DEBT MATURITY IN GENERAL EQUILIBRIUM . . . . 74
4.1 Introduction . . . 74
4.2 Literature Review . . . 78
4.3 Model . . . 82
4.3.1 Long-term and Short-term Debt Structure . . . 85
4.3.2 Households . . . 86
4.3.3 Short-lived-capital Good Entrepreneurs . . . 89
4.3.5 Market Clearing Conditions . . . 95
4.3.6 Calibration . . . 95
4.4 Impulse Responses of Macroeconomic Variables to Temporary Shocks 96 4.5 Simulated Paths under Permanent Shocks . . . 101
4.6 Extended Model Under Nominal Rigidities with Monetary Policy 104 4.6.1 Model . . . 105
4.6.2 Households . . . 106
4.6.3 Entrepreneurs . . . 107
4.6.4 Retailers and Price Stickiness . . . 110
4.6.5 Monetary Policy and Market Clearing . . . 115
4.6.6 Calibration . . . 116
4.6.7 Impulse Responses of Macroeconomic Variables to Tempo-rary Shocks . . . 116
4.7 Floating Rate Long-term Debt . . . 123
4.7.1 Compare Maturity for Floating Rate Debt: Responses to Monetary Policy Shock . . . 126
4.7.2 Compare Fixed vs. Floating: Responses to Monetary Pol-icy Shock . . . 130
4.8 Conclusion . . . 131
CHAPTER 5: THE EXPLANATORY POWER AND THE FORE-CAST PERFORMANCE OF CONSUMER CON-FIDENCE INDICES FOR PRIVATE CONSUMP-TION . . . 137
5.2 Data . . . 142
5.3 Empirical Analysis . . . 145
5.3.1 Estimations for Total Private Consumption Growth . . . . 148
5.3.2 Estimations for Durable and Nondurable Consumption . . 152
5.4 Out of Sample Forecast Performance . . . 157
5.5 Consumer Confidence and Consumption Theories . . . 160
5.6 Conclusion . . . 163
REFERENCES . . . 166
APPENDICES . . . 173
A Breakdowns of Debt Items and Additional Regression Results173 B Summary of Data Construction . . . 179
C On Borrowing Constraint . . . 179
D Impulse Response Functions for Selected Shocks . . . 182
E Selected Impulse Responses in the Extended Model . . . . 184
LIST OF TABLES
2.1 Summary Statistics for Balance Sheet Variables . . . 27
2.2 Pre-ZLB . . . 34
2.3 Including ZLB . . . 37
2.4 Differences between High and Low Exposure Firms (in Percentage Points) . . . 38
2.5 Differences between Hedgers and Non-Hedgers (in Percentage Points) 39 2.6 Stock Market Sophistication . . . 42
2.7 Robustness in Pre-ZLB . . . 44
2.8 Robustness including ZLB . . . 45
2.9 Placebo Tests . . . 46
2.10 Balance Sheet Regressions: Capital Investment . . . 50
2.11 Balance Sheet Regressions: Inventory Investment . . . 51
2.12 Balance Sheet Regressions: Profits over Total Assets . . . 52
3.1 Sample of Large-cap and Mid-cap Firms . . . 58
3.2 Regressions with one day window . . . 61
3.3 Pre-ZLB: different statistical treatments . . . 63
3.4 Including ZLB: different statistical treatments . . . 64
3.5 Pre-ZLB: Different control measures . . . 66
3.7 Pre-ZLB: Time fixed effects . . . 69
3.8 Including ZLB and time dummies . . . 70
3.9 Regressions for the period 2009-2014 . . . 72
5.1 Simple Benchmark Regressions on Consumption Aggregates . . . 149
5.2 Total Private Consumption Growth Estimation Results with Con-sumer Confidence Indices . . . 150
5.3 Total Private Consumption Growth Estimation Results with Con-sumer Confidence and Additional Variables . . . 151
5.4 Durable Consumption Growth Estimation Results Regressions with Consumer Confidence Indicators . . . 154
5.5 Nondurable Consumption Growth Estimation Results with Con-sumer Confidence Indicators . . . 155
5.6 Nondurable Consumption Growth Estimation Results with Addi-tional Variables and Consumer Confidence Indices . . . 156
5.7 RMSFEs for Various Forecast Models for Consumption Aggregates 159 5.8 Consumption Growth Estimation Results for Testing Permanent Income . . . 162
1 Total Debt Composition . . . 173
2 Total Floating Rate Debt Composition . . . 174
3 Descriptive Statistics for Floating Rate Debt Items . . . 175
4 Maturity/Interest Rate Type Pairs for Debts . . . 175
5 Descriptive Statistics for Debts by Maturity . . . 176
6 A Replication of Ippolito et al. (2017) . . . 176
8 Balance Sheet Regressions: Coverage Ratio . . . 178 9 Summary of Data Construction . . . 179
LIST OF FIGURES
2.1 Daily Aggregate Stock Price Changes in Response to Kuttner Shocks 18 2.2 Daily Aggregate Stock Price Changes in Response to GSS Shocks 21 2.3 Floating Rate Debt Leverage and Bank Debt Leverage . . . 25 2.4 Floating Rate Exposure and Bank Debt Leverage . . . 25 2.5 Floating Rate Exposure over Deciles of Bank Debt Leverage . . . 26
4.1 Baseline Model IRFs: A Positive Shock to AL
t (1) . . . 98
4.2 Baseline Model IRFs: A Positive Shock to AL
t (2) . . . 99
4.3 Baseline Model IRFs: A Negative Shock to χLt (1) . . . 100 4.4 Baseline Model IRFs: A Negative Shock to χL
t (2) . . . 100
4.5 Baseline Model IRFs: A Positive Shock to φt (1) . . . 101
4.6 Baseline Model IRFs: A Positive Shock to φt (2) . . . 102
4.7 Baseline Model MIT Shocks: A Negative Shock to χL
t (1) . . . 103
4.8 Baseline Model MIT Shocks: A Negative Shock to χL
t (2) . . . 103
4.9 Baseline Model MIT Shocks: A Positive Shock to φt (1) . . . 104
4.10 Baseline Model MIT Shocks: A Positive Shock to φt (2) . . . 105
4.11 Extended Model IRFs: A Positive Shock to AL
t (1) . . . 117
4.12 Extended Model IRFs: A Positive Shock to ALt (2) . . . 118 4.13 Extended Model IRFs: A Positive Shock to AL
t (3) . . . 118
4.14 Extended Model IRFs: A Negative Shock to χL
4.15 Extended Model IRFs: A Negative Shock to χLt (2) . . . 120 4.16 Extended Model IRFs: A Negative Shock to χL
t (3) . . . 120
4.17 Extended Model IRFs: A Positive Shock to φt (1) . . . 122
4.18 Extended Model IRFs: A Positive Shock to φt (2) . . . 122
4.19 Extended Model IRFs: A Positive Shock to φt (3) . . . 123
4.20 Extended Model IRFs: A Positive Shock to Policy Rate (1) . . . . 124 4.21 Extended Model IRFs: A Positive Shock to Policy Rate (2) . . . . 124 4.22 Extended Model IRFs: A Positive Shock to Policy Rate (3) . . . . 125 4.23 Comparison of Long vs. Short Maturity: Responses to positive
monetary policy surprise (1) . . . 127 4.24 Comparison of High vs. Low Maturity: Responses to positive
mon-etary policy surprise (2) . . . 128 4.25 Comparison of High vs. Low Maturity: Responses to positive
mon-etary policy surprise (3) . . . 128 4.26 Comparison of High vs. Low Maturity: Responses to positive
mon-etary policy surprise (4) . . . 129 4.27 Comparison of High vs. Low Maturity: Responses to positive
mon-etary policy surprise (5) . . . 129 4.28 Impulse Responses Differences: High-Low Maturity . . . 130 4.29 Comparison of Floating vs. Fixed: Responses to positive monetary
policy surprise (1) . . . 131 4.30 Comparison of Floating vs. Fixed: Responses to positive monetary
4.31 Comparison of Floating vs. Fixed: Responses to positive monetary policy surprise (3) . . . 132 4.32 Comparison of Floating vs. Fixed: Responses to positive monetary
policy surprise (4) . . . 133 4.33 Comparison of Floating vs. Fixed: Responses to positive monetary
policy surprise (5) . . . 133 4.34 Impulse Responses Differences: Floating-Fixed Maturity . . . 134
5.1 Consumer Confidence Indices and The Growth Rate of Private Consumption . . . 140 5.2 Timeline for Data Releases . . . 145 3 Baseline Model IRFs: A Positive Shock to AS
t (1) . . . 182
4 Baseline Model IRFs: A Positive Shock to AS
t (2) . . . 183
5 Baseline Model IRFs: A Negative Shock to χSt (1) . . . 183 6 Baseline Model IRFs: A Negative Shock to χS
t (2) . . . 184
7 Extended Model IRFs: A Positive Shock to AS
t (1) . . . 185
8 Extended Model IRFs: A Positive Shock to ASt (2) . . . 185 9 Extended Model IRFs: A Positive Shock to AS
CHAPTER 1
INTRODUCTION
Monetary policy is transmitted through real economy by various channels. There has been continuous effort to explore these channels, in order to examine their empirical relevance by both academics and policy makers. Theoretical models with financial frictions have put forward the balance sheet channel and proposed to explain long-lasting effects of monetary policy through this. A contractionary monetary policy shock affects balance sheet of firms in two ways. First, it weakens the net worth of the firm and destroys firm’s borrowing capacity. Second, it affects the value of outstanding debts and assets, and as a result of this total cash flow becomes reduced (Bernanke and Gertler, 1995). This thesis is mainly concerned with the second aspect of the balance sheet channel, and explores the cash flow effects of outstanding debt.
The thesis contributes to the empirical and theoretical literature on the transmis-sion mechanisms of monetary policy. When there is an interest rate hike, the cash flow effect of monetary policy does not work only through the total value of debt or leverage. Instead, I argue that maturity also matters. Monetary policy shock
affects the future repayments of debt through i) changes in the present value of debt and ii) changes in expected interest rates in the future periods. Specifically, if the debt is written down on the floating rate basis, changes in expected interest rates directly affect cash (out)flows, whereas the present value of the debt changes slightly or does not change at all.
The empirical chapters in the thesis pursue detailed investigations on the floating rate debt channel and show that this channel operates with surprises regarding to the future path of monetary policy. Then, it turns to a deeper question: should monetary policy makers be concerned with corporate debt maturity ? To this end, the theoretical chapter builds a simple general equilibrium model featuring debt maturity and various policy instruments.
The second chapter studies stock market reaction to monetary policy at the level of individual firms’ equity prices. This chapter uses an event study approach to test whether the stock prices of firms, who have more cash flow exposure due to having issued more floating rate debts, respond more to monetary policy surprises in high frequency. It offers strong evidence on the floating rate debt channel, with a novel “cash flow exposure” measure. To identify firm’s exposure to floating rate debts, this measure takes into account the maturity of each debt item and multiplies it by the corresponding leverage ratio, and sums across them for each balance sheet period. It is shown that this measure is indeed the one that stock market participants react to. In addition to this, we provide further evidence for the floating rate channel by demonstrating that the negative effects of a contractionary surprise is reduced for the firms which engage in hedging
activities against interest rate risk of their floating rate obligations.
This chapter also highlights how and what kind of monetary policy surprises matters. It points out an important role played by surprises about future path of interest rates, and the interaction of this surprise with cash flow exposure. Among the empirical papers which study the relationship between asset prices and monetary policy, this study is the first one to present the transmission channel which works through expected cash flow exposure and future path of interest rates. The analysis also shows that floating rate channel was just as effective inside the zero lower bound on the nominal interest rate, which strengthens my case.
Next, we investigate whether the marginal stock market investor truly distin-guishes firms based on their balance sheet conditions, (e.g., how much floating rate exposure they have, how much of them are hedged etc.) and correctly prices, or learns rules of thumb where certain firms fare worse in reaction to policy sur-prises. Using formal statistical tests, we conclude that marginal stock market investor is quite sophisticated.
We then turn to the real effects. Switching from the event study approach to standard regressions, we show that the cash flow channel impinges on future capital investment, inventories and profitability. Here again, we demonstrate the empirical relevance of “exposure” over leverage in accounting for the real effects.
Our analysis of the cash flow channel of monetary policy in the second chapter provides a new context to the old and well-known relationship between asset prices and monetary policy, and offers a glimpse of what lies behind Barnanke
and Gertler’s (1995) “black box”.
The third chapter then extends the analysis in the second chapter and conduct additional robustness tests.
Small and medium sized firms are different from larger firms in many ways. Their phase in life cycle, investment and growth prospects, access to finance (debt and equity markets) are all significantly different. In the third chapter, I extend the sample to include medium sized firms as well. I show that the evidence for the floating rate channel is intact but weaker. In particular, the inclusion of small firms introduce a large noise, due to more volatile nature of their stock prices and the fact that their access to floating rate debt (e.g., long term bank debt) could be very limited.
The empirical finance literature does not combine financial firms with non-financial firms for empirical analysis because the former’s nature and balance sheets are completely different from latter’s. In the third chapter, I experiment with this type of idea by dropping utilities sector in addition to financial sectors. I show that the cash flow effect is even stronger for the sample which does not include these sectors.
The third chapter also discusses various ways to deal with extreme values in the data, time fixed effects, and control variables related to debt structure. It also presents additional evidence for the floating rate channel in the zero lower bound period.
monetary policy transmission. However, the current literature still lacks a proper framework to analyze the effect of corporate debt maturity choice on the cash flow channel. Because of the difficulty in modeling and investigating maturity choice in settings where different kinds of financial instruments with different maturities are available, the literature has been hampered to develop in this direction.
Nevertheless, one can investigate the role of debt maturity in response to aggre-gate shocks in a stylized model. This is how I approach the question in the fourth chapter. This chapter uses a short-cut for modeling a set of frictions that affect maturity choice. The firms which are able to reach long term debt finance are the firms which expect returns from their assets at a longer horizon. Servaes et al. (2009) also point out that, when choosing debt maturity, the main determinants are the firm’s expected cash flows and asset maturity.
With such motive, I build a two sector real business cycle model in which produc-tion sectors differ in the longevity of their capital that the financially constrained entrepreneurs possess. The model consists of entrepreneurs and households. Two types of entrepreneurs have technologies that produce two different types of con-sumption goods which households consume. To increase their capital stock, which is their sole production factor, they need to make investment. Endogenous bor-rowing constraints limit the amount of investment, and serve as an amplification mechanism. By assumption, the sector that has long-lived capital use long-term debt and the sector that has short-lived capital use short-term debt. The sim-ple model embeds macro prudential instruments such as borrowing limit ratios or average maturity of long term debt, and shows the sector-specific effects of
aggregate shocks and macro-prudential policies.
Then, I extend the analysis to New Keynesian (NK) models which features nom-inal rigidities. The extension helps identify the credit channel and the net worth channel. The second part of the fourth chapter is more interesting because it is more related to empirical findings. The model structure allows to study the distributional effects of policy shocks as well as effects of different repayment structures.
The results in this chapter has implications for macro-prudential and monetary policy. In a NK model with two sectors, a tightening of monetary policy causes inflation to fall as in standard models. However, the effect is more disruptive for the sector that relies on long-term debt finance. Since the cash outflow, regarding future obligations rise, the production and new investment in this sector fall. As a result, the ratio of short term debt to long term debt in the economy goes up.
Fourth chapter provides a theoretical analysis of floating rate debt as well. I show that floating rate debt exacerbates the adverse effects of monetary policy contraction relative to those for fixed rate debt. In the real model, extending the maturity of the long term debt benefits the sector, because it corresponds to a form of financial development. Remarkably, in the extended model, with NK features, increasing the maturity of floating rate debt amplifies the effects of adverse shocks. Increased maturity means being more exposed to future cash out flows. This rationalizes our empirical findings in Chapter 2 and 3.
This chapter also experiments with some macro-prudential policy shocks such as tightening financial conditions or extending the average maturity for long term
debt. It shows that these kind of shocks are not the main drivers of business or credit cycles because they generate opposing effects on borrowers and lenders. For example, a shock to borrowing limit, which tightens the financial conditions for entrepreneurs, leaves households (who also happen to be lenders) with more resources to consume for themselves. Moreover, the impulse response analyses show that the effect of a tightening financial shock is mitigated by a expansionary monetary policy shocks.
The model in the fourth chapter can be easily extended in many directions, for instance equity finance or a combined portfolio choice with micro-founded motives by the same firm. This will be investigated in the future research.
The fifth chapter constitutes the final chapter of the thesis and is included to fulfill the publication requirement. It tests the relevance of consumer confidence indices having information about future private consumption growth in Turkey. To this end, the estimation models for quarterly total, durable and nondurable consumption growth with and without sentiment indicators are built, and in-sample forecasts and one-step-ahead out-of-in-sample forecasts from recursive OLS estimates are compared. It is shown that when other macro economic variables like real labour income, real stock price, real interest rate and exchange rate are taken into account the estimation power of confidence indices decreases.
Overall contributions of this thesis can be summarized as follows: First, it pro-vides evidence for the floating rate channel of monetary policy by constructing a novel measure of cash flow exposure and highlights that the relevant monetary policy surprise is about the future path of interest rates rather than current
sur-prises. Second, it gives further evidence on the floating rate debt channel with real consequences for capital investment, inventory investment and profits in up-coming quarters. Third, it builds a simple theoretical framework to analyze the monetary transmission and the floating rate channel. Fourth, it discusses the policy implications of floating rate debts and their maturities.
CHAPTER 2
STOCK MARKET’S ASSESSMENT OF
MONETARY POLICY TRANMISSION: THE
CASH FLOW EFFECT
2.1
Introduction
In VAR studies, monetary policy appears to have large and long-lasting effects on real activity. In standard macroeconomic models, it is very hard to generate monetary policy effects that are nearly as pronounced or persistent. An influential branch of the literature has focused on financial conditions to amend the standard models to better fit the data, which also helps explain why financial markets are so important and financial crises so destructive. These models, in which the Modigliani-Miller theorem fails, collectively require cash in the firm (or other decision-making unit) to have a lower opportunity cost than cash outside the firm. These financial accelerator models tell a compelling story, but the literature remains thin on empirical evidence for many of these financial conditions-based
channels.
Similarly, our understanding of the effects of monetary policy on stock prices remains much weaker than that of monetary policy effects on bond prices. This is at least in part because individual stocks, unlike Treasury bonds which differ in coupon rates, maturity, and inflation protection but not much else, are het-erogeneous in many dimensions and the interaction of monetary policy with firm heterogeneity and how these are reflected in stock pricing is only a nascent liter-ature. Monetary policy effects on stock prices are more often studied in terms of aggregate or industry-level stock responses, as in the influential work of Bernanke and Kuttner (2005).
In this paper, we study stock market reaction to monetary policy at the level of individual firms’ equity prices, which reflects the stock market participants’ be-liefs about monetary policy’s effects on the performances of different firms. Our object of interest is the difference caused by fixed versus floating rate obligations of otherwise similar firms. Fixed rate liabilities are, in a net present value sense, lowered by higher interest rates, and their future cash flows are unchanged by these. However, for floating rate liabilities, their net present values are either un-changed or mildly lowered, but future cash flow obligations increase, with higher interest rates. This creates two effects. The first one is mechanical: higher inter-est rates cause a transfer from equity holders to bond (or loan) holders if debt is a floating rate one, which should lower firm value. It is an interesting question whether this effect is priced in at high frequency, in response to monetary policy surprises.
The second effect arises due to firms’ future cash flow exposures. Expected future cash flows change in response to monetary policy surprises based on the amount and maturity of floating rate liabilities on their balance sheets (and whether these liabilities are hedged). Financial accelerator channels require cash in the firm to be more valuable than cash outside it. As higher interest rates increase cash outflows, firms with more floating rate cash flow exposure should be more adversely affected by higher interest rates. This again should lower firm values for firms with high cash flow exposures, but also leads to changes in real outcomes for these firms.
The first effect is a financial effect that leads to a redistribution. But, if the Modigliani-Miller theorem holds, it will not have direct effects on firm behavioral reshuffling of liabilities between loan and bond holders and residual claimants, stock holders, have no real effects. To the extent that changes in stock prices lead to wealth effects and there is heterogeneity between stock and bond holders’ wealth effects, this may lead to changes in consumption at aggregate level and be a channel of monetary policy effectiveness in itself. But, we do not test this in this paper. However, the second possible effect of monetary policy surprises on stock prices of floating rate debt issuing firms, which leads to changes in real outcomes at the firm level due to cash flow exposure, is a direct channel of monetary policy transmission and also a test of the Modigliani-Miller theorem, which we study in this paper.
We proceed in two steps. Our first test is whether firms that have more cash flow exposure due to having issued more floating rate debts see their stock prices
respond more to monetary policy surprises in high frequency. This is a joint test of monetary policy having an impact on profitability and market participants correctly pricing this at high frequency. This is indeed the case. We further show that the relevant measure of monetary policy is not the surprise in the current setting of interest rates but surprises about future path of rates, and that it is the interaction of this surprise with floating rate exposure, which depends not only on the amount but also on the maturity of floating rate debts. When measured this way, stock market reactions to monetary policy surprises as a function of floating rate exposure of firms have not changed during the Zero Lower Bound (ZLB) period: forward guidance has been as effective during the ZLB as monetary policy has been before it.
Before proceeding to real effects, we take a detour and ask what we find to be an interesting question: is it the case that the marginal stock market investor actually knows the balance sheet of the relevant firm, how much floating rate exposure it has, and correctly prices in the interaction of floating rate exposure and monetary policy at high frequency, or is it that because floating rate exposure is quite persistent for most firms, stock market participants learn rules of thumb where certain firms fare worse in, say, tightening cycles? In other words, is the marginal stock market investor sophisticated enough to know firm balance sheets and understand the present value effects of their interactions with monetary policy? We devise simple tests to answer this question and find that what drives these stock price effects in high frequency is knowledge of balance sheets and understanding of their interactions with monetary policy rather than rules of thumb. The marginal stock market investor is quite sophisticated.
Lastly, we show that firms that have issued more floating rate debts fare worse in real outcomes in the quarters following monetary policy changes. In particu-lar, we show that the profits after interest payments are lower and their capital investments are correspondingly lower, verifying the repricing of their stocks at the time of monetary policy surprises and providing evidence for a floating rate channel of monetary policy transmission.
The paper is structured as follows: Section 2.2 describes the literature we build on and highlight our contributions. Section 2.3 describes our data set and provides relevant summary statistics; Section 2.4 presents the main results of our paper concerning the cash flow effect of monetary policy; Section 2.5 asks whether stock market participants understand the cash flow channel or use rules of thumb when differentially repricing firms’ stocks in response to monetary policy surprises. Section 2.6 carries out various robustness checks; Section 2.7 extends the analysis in Section 2.4 to real effects on investments and profits; Section 2.8 concludes.
2.2
Related Literature
Our work, which is at the intersection of several strands of the literature, brings together methods and ideas from the monetary policy event study literature, the firm valuation and stock pricing sub-strands of corporate finance and asset pricing literatures, and the literature on the role of financial frictions in monetary policy transmission.
more sensitive to monetary policy is subtly but importantly different from the findings of Ippolito et al. (2017) who study a similar question, but is nonetheless consistent with their conclusions. We differ in our focus, and our preferred mea-sures of monetary policy surprises and cash flow expomea-sures. In particular, we show that cash flow exposure should be measured taking into account the maturity of liabilities, not only leverage; that the relevant measure of monetary policy is the guidance about future interest rates, which drive future floating rate payments; and that when exposure and policy surprises are measured as described, one sees that the differential effect of monetary policy surprises on stock prices of firms with different cash flow exposures have not changed during the zero lower bound period. What mattered has always been forward guidance, and forward guidance worked the same way when the policy rate was stuck at zero. We further differ in the real effects we are interested in, and also our study of sophistication of stock market participants.
Looking at the broader body of work that we build on, we recognize that the theoretical literature on financial accelerator models is rich, and there is an in-creasing literature on the empirics of many specific channels. In their influential paper, Bernanke and Gertler (1995), referring to the transmission mechanism of monetary policy as a “black box”, urged macroeconomists to uncover what lies behind empirical regularities concerning monetary policy actions and the real economy. The profession responded to the plea emphatically and produced many important contributions to enhance our understanding of monetary policy trans-missions, especially in connection with the credit channel of monetary policy. (Gertler and Gilchrist, 1994; Kiyotaki and Moore, 1997; Bernanke et al. 1999).
The interest in this quest was rekindled by the economic crisis of 2008 as the world witnessed the ineffectiveness of conventional monetary policy at stabilizing macroeconomic fluctuations. Some examples of this work include Gertler and Kiyotaki (2010), Adrian et al. (2013), Ciccarelli et al. (2013), and Gertler and Karadi (2015). However, as Boivin et al. (2010) argue, the literature on less conventional or non-neoclassical transmission mechanisms is still thin, and this is mainly due to the lack of the supporting empirical evidence. We help fill that gap and add to the contributions of Ippolito et al. (2017), Hughson et al. (2016), Vestman et al. (2016) that are examples that explore similar or related questions.
There is also an extensive literature investigating the relationship between as-set prices and monetary policy. Some examples are Thorbecke (1997), Kuttner (2001), Ehrmann and Fratzscher (2004), Gürkaynak et al. (2005), D’amico and Farka (2011), Campbell et al. (2017), Gorodnichenko and Weber (2016), Eijffin-ger et al. (2017), and Swanson (2017). Our analysis of the cash flow channel of monetary policy provides a new context to this old and well-known relationship, and in the process of doing so offers a glimpse of what lies behind Barnanke and Gertler’s (1995) “black box”.
Lastly and obviously, we contribute to the literature of stock price determination. This is a very large literature with important contributions in different dimensions including Capital Asset Pricing Model of Sharpe (1964) and Lintner (1965), de-terminants of firm performance and stock prices such as Fama and French (1992) and Fama and French (1995), and responses of stock prices to monetary policy such as Bernanke and Kuttner (2005). Another strand of the literature is on
stock prices that are driven by non-fundamental effects such as momentum trad-ing (Hong and Stein, 1999), rational bubbles (Diba and Grossman, 1988; D’amico and Farka, 2011), and the like. Our work is related to Bernanke and Kuttner (2005) in that we study stock price changes at high frequency conditional on mon-etary policy surprises and find evidence of pricing based on fundamentals, as firm balance sheet is part of the fundamentals. This does not rule out non-fundamental influences, but provides evidence for the presence of market participants who are sizable enough to have pricing effects and trade on the fundamentals even when those are buried in the firms balance sheets, such as liability structure and hedging behavior.
The relationship between monetary policy and stock prices is interesting for a variety of reasons, including for portfolio investment purposes, financial stability considerations, and so on. Here, our interest is on the stock market participants’ perceptions of monetary policy effects on different firms, based on the changes in their future cash flow obligations due to the changes in the expected path of interest rates. A related study is the wonderful recent work of Ippolito et al. (2017) who show that firms that have issued more floating rate debts, as proxied by bank loans (which are mostly floating rate obligations), see more reaction of their stock prices to Kuttner surprises (Kuttner, 2005). They refer to this as the floating rate channel of monetary policy. We will use their covariates, in particular their bank debt leverage measure, in our work to make sure that our cash flow exposure measure is not proxying for their bank debt leverage measure.
2.3
Data and Summary Statistics
This section describes our data and provides summary statistics relevant for our analysis. The baseline sample period, which ranges from 2004 to 2008, is identical to that of Ippolito et al. (2017) whose analysis of the floating rate channel of monetary policy is intimately related to our analysis of the cash flow effect of monetary policy. This choice and other decisions related to empirical design make our results consistently comparable to theirs initially. We then turn to a longer sample, between 2004 to 2014, when our data set ends. There were 93 FOMC announcements between January 2004 and September 2014. We employ our preferred measures of cash flow exposure in addition to bank debt leverage, and also use Ippolito et al.’s (2017) conditioning variables in our regression models to make sure that our results are not driven by their bank debt leverage measure.
Whereas individual firms differ in many dimensions, our interest will be on their cash flows. In particular, we will be looking at changes in expected cash out-lays of firms on days of monetary policy surprises due to unhedged floating rate obligations on their balance sheets. To do so, we first look at the construction of monetary policy surprise measures and firm balance sheet information, before proceeding to the event study based on these variables.
2.3.1
Monetary Policy Data
Monetary policy effects on stock prices have been of long-standing interest. How-ever, these effects are hard to interpret with aggregate data due to opposing
information and discount rate effects on stock prices. Figure 2.1 shows daily ag-gregate stock price changes (S&P500 returns) in response to intraday monetary policy surprises (Kuttner surprises) between 2004 and 2008. These surprises are market-based monetary policy innovations, using short-dated federal funds fu-tures contracts, that capture the change in market participants’ beliefs about the effective federal funds rate in the remainder of the calendar month at the time of a monetary policy announcement (see Kuttner, 2005). If there is no surprise at the time of the announcement, spot-month federal funds futures quotes will be unchanged. Otherwise, the exact magnitude of the surprise can be read off from the change in these contract prices with appropriate scaling.
Figure 2.1: Daily Aggregate Stock Price Changes in Response to Kuttner Shocks
First, looking at monetary policy surprise measures, it is rather clear that there had been very few policy surprises in the Kuttner surprise sense between 2004, when the data set on firm balance sheets became available, and 2008, when the Global Financial Crisis hit and monetary policy in the US reached the ZLB, with no surprises in the policy setting for several years afterwards. This is not because
monetary policy had no surprises in this period, but because policy surprises came from the statement, changing expectations about the future course of policy rates, rather than the surprises in the immediate policy setting. In fact, this had been the case before the ZLB as well: the FOMC signaled its policy decision fairly transparently before the meetings took place, hence the surprise in the 21st century always came mainly from what is now called forward guidance.
We use Gürkaynak et al.’s (2005) measures of monetary policy shocks (GSS sur-prises henceforth) in our analysis. The GSS shocks are constructed under the identifying assumption that no economic news other than an FOMC announce-ment drives changes in asset prices in a thirty-minute window bracketing the announcement. Therefore, the asset price changes during this window of time can be attributed to a genuine monetary policy surprise which could not have been anticipated on the basis of what is known up until the announcement is made. The use of the narrow window makes this identifying assumption credible, which is also the identifying assumption underlying the Kuttner surprises.
The GSS surprises, unlike Kuttner’s measure of monetary policy surprises (Kut-tner, 2005) employed by Ippolito et al. (2017), are two-dimensional with the first dimension being exclusively related to the change in the current policy target and the second dimension to the change in the market perceptions of future policy rates (e.g., forward guidance). Following Gürkaynak et al. (2005), we refer to them as “target factor” and “path factor” respectively. These are the first two principal components of the yield curve up to one year maturity in a narrow (thirty-minute) window bracketing an FOMC announcement, rotated such that
one factor (path) is orthogonal to the Kuttner surprise. Hence, one factor (path) captures only the revisions to interest rates up to a year ahead that are not driven by the surprise in the current policy action (target), and the two rotated factors remain orthogonal to each other by construction. Campbell et al. (2017) and Swanson (2017) both discuss the mechanics of the GSS surprises and bring in other asset prices to help interpret monetary policy actions. The temporal sepa-ration afforded by the GSS shocks is particularly useful in light of the fact that floating rate debt maturity, which is mainly concerned with the future monetary policy actions, plays an important role in our analysis.
Figure 2.2 shows the S&P500 response to monetary policy, this time separately to the target and path surprises. The top panel of the figure resembles Figure 2.1, but the bottom panel is different and shows the aggregate stock price response to the path surprises. It is clear that the path surprises function differently from the target surprises, and indeed stock prices have been more responsive to the path surprises, than to the target surprises.
While introducing the path surprises allows capturing much more of the monetary policy surprise variance and the resulting changes in aggregate stock returns, one can make little inference from these aggregate stock price responses that is useful in understanding the transmission of monetary policy. We therefore turn to individual stock prices, where we can use cross-sectional variations in firms’ cash flow exposure to study a particular type of financial accelerator.
(a) Target Shocks
(b) Path Shocks
Figure 2.2: Daily Aggregate Stock Price Changes in Response to GSS Shocks
The panel above plots daily changes in S&P500 Index against the target shocks on the FOMC announcement dates between January 2004 and September 2014, and the panel below the same time series against the path shocks. The lines give the OLS fitted values.
2.3.2
Firm-level Data
To analyze how the FOMC announcements affect the financial market’s assess-ments of individual firms’ exposures to floating rate debts and stock prices in
turn, we construct a panel data whose cross-sectional dimension corresponds to US firms and event dimension to the FOMC announcement dates (refer to Sec-tion 2.3.1). Our firm selecSec-tion is based on a firm’s macroeconomic importance and financial data availability. For this reason, we choose firms which were part of S&P500 between 1957 and 2014 whose balance sheet data are also available in Capital IQ (CIQ) database. This gives us 728 firms in total. Ehrmann and Fratzscher (2004), Gorodnichenko and Weber (2016), and Eijffinger et al. (2017) are some examples which study relationships between monetary policy and stock returns using S&P500 firms.
The stock return, which is the main dependent variable in our paper, is computed using the log-difference of a stock price the day before and the day after an FOMC annoucement (closing quotes). This makes sure that our analysis is comparable to Ippolito et al.’s (2017) which is based on the same two-day window. We obtain similar results when we consider one-day window covering the stock return only on the day of an FOMC announcement instead (not shown here for brevity), even though they are less accurate than those based on the two-day window. The stock price is obtained from the Center for Research in Security Prices (CRSP) database.
The main regressor in our analysis is a measure of a firm’s exposure to floating rate debts which are financial obligations whose interest rates vary with bench-mark rates such as the federal funds rate or the London Interbank Offered Rate (LIBOR) over the course of their contract periods. To calculate floating rate ex-posure, we require detailed information about the firm’s debt structures beyond
face values such as debt categories (e.g., bank loans, bonds, notes, etc.), interest rate types (i.e., fixed vs. floating rate), and maturity per category/type. They are available at annual frequency in 10-K forms of CIQ database1 which are filed
at the end of each firm’s fiscal year. Tables 1 and 2 in Appendix A provide break-downs of total debts and total floating rate debts issued by firms in our data set respectively, and Table 3 gives descriptive statistics for floating rate debt items. Table 4 in the same appendix presents breakdowns of debts according to debt maturity and interest rate types, and Table 5 provides descriptive statistics for debts at different maturities. Floating rate exposure of each firm in our sample is constructed as follows. First, floating rate debt items which are convertible, issued in currencies other than US Dollars, or non-recourse are dropped from the list because they are not directly related to the cash flow channel of monetary policy we study in this paper. Debt items which have already defaulted are also removed. Second, for each remaining item, its maturity is set to either the final payment date stipulated on the contract or the simple average of the lower and upper bound of the designated payment interval depending on which case is ap-plicable. The maturity of a perpetuity is set to 100 years. Finally, the maturity of each debt item from the previous step is multiplied by the corresponding lever-age ratio (i.e., outstanding value of the debt item over total assets of the firm) and summed across the items to give the firm’s exposure to floating rate debts. By construction, it captures both maturity and leverage of a firm’s floating rate obligations, thus intimately related to its future cash flow exposure. For this reason, we use the expressions “floating rate exposure” and “cash flow exposure” interchangeably to refer to this measure.
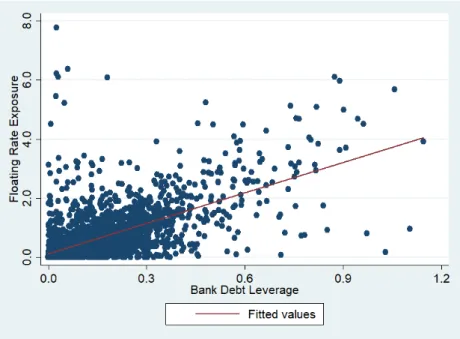
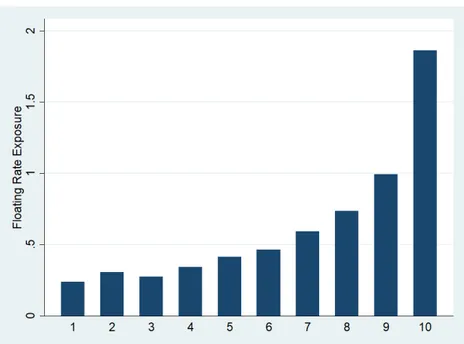
The standard balance sheet items are obtained from Compustat database. Based on these, we compute size, profitability, book leverage, and market-to-book ratio which are used as control variables in our analysis. They are available at quarterly frequency. Bank debt leverage (i.e., bank debts over total assets, where bank debts are the sum of term loans and credit lines), which is the main regressor of Ippolito et al. (2017) and also a measure of floating rate leverage in our model, is calculated using both CIQ and Compustat. We also consider floating rate debt leverage (i.e., total floating rate debts over total assets, where total floating rate debts are all obligations whose interest rates are variable) as an alternative measure of floating rate leverage as Ippolito et al. (2017) do in their paper. Figure 2.3, which plots floating rate debt leverage against bank debt leverage, shows that the two measures are closely related, with bank debts being mostly floating rate obligations. Figure 2.4, however, reveals that our preferred measure of cash flow exposure contains variations that are differentially informative over and above those contained in the leverage measures. Finally, Figure 2.5 provides the simple average of the exposure measure in each decile of bank debt leverage. It confirms the positive relationship between the two as shown in Figure 2.4, but also indicates that the relationship is quantitatively stronger at the right tail. Other variables that are included in our regression models are deflated by CPI and recast in real terms, wherever applicable.
As in Ippolito et al. (2017), we compare the stock returns of the firms which hedge against interest rate risks of floating rate debts to those which do not in the two-day window explained above. To this end, we construct a dummy variable for hedging by following the text search method of Ippolito et al. (2017). It uses
Figure 2.3: Floating Rate Debt Leverage and Bank Debt Leverage
Floating rate debt is all obligations whose interest rates are variable. Bank debt is the sum of term loans and credit lines. They are expressed as fractions of total assets to give “Floating Rate Debt Leverage” and “Bank Debt Leverage” respectively. The line plots OLS fitted values.
Figure 2.4: Floating Rate Exposure and Bank Debt Leverage
“Bank Debt Leverage” is the ratio of bank debts (term loans + credit lines) to total assets. “Floating rate exposure” is constructed by multiplying each floating rate debt item by its maturity and expressing the resulting sum as a fraction of total assets. The line plots the OLS fitted values.
as inputs 10-K reports from the Securities and Exchange Commission (SEC) database (which are the original source of 10-K forms in CIQ). The reports,
Figure 2.5: Floating Rate Exposure over Deciles of Bank Debt Leverage
The figure provides the simple average of the floating rate exposure in each decile of the bank debt leverage. “1” along the horizontal axis means between the bottom and the 1st decile, “2” means between the 1st and the 2nd decile, and so on.
which every firm regulated by the SEC is required to file at the end of its fiscal year (annual in frequency), provide textual information about the firm’s hedging decisions related to interest rate risks. We set the dummy variable for hedging to one if the following phrases are found on the report: “hedge interest rate,” “hedge against interest rate,” “interest rate swap,” or their variants.2As shall be
seen later, the positive interaction effect among the path shock, the floating rate exposure, and the hedging dummy provides key evidence for the cash flow effect of monetary policy.
We merge the two-day window stock returns and the GSS factors with the firm-level variables above, taking into account the fact that the end of fiscal year differs across firms. This allows us to match the latest available balance sheet
2We also check for false positives using the following phrases: “not hedge interest rate,”
“not use interest rate swap,” “not use any interest rate swap,” “not currently use interest rate swap,” “not currently use any interest rate swap,” “not use fixed to floating interest rate swap,” “termination of interest rate swap,” “not use derivative financial instruments as a hedge against interest rate,” or their variants.
information in CIQ (available at annual frequency) to the FOMC announcements rather than crudely using calendar year. Because the SEC requires 10-K forms to be released to public within 90 days following the end of a firm’s fiscal year, we assume that both Compustat and CIQ variables are observed with one quarter delay. In this regard, we differ from Ippolito et al. (2017) who assume that the balance sheet variables are observed with one year lag. Table 2.1 provides the summary statistics for the firm-level variables used in our regression analysis. It shows that on average the firms which hedge against interest rate risks of their floating rate debts are not so different from those which do not, especially in terms of their floating rate leverage (in terms of bank debts as well as all floating rate debts) and exposure: our sample is well-balanced.
Table 2.1: Summary Statistics for Balance Sheet Variables
Hedge=0 Hedge=1 Entire Sample
Mean SD Mean SD Mean SD
Exposure 0.56 0.77 0.58 1.03 0.58 0.95
Bank Debt Leverage 0.12 0.13 0.13 0.14 0.13 0.14 Floating Rate Debt Leverage 0.12 0.13 0.12 0.15 0.12 0.14
Size 4.24 1.34 5.05 1.47 4.74 1.48
Book Leverage 0.34 1.60 0.53 10.65 0.46 8.42 Market-to-book Ratio 1.70 1.35 1.28 0.84 1.44 1.09 Profitability 0.04 0.03 0.03 0.02 0.03 0.03 No. Of Observations 22924
Notes:The dummy variable Hedge = 1 for firms which engage in hedging activities against interest rate risks of their floating rate obligations. Exposure is the sum of maturity weighted floating rate debts as a fraction of total assets. Bank Debt Leverage is the ratio of total bank debts to total assets. Floating Rate Debt Leverage is the ratio of total floating rate debts to total assets. Size is the logarithm of the book value of total assets, Book Leverage is the ratio of total debts to the sum of total debts and the book value of equity, Market-to-book Ratio is the ratio of the sum of the market value of equity and total debts to total assets, and Profitability is the ratio of operating income before depreciation to total assets.
Finally, we employ the log-difference of capital and inventory investment respec-tively and profit over total assets as the dependent variables to analyze real effects of monetary policy in connection to floating rate exposure. They are computed
using Compustat database and available at quarterly frequency.
The summary of data construction and additional information are provided in Appendix B.
2.4
Cash Flow Effect of Monetary Policy
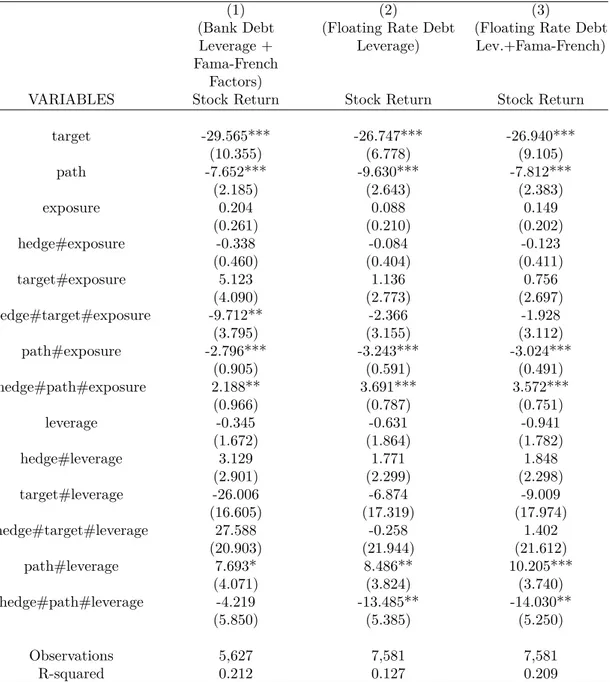
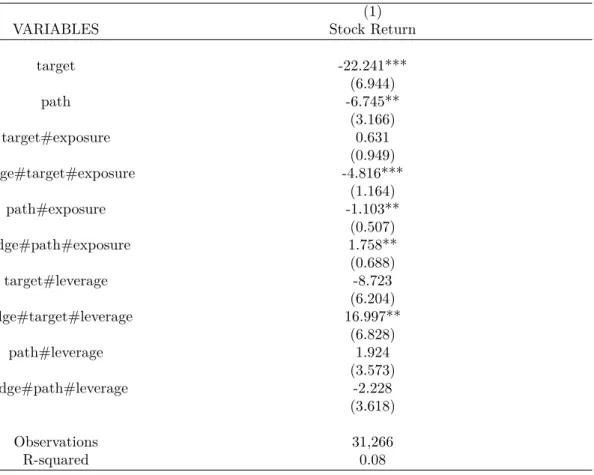
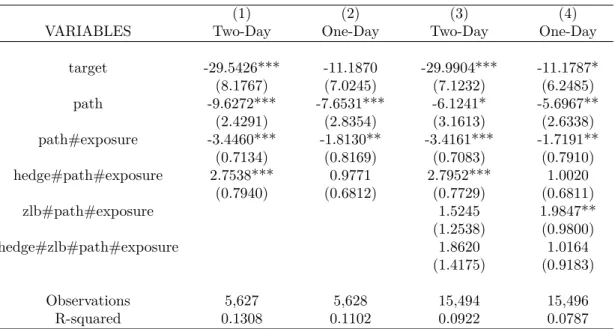
This section is concerned with demonstrating the cash flow effect of monetary policy. Based on our event study of the FOMC announcements, we find that (in order of increasing importance) (i) the floating rate channel of monetary policy operates through the path factor of monetary policy, not the target factor, (ii) floating rate exposure, not floating rate leverage, is an important determinant of stock market reactions to monetary policy shocks, and (iii) the negative interac-tion effect between the path factor and the floating rate exposure measure and the positive interaction effect among the path factor, the exposure measure, and the interest rate risk hedging dummy provide key evidence regarding the floating rate channel of monetary policy, whose essence we interpret to be the cash flow effect. We also find that the monetary policy channel documented above was not changed at the ZLB, which confirms the view that forward guidance was a dominant source of monetary policy surprises, in and out of the ZLB.
2.4.1
Empirical Design
As discussed by Gürkaynak et al. (2005), the event study methodology based on high-frequency data allows researchers to circumvent endogeneity issues related to
omitted variable bias and reverse causality. This is especially useful in the current context because there is evidence that the FOMC announcements are influenced by stock market movements (see D’Amico and Farka, 2011). To avoid this pitfall in a systematic and credible manner, we follow Gürkaynak et al. (2005) and design an event study to understand how monetary policy affects stock returns.
We build our event study of the effects of the FOMC announcements on Ip-polito et al. (2017). However, our empirical design differs from theirs in two meaningful ways. First, unlike Ippolito et al. (2017) who use Kuttner’s (2001) one-dimensional measure of monetary policy shocks, we employ Gürkaynak et al. (2005) two-dimensional measures of monetary policy surprises. As explained in Section 2.3.1, this enables us to investigate not only shocks to the current mone-tary policy target (target factor)3, but also shocks to the future monetary policy
actions (path factor). Second, whereas Ippolito et al. (2017) focus on the interac-tion among the target factor, the floating rate leverage, and the interest rate risk hedging dummy and find evidence in favor of their floating rate channel of mon-etary policy, we also consider the interaction among the path factor, the floating rate exposure, and the interest rate risk hedging dummy and obtain evidence in favor of the floating rate channel involving only these latter variables. We in-terpret this as capturing the cash flow effect of monetary policy. Even though our findings are different from those of Ippolito et al. (2017), our conclusions are nonetheless consistent with theirs: the floating rate channel of monetary policy exists and matters.
3As Gürkaynak et al. (2005) show, the target factor is highly correlated with the Kuttner
shocks by construction (their correlation is above 95 percent). Therefore, they can be used interchangeably.