Dergi web sayfası:
www.agri.ankara.edu.tr/dergi
www.agri.ankara.edu.tr/journal
Journal homepage:
TARIM BİLİMLERİ DERGİSİ
—
JOURNAL OF AGRICUL
TURAL SCIENCES
19 (2013) 71-78
The Determination of Growth Curve Models in Malya Sheep from
Weaning to Two Years of Age
Rabia Gökçe AYTEKİNa, Uğur ZÜLKADİRb
a Selcuklu District Directorate of Food, Agriculture and Livestock, Konya, TURKEY
bSelcuk University, Faculty of Agriculture, Department of Animal Science,42075, Konya, TURKEY
ARTICLE INFO
Research Article − Animal Production
Corresponding Author: Uğur ZÜLKADİR,E-mail: [email protected], Tel: +90(332) 223 28 19 Received: 27 December 2011, Received in Revised Form: 14 January 2013, Accepted: 17 March 2013
ABSTRACT
This research was carried out to determine the growth curve models for Malya ewes. Twenty sheep were fed
ad-libitum with roughages from weaning to approximately 48 month of age. Each sheep was provided with 200
g concentrate feed (16% CP; 2500 kcal kg-1 metabolic energy) until the end of mating period and then 250 g
from the end of mating period to the middle of gestation period. Towards the last month of pregnancy, the daily amount of concentrate feed was gradually increased to 500 g. Twenty sheep were weighed at 28 days intervals in 45 different control periods between weaning age through 2 years of age. The growth curve parameters, coefficients of determination (R2), mean square predicted errors (MSPE) and correlations between live weights
and residuals (RESC) were determined for Linear, Quadratic, Cubic, Gompertz and Logistic models by using live weight data of Malya sheep. The highest R2 values, the lowest MSPE and RESC values, similarity between
actual and estimated live weight values were used to evaluate the fitness of the growth curve models. R2 values
of Linear, Quadratic, Cubic, Gompertz and Logistic model were determined as 83.13%, 91.04%, 92.04%, 91.55% and 91.22%, respectively, while MSPE values were 65.900, 34.657, 30.894, 32.956 and 34.101, respectively. Also, RESC values were found as 0.469, 0.287, 0.279, 0.299 and 0.333, respectively. These findings revealed that the best fit to the growth curves of Malya ewes was acquired with Cubic Model. However, all models can be accepted satisfactory to determine the growth in this period except for linear model. These results can be useful for farmers in defining proper breeding and feeding strategies.
Keywords: Malya sheep; Body weight; Growth curve; Linear model; Non-linear model
Malya Koyunlarında Sütten Kesim ile Ergin Yaş Arası Dönemde
Büyüme Eğrisi Modellerinin Belirlenmesi
ESER BİLGİSİ
Araştırma Makalesi − Hayvansal Üretim
Sorumlu Yazar: Uğur ZÜLKADİR, E-posta: [email protected], Tel: +90(332) 223 28 19 Geliş tarihi: 27 Aralık 2011, Düzeltmelerin gelişi: 14 Ocak 2013, Kabul: 17 Mart 2013
Ta r ı m B i l i m l e r i D e r g i s i – J o u r n a l o f A g r i c u l t u r a l S c i e n c e s 19 (2013) 71-78
72
1. Introduction
There have been various sheep breeds and types
adapted to the different geographical and climatic
conditions in Turkey. Most of them are fat-tailed
sheep breeds. Malya sheep is one of the
semi-fat tailed crossbred (5/8 Akkaraman sheep + 3/8
German wool-meat merino sheep).
The growth characteristics are the result of
interactions between environmental conditions
and the genetic structure of individuals (Kor et al
2006). Although, each subspecies and sheep breeds
have their own unique growth curve, there are
also important differences between the individuals
within the same breed (Özen 1997).
The development and growth of an animal
can be measured by weighing both whole body
and certain parts of the body (Efe 1990). Since
the growth of farm animals is fundamental of
all aspects of production, many studies were
conducted to determine the growth curves of farm
animals by several authors. These studies focused
especially on sheep and goat (Kocabaş et al 1997;
Akbaş et al 1999; Esenbuga et al 2000; Topal
et al 2004; Kor et al 2006; Keskin & Dağ 2006;
Karakuş et al 2008; Aytekin et al 2009; Keskin
et al 2009; Özdemir & Dellal 2009; Aytekin et al
2010; Daskiran et al 2010), on poultry (Soysal et
al 1999; Yakupoglu & Atil 2001; Çamdeviren &
Taşdelen 2002; Şengül & Kiraz 2005; Çetin et al
2007; Norris et al 2007; Koncagül & Cadirci 2009,
2010; Narinç et al 2010) and on cattle (Brown et
al 1976; Lopez de Torre et al 1992; Bayram et al
2004; Colak et al 2006).
The growth curve is the curvilinear manifestation
of the visible changes occurring in body weight and
body measurements from the birth to maturation.
The changes in body weight and size occurring
in a particular period were usually explained with
growth curve models (Yıldız et al 2009).
Linear and non-linear growth models are widely
used to determine the growth curves of farm animals.
The models used to determine the relationship
between growth and age in farm animals were
categorized in two main groups as monomolecular
and asymptotic functions. Asymptotic functions
include non-linear models, which explain the
relationship between age and growth throughout the
life of an organism. Monomolecular functions are
models representing S-shaped growth curve in the
relationship between age and growth curves (Efe
1990). As growth in farm animals is not linear, the
ÖZETBu araştırma, Malya koyunlarının büyüme eğrilerini belirlemek amacıyla yapılmıştır. Yirmi baş Malya koyununa sütten kesimden yaklaşık 48 aylık yaşa kadar kaba yem serbest olarak verilmiştir. Koyunlara aşım sezonunun sonuna kadar 200 g gün-1, aşım sezonu bitiminden gebeliğin ortalarına kadar 250 g gün-1 konsantre yem (%16 HP ve 2500 kcal kg-1
metabolik enerji) verilmiştir. Gebelik döneminin ortasından sonuna doğru ise yem kademeli artırılarak 500 g gün-1’e
çıkarılmıştır. Bu büyüme periyodu içerisinde sütten kesimden 2 yaşına kadar koyunlar 28 gün ara ile 45 kez tartılarak canlı ağırlıkları belirlenmiştir. Bu canlı ağırlık verileri kullanılarak Doğrusal, Kuadratik, Kübik, Gompertz ve Logistik modellerin büyüme eğrisi parametreleri, belirleme katsayıları (R2), hata kareler ortalamaları (HKO), artık değerler ile
gerçek veriler arasındaki korelasyonlar (AGAK) ve gerçekleşen ve tahmin edilen canlı ağırlıklar arasındaki benzerlikler saptanmıştır. Doğrusal, Kuadratik, Kübik, Gompertz ve Logistik modellerde belirleme katsayısı (R2) sırasıyla %83.13,
%91.04, %92.04, %91.55 ve %91.22, HKO ise sırasıyla 65.900, 34.657, 30.894, 32.956 ve 34.101 olarak saptanmıştır. AGAK değerleri ise 0.469, 0.287, 0.279, 0.299 ve 0.333 olarak bulunmuştur. Bu değerler dikkate alındığında en iyi uyumun Kübik modelden elde edildiği ortaya çıkmıştır. Bununla beraber doğrusal model dışındaki diğer tüm modellerin bu periyottaki büyümeyi yeterince tanımlayabildikleri kabul edilebilir. Bu sonuçlar yetiştiricilere uygun yetiştirme ve beslenme stratejilerini tanımlamak için önem arz etmektedir.
Anahtar Kelimeler: Malya koyunu; Vücut ağırlığı; Büyüme eğrisi; Doğrusal model; Doğrusal olmayan model © Ankara Üniversitesi Ziraat Fakültesi
Ta r ı m B i l i m l e r i D e r g i s i – J o u r n a l o f A g r i c u l t u r a l S c i e n c e s 19 (2013) 71-78
73
non-linear models would be more appropriate than
linear models for the estimation of growth curves.
However, due to the small number of data, the use
of linear models to estimate the growth curve is also
becoming mandatory.
The aim of the present study was to compare
commonly used growth curve models and to
determine the best model describing the growth
curve of Malya sheep.
2. Material and Methods
The experiment was conducted at Selcuk
University, Agricultural Faculty Farm (Konya,
Turkey) located at 37
o17¢ N latitude and 32
o31¢
E longitude and 1016 m above sea level. Winters
are cold and snowy, and summers are hot and arid
in Konya. Twenty female Malya lambs born in
Agricultural Faculty Farm were used. The lambs
were penned in well-ventilated enclosures and fed
as a group throughout 1260 days.
The lambs were
weaned at 2.5 months of age. At weaning, the lambs
were individually weighed with 0.1 kg accuracy
and then their live weights were recorded at 28
days intervals in 45 different control periods. The
feed contained 2500 kcal kg
-1metabolic energy and
crude protein content of feed ranged between 12%
and 16% at different growth periods. The roughage
was given ad-libitum to the all animals throughout
the whole periods. Each sheep was provided with
200 g day
-1concentrate feed containing 16% CP
and 2500 kcal kg
-1metabolic energy until the end
of mating period and then the daily amount of
concentrate feed was increased to 250 g until the
middle of gestation period. Towards the last month
of pregnancy, the amount of concentrate feed was
gradually increased to 500 g. In addition, ewes
consumed dry alfalfa hay and beet pulp ad-libitum.
Free access to water was available throughout the
day.
The following equations of Linear, second and
third degree models (Quadratic and Cubic) and
non-linear models (Gompertz and Logistic) were used to
estimate the growth curves in Malya sheep by using
Statistica (1995) package program.
Linear model :
3
Linear model : (1) Quadratic model: +c× (2) Cubic model : +(c× (3) Gompertz model: (4) Logistic model : (5)Where Y is the live weight at control time t; a is the initial live weight for Linear; Quadratic and Cubic models and asymptotic live weight for Gompertz and Logistic models; b, c and d are the model parameters which characterize the shape of the curve. The growth curve parameters of models (a, b, c, and d), coefficients of determination (R2), Mean Square Predicted Errors (MSPE) and correlations between observed live weights and residuals (RESC) were determined. The models representing higher R2, lower MSPE and RESC values were selected as the best fitting models.
3. Results and Discussion
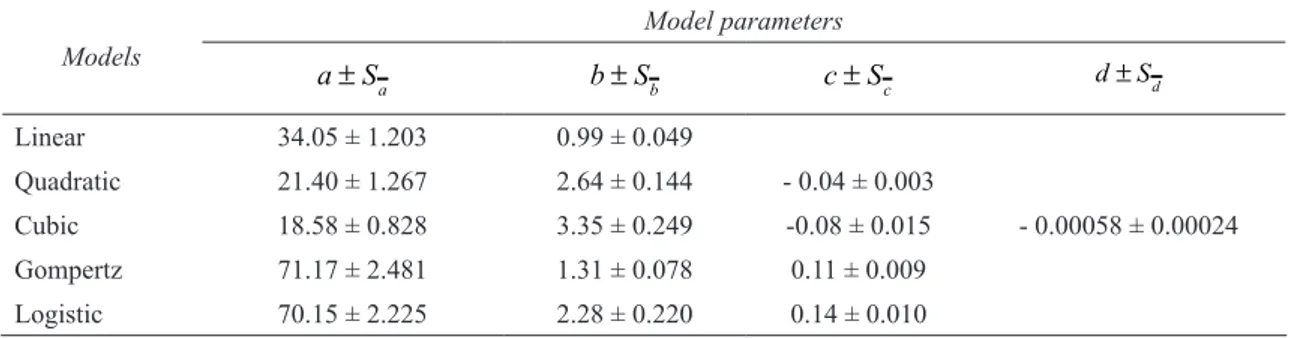
Growth curve parameters and standard errors estimated by the models for live weight of Malya sheep were presented in Table 1. The highest value for parameter “a was obtained from the simple linear model (34.05) in respect of initial body weight. The highest value for the parameter a was obtained from the Gompertz model (71.17), which is one of the non-linear models based on adult live weight. The highest parameter b, which is responsible for the rising phase of the curve, was obtained from the Cubic model (3.35). It was followed by the Quadratic (2.64) and Logistic (2.28) models, respectively. Due to nature of simple linear model, parameter c cannot be predicted. The parameter c, highlighting the pattern of decline in growth rate at time t, represented the highest value for the logistic model (0.14). It was followed by the Gompertz model (0.11). In addition, the lowest parameter c was obtained from Cubic model (-0.08). The parameter d, which is the only characteristic for the Cubic model, had negative value near to zero (- 0.00058). Akbas et al (1999) determined parameter a and b and R2 as 6.90, 0.129 and 93.4% for Daglıc male lambs and 9.51, 0.145 and 97.3% for Kivircik male lambs by simple linear model. The estimated a, b, c and R2 values for Gompertz model were 113.16, 2.87, 0.0047 and 99.63% for Daglıc male lambs, and 88.18, 2.35, 0.0054 and 99.28% for Kivircik male lambs, repectively (Akbas et al 1999). The same values for Logistic model were reported as 79.93, 6.81, 0.008 and 99.37% for Daglıc male lambs, and 76.33, 6.25, 0.0093 and 98.67% for Kivircik male lambs, respectively. Parameter a and b values determined in our study were higher than the values of Akbas et al (1999) for linear model.TheR2 value in our study was lower than the R2 value of Akbas et al (1999) for linear model.In our study, a, b, c and R2 values for Gompertz and Logistic models were lower than the values determined by Akbas et al (1999) except for the value of parameter c (0.14) for Logistic model. Aytekin et al (2010) determined theR2 values of Linear, Quadratic, Cubic and Gompertz model for Malya lambs weaned at 2 different live weights as 93.143, 98.652, 98.932 and 98.597 and 91.406, 98.530, 98.903 and 98.317, respectively. In our study, theR2 values of Linear, Quadratic, Cubic and Gompertz model were lower than the R2 values determined by Aytekin et al (2010), whereas MSPE and RESC values in our study were higher than MSPE and RESC values determined by Aytekin et al (2010). However, parameter a values for all models in the study of Aytekin et al (2010) were lower than our parameter a values, while parameters b, c and d values were higher than our parameters b, c and d values. (1) Quadratic model :3
Linear model : (1) Quadratic model: +c× (2) Cubic model : +(c× (3) Gompertz model: (4) Logistic model : (5)Where Y is the live weight at control time t; a is the initial live weight for Linear; Quadratic and Cubic models and asymptotic live weight for Gompertz and Logistic models; b, c and d are the model parameters which characterize the shape of the curve. The growth curve parameters of models (a, b, c, and d), coefficients of determination (R2), Mean Square Predicted Errors (MSPE) and correlations between observed live weights and residuals (RESC) were determined. The models representing higher R2, lower MSPE and RESC values were selected as the best fitting models.
3. Results and Discussion
Growth curve parameters and standard errors estimated by the models for live weight of Malya sheep were presented in Table 1. The highest value for parameter “a was obtained from the simple linear model (34.05) in respect of initial body weight. The highest value for the parameter a was obtained from the Gompertz model (71.17), which is one of the non-linear models based on adult live weight. The highest parameter b, which is responsible for the rising phase of the curve, was obtained from the Cubic model (3.35). It was followed by the Quadratic (2.64) and Logistic (2.28) models, respectively. Due to nature of simple linear model, parameter c cannot be predicted. The parameter c, highlighting the pattern of decline in growth rate at time t, represented the highest value for the logistic model (0.14). It was followed by the Gompertz model (0.11). In addition, the lowest parameter c was obtained from Cubic model (-0.08). The parameter d, which is the only characteristic for the Cubic model, had negative value near to zero (- 0.00058). Akbas et al (1999) determined parameter a and b and R2 as 6.90, 0.129 and 93.4% for Daglıc male lambs and 9.51, 0.145 and 97.3% for Kivircik male lambs by simple linear model. The estimated a, b, c and R2 values for Gompertz model were 113.16, 2.87, 0.0047 and 99.63% for Daglıc male lambs, and 88.18, 2.35, 0.0054 and 99.28% for Kivircik male lambs, repectively (Akbas et al 1999). The same values for Logistic model were reported as 79.93, 6.81, 0.008 and 99.37% for Daglıc male lambs, and 76.33, 6.25, 0.0093 and 98.67% for Kivircik male lambs, respectively. Parameter a and b values determined in our study were higher than the values of Akbas et al (1999) for linear model.TheR2 value in our study was lower than the R2 value of Akbas et al (1999) for linear model.In our study, a, b, c and R2 values for Gompertz and Logistic models were lower than the values determined by Akbas et al (1999) except for the value of parameter c (0.14) for Logistic model. Aytekin et al (2010) determined theR2 values of Linear, Quadratic, Cubic and Gompertz model for Malya lambs weaned at 2 different live weights as 93.143, 98.652, 98.932 and 98.597 and 91.406, 98.530, 98.903 and 98.317, respectively. In our study, theR2 values of Linear, Quadratic, Cubic and Gompertz model were lower than the R2 values determined by Aytekin et al (2010), whereas MSPE and RESC values in our study were higher than MSPE and RESC values determined by Aytekin et al (2010). However, parameter a values for all models in the study of Aytekin et al (2010) were lower than our parameter a values, while parameters b, c and d values were higher than our parameters b, c and d values. (2) Cubic model :3
Linear model : (1) Quadratic model: +c× (2) Cubic model : +(c× (3) Gompertz model: (4) Logistic model : (5)Where Y is the live weight at control time t; a is the initial live weight for Linear; Quadratic and Cubic models and asymptotic live weight for Gompertz and Logistic models; b, c and d are the model parameters which characterize the shape of the curve. The growth curve parameters of models (a, b, c, and d), coefficients of determination (R2), Mean Square Predicted Errors (MSPE) and correlations between observed live weights and residuals (RESC) were determined. The models representing higher R2, lower MSPE and RESC values were selected as the best fitting models.
3. Results and Discussion
Growth curve parameters and standard errors estimated by the models for live weight of Malya sheep were presented in Table 1. The highest value for parameter “a was obtained from the simple linear model (34.05) in respect of initial body weight. The highest value for the parameter a was obtained from the Gompertz model (71.17), which is one of the non-linear models based on adult live weight. The highest parameter b, which is responsible for the rising phase of the curve, was obtained from the Cubic model (3.35). It was followed by the Quadratic (2.64) and Logistic (2.28) models, respectively. Due to nature of simple linear model, parameter c cannot be predicted. The parameter c, highlighting the pattern of decline in growth rate at time t, represented the highest value for the logistic model (0.14). It was followed by the Gompertz model (0.11). In addition, the lowest parameter c was obtained from Cubic model (-0.08). The parameter d, which is the only characteristic for the Cubic model, had negative value near to zero (- 0.00058). Akbas et al (1999) determined parameter a and b and R2 as 6.90, 0.129 and 93.4% for Daglıc male lambs and 9.51, 0.145 and 97.3% for Kivircik male lambs by simple linear model. The estimated a, b, c and R2values for Gompertz model were 113.16, 2.87, 0.0047 and 99.63% for Daglıc male lambs, and 88.18, 2.35, 0.0054 and 99.28% for Kivircik male lambs, repectively (Akbas et al 1999). The same values for Logistic model were reported as 79.93, 6.81, 0.008 and 99.37% for Daglıc male lambs, and 76.33, 6.25, 0.0093 and 98.67% for Kivircik male lambs, respectively. Parameter a and b values determined in our study were higher than the values of Akbas et al (1999) for linear model.TheR2 value in our study was lower than the R2 value of Akbas et al (1999) for linear model.In our study, a, b, c and R2 values for Gompertz and Logistic models were lower than the values determined by Akbas et al (1999) except for the value of parameter c (0.14) for Logistic model. Aytekin et al (2010) determined theR2 values of Linear, Quadratic, Cubic and Gompertz model for Malya lambs weaned at 2 different live weights as 93.143, 98.652, 98.932 and 98.597 and 91.406, 98.530, 98.903 and 98.317, respectively. In our study, theR2 values of Linear, Quadratic, Cubic and Gompertz model were lower than the R2 values determined by Aytekin et al (2010), whereasMSPE and RESC values in our study were higher than MSPE and RESC values determined by Aytekin et al (2010). However, parameter a values for all models in the study of Aytekin et al (2010) were lower than our parameter a values, while parameters b, c and d values were higher than our parameters b, c and d values. (3) Gompertz model :3
Linear model : (1) Quadratic model: +c× (2) Cubic model : +(c× (3) Gompertz model: (4) Logistic model : (5)Where Y is the live weight at control time t; a is the initial live weight for Linear; Quadratic and Cubic models and asymptotic live weight for Gompertz and Logistic models; b, c and d are the model parameters which characterize the shape of the curve. The growth curve parameters of models (a, b, c, and d), coefficients of determination (R2), Mean Square Predicted Errors (MSPE) and correlations between observed live weights and residuals (RESC) were determined. The models representing higher R2, lower MSPE and RESC values were selected as the best fitting models.
3. Results and Discussion
Growth curve parameters and standard errors estimated by the models for live weight of Malya sheep were presented in Table 1. The highest value for parameter “a was obtained from the simple linear model (34.05) in respect of initial body weight. The highest value for the parameter a was obtained from the Gompertz model (71.17), which is one of the non-linear models based on adult live weight. The highest parameter b, which is responsible for the rising phase of the curve, was obtained from the Cubic model (3.35). It was followed by the Quadratic (2.64) and Logistic (2.28) models, respectively. Due to nature of simple linear model, parameter c cannot be predicted. The parameter c, highlighting the pattern of decline in growth rate at time t, represented the highest value for the logistic model (0.14). It was followed by the Gompertz model (0.11). In addition, the lowest parameter c was obtained from Cubic model (-0.08). The parameter d, which is the only characteristic for the Cubic model, had negative value near to zero (- 0.00058). Akbas et al (1999) determined parameter a and b and R2 as 6.90, 0.129 and 93.4% for Daglıc male lambs and 9.51, 0.145 and 97.3% for Kivircik male lambs by simple linear model. The estimated a, b, c and R2values for Gompertz model were 113.16, 2.87, 0.0047 and 99.63% for Daglıc male lambs, and 88.18, 2.35, 0.0054 and 99.28% for Kivircik male lambs, repectively (Akbas et al 1999). The same values for Logistic model were reported as 79.93, 6.81, 0.008 and 99.37% for Daglıc male lambs, and 76.33, 6.25, 0.0093 and 98.67% for Kivircik male lambs, respectively. Parameter a and b values determined in our study were higher than the values of Akbas et al (1999) for linear model.TheR2 value in our study was lower than the R2 value of Akbas et al (1999) for linear model.In our study, a, b, c and R2 values for Gompertz and Logistic models were lower than the values determined by Akbas et al (1999) except for the value of parameter c (0.14) for Logistic model. Aytekin et al (2010) determined theR2 values of Linear, Quadratic, Cubic and Gompertz model for Malya lambs weaned at 2 different live weights as 93.143, 98.652, 98.932 and 98.597 and 91.406, 98.530, 98.903 and 98.317, respectively. In our study, the R2 values of Linear, Quadratic, Cubic and Gompertz model were lower than the R2 values determined by Aytekin et al (2010), whereasMSPE and RESC values in our study were higher than MSPE and RESC values determined by Aytekin et al (2010). However, parameter a values for all models in the study of Aytekin et al (2010) were lower than our parameter a values, while parameters b, c and d values were higher than our parameters b, c and d values. (4) Logistic model : Linear model : (1) Quadratic model: +c× (2) Cubic model : +(c× (3) Gompertz model: (4) Logistic model : (5) Where Y is the live weight at control time t; a is the initial live weight for Linear; Quadratic and Cubic models and asymptotic live weight for Gompertz and Logistic models; b, c and d are the model parameters which characterize the shape of the curve. The growth curve parameters of models (a, b, c,and d), coefficients of determination (R2), Mean Square Predicted Errors (MSPE) and correlations
between observed live weights and residuals (RESC) were determined. The models representing higher
R2, lower MSPE and RESC values were selected as the best fitting models.
3. Results and Discussion
Growth curve parameters and standard errors estimated by the models for live weight of Malya sheep were presented in Table 1. The highest value for parameter “a was obtained from the simple linear model (34.05) in respect of initial body weight. The highest value for the parameter a was obtained from the Gompertz model (71.17), which is one of the non-linear models based on adult live weight. The highest parameter b, which is responsible for the rising phase of the curve, was obtained from the Cubic model (3.35). It was followed by the Quadratic (2.64) and Logistic (2.28) models, respectively.
Due to nature of simple linear model, parameter c cannot be predicted. The parameter c, highlighting the pattern of decline in growth rate at time t, represented the highest value for the logistic model (0.14). It was followed by the Gompertz model (0.11). In addition, the lowest parameter c was obtained from Cubic model (-0.08). The parameter d, which is the only characteristic for the Cubic model, had negative value near to zero (- 0.00058).
Akbas et al (1999) determined parameter a and b and R2 as 6.90, 0.129 and 93.4% for Daglıc male
lambs and 9.51, 0.145 and 97.3% for Kivircik male lambs by simple linear model. The estimated a, b, c
and R2 values for Gompertz model were 113.16, 2.87, 0.0047 and 99.63% for Daglıc male lambs, and
88.18, 2.35, 0.0054 and 99.28% for Kivircik male lambs, repectively (Akbas et al 1999). The same values for Logistic model were reported as 79.93, 6.81, 0.008 and 99.37% for Daglıc male lambs, and 76.33, 6.25, 0.0093 and 98.67% for Kivircik male lambs, respectively. Parameter a and b values determined in
our study were higher than the values of Akbas et al (1999) for linear model.TheR2 value in our study
was lower than the R2 value of Akbas et al (1999) for linear model.In our study, a, b, c and R2 values for
Gompertz and Logistic models were lower than the values determined by Akbas et al (1999) except for the value of parameter c (0.14) for Logistic model.
Aytekin et al (2010) determined theR2 values of Linear, Quadratic, Cubic and Gompertz model for
Malya lambs weaned at 2 different live weights as 93.143, 98.652, 98.932 and 98.597 and 91.406, 98.530,
98.903 and 98.317, respectively. In our study, theR2 values of Linear, Quadratic, Cubic and Gompertz
model were lower than the R2 values determined by Aytekin et al (2010), whereas MSPE and RESC
values in our study were higher than MSPE and RESC values determined by Aytekin et al (2010). However, parameter a values for all models in the study of Aytekin et al (2010) were lower than our parameter a values, while parameters b, c and d values were higher than our parameters b, c and d values.
(5)
Where Y is the live weight at control time t;
a is the initial live weight for Linear; Quadratic
and Cubic models and asymptotic live weight for
Gompertz and Logistic models; b, c and d are the
model parameters which characterize the shape of
the curve. The growth curve parameters of models
(a, b, c, and d), coefficients of determination
(R
2), Mean Square Predicted Errors (MSPE) and
correlations between observed live weights and
residuals (RESC) were determined. The models
representing higher R
2, lower MSPE and RESC
values were selected as the best fitting models.
3. Results and Discussion
Growth curve parameters and standard errors
estimated by the models for live weight of Malya
sheep were presented in Table 1. The highest value
for parameter “a was obtained from the simple linear
model (34.05) in respect of initial body weight. The
highest value for the parameter a was obtained from
the Gompertz model (71.17), which is one of the
non-linear models based on adult live weight. The
highest parameter b, which is responsible for the
rising phase of the curve, was obtained from the
Cubic model (3.35). It was followed by the Quadratic
(2.64) and Logistic (2.28) models, respectively.
Due to nature of simple linear model, parameter
c cannot be predicted. The parameter c, highlighting
the pattern of decline in growth rate at time t,
represented the highest value for the logistic model
(0.14). It was followed by the Gompertz model
(0.11). In addition, the lowest parameter c was
obtained from Cubic model (-0.08). The parameter
d, which is the only characteristic for the Cubic
Ta r ı m B i l i m l e r i D e r g i s i – J o u r n a l o f A g r i c u l t u r a l S c i e n c e s 19 (2013) 71-78
74
Akbas et al (1999) determined parameter a and
b and R
2as 6.90, 0.129 and 93.4% for Daglıc male
lambs and 9.51, 0.145 and 97.3% for Kivircik male
lambs by simple linear model. The estimated a, b,
c and R
2values for Gompertz model were 113.16,
2.87, 0.0047 and 99.63% for Daglıc male lambs, and
88.18, 2.35, 0.0054 and 99.28% for Kivircik male
lambs, repectively (Akbas et al 1999). The same
values for Logistic model were reported as 79.93,
6.81, 0.008 and 99.37% for Daglıc male lambs,
and 76.33, 6.25, 0.0093 and 98.67% for Kivircik
male lambs, respectively. Parameter a and b values
determined in our study were higher than the values
of Akbas et al (1999) for linear model.
The
R
2value
in our study was lower than the R
2value of Akbas
et al (1999) for linear model.
In our study, a, b, c
and R
2values for Gompertz and Logistic models
were lower than the values determined by Akbas et
al (1999) except for the value of parameter c (0.14)
for Logistic model.
Aytekin et al (2010) determined the
R
2values
of Linear, Quadratic, Cubic and Gompertz model
for Malya lambs weaned at 2 different live weights
as 93.143, 98.652, 98.932 and 98.597 and 91.406,
98.530, 98.903 and 98.317, respectively. In our
study, the
R
2values of Linear, Quadratic, Cubic
and Gompertz model were lower than the R
2values
determined by Aytekin et al (2010), whereas
MSPE
and RESC values in our study were higher than
MSPE and RESC values determined by Aytekin et al
(2010).
However, parameter a values for all models
in the study of Aytekin et al (2010) were lower than
our parameter a values, while parameters b, c and
d values were higher than our parameters b, c and
d values.
Table 1- The model parameter values and standard errors estimated by several models in respect of live weight of Malya sheep
Çizelge 1- Malya koyunlarında canlı ağırlık bakımından çeşitli modeller ile tahmin edilen model parametre değerleri ve standart hataları
Models Model parameters
a S a ± b ±Sb c ±Sc d ±Sd Linear 34.05 ± 1.203 0.99 ± 0.049 Quadratic 21.40 ± 1.267 2.64 ± 0.144 - 0.04 ± 0.003 Cubic 18.58 ± 0.828 3.35 ± 0.249 -0.08 ± 0.015 - 0.00058 ± 0.00024 Gompertz 71.17 ± 2.481 1.31 ± 0.078 0.11 ± 0.009 Logistic 70.15 ± 2.225 2.28 ± 0.220 0.14 ± 0.010
The coefficients of determination (R
2), Mean
Square Predicted Errors (MSPE) and correlations
between observed live weights and residuals
(RESC) for Linear, Quadratic, Cubic, Gompertz
and Logistic models were presented in Table 2.
R
2, MSPE and RESC are crucial values in the
determination of the best fitting model or models.
In our study R
2values for Linear, Quadratic, Cubic,
Gompertz and Logistic models were found as
83.13, 91.04, 92.04, 91.55 and 91.22, respectively.
MSPE and RESC values were determined as
65.900, 34.657, 30.894, 32.956 and 34.101, and
0.469, 0.287, 0.279, 0.299 and 0.333, respectively.
The highest R
2value was obtained from Cubic
model (92.04). All R
2values were similar except
for R
2value obtained from Linear model. The
highest MSPE value (65.900) was obtained from
Linear model and the lowest from Cubic model
(30.894). All models had similar MSPE values
except for Linear model. MSPE and RESC values
had the same trend for all models.
Ta r ı m B i l i m l e r i D e r g i s i – J o u r n a l o f A g r i c u l t u r a l S c i e n c e s 19 (2013) 71-78
75
Table 2- The determination coefficients (R2),mean square predicted error (MSPE), correlation between observed live weight and residuals (RESC) and standard errors of models in Malya sheep
Çizelge 2- Malya koyunlarında modellere ait belirleme katsayıları (R2), hata kareler ortalamaları (HKO), artık
değerler ile gerçek veriler arasındaki korelasyonları (AGAK) ve standart hataları
Models R2 MSPE RESC
Linear 83.13 ± 0.015 65.900 ± 6.170 0.469
Quadratic 91.04 ± 0.010 34.657 ± 3.056 0.287
Cubic 92.04 ± 0.009 30.894 ± 2.425 0.279
Gompertz 91.55 ± 0.016 32.956 ± 3.295 0.299
Logistic 91.22 ± 0.017 34.101 ± 3.425 0.333
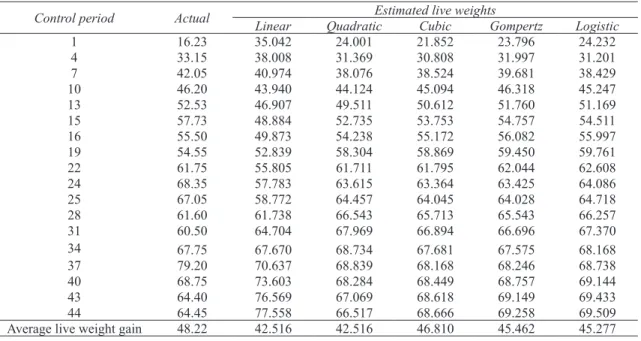
Actual and estimated live weight values of
Malya sheep based on the models from weaning to
mature age were given in Table 3. The cubic model
represented the best prediction for the actual weaning
weight (16.23 kg vs. 21.852 kg). On the other hand,
best fit for the last control period (44th) with respect
to the actual weight (64.45 kg) was obtained from
the Quadratic and Cubic models (66.517 kg and
68.666 kg). Average actual weight gain during the
study was 48.22 kg. The best prediction of average
actual weight gain was obtained from Cubic model
(46.810 kg). Also, adequate predictions in respect of
the mature live weight (approximately at the 37th
month and nearly 70 kg live weight) were acquired
by all models.
R
2values of the Linear model explaining the
growth curve of Akkaraman, Awassi x Akkaraman
and Malya x Akkaraman lambs during the fattening
period were determined as 0.990, 0.993 and 0.989,
respectively by Kocabas et al (1997). These R
2values were higher than our values for all models.
Sireli & Ertugrul (2004) determined R
2and MSPE
values for Dorset Down x Akkaraman (BD
1),
Akkaraman and Akkaraman x BD
1lambs as 0.99,
0.99 and 0.99; 0.457, 1.397 and 1.054, respectively
by using Logistic model. In our study, the R
2value
(91.22%) for Logistic model was lower while MSPE
value (34.101) was higher than the values of above
mentioned study.
Table 3- Actual and estimated live weight of Malya lambs based on models from weaning to mature age (kg)
Çizelge 3- Malya koyunlarının sütten kesimden ergin yaşa kadar gerçekleşen ve modeller ile tahmin edilen canlı ağırlık değerleri (kg)
Control period Actual Linear QuadraticEstimated live weightsCubic Gompertz Logistic
1 16.23 35.042 24.001 21.852 23.796 24.232 4 33.15 38.008 31.369 30.808 31.997 31.201 7 42.05 40.974 38.076 38.524 39.681 38.429 10 46.20 43.940 44.124 45.094 46.318 45.247 13 52.53 46.907 49.511 50.612 51.760 51.169 15 57.73 48.884 52.735 53.753 54.757 54.511 16 55.50 49.873 54.238 55.172 56.082 55.997 19 54.55 52.839 58.304 58.869 59.450 59.761 22 61.75 55.805 61.711 61.795 62.044 62.608 24 68.35 57.783 63.615 63.364 63.425 64.086 25 67.05 58.772 64.457 64.045 64.028 64.718 28 61.60 61.738 66.543 65.713 65.543 66.257 31 60.50 64.704 67.969 66.894 66.696 67.370 34 67.75 67.670 68.734 67.681 67.575 68.168 37 79.20 70.637 68.839 68.168 68.246 68.738 40 68.75 73.603 68.284 68.449 68.757 69.144 43 64.40 76.569 67.069 68.618 69.149 69.433 44 64.45 77.558 66.517 68.666 69.258 69.509
Ta r ı m B i l i m l e r i D e r g i s i – J o u r n a l o f A g r i c u l t u r a l S c i e n c e s 19 (2013) 71-78
76
R
2and MSPE values of growth curve of
Anatolian Merino lambs during the fattening period
were determined as 0.990 and 0.80, respectively
by Linear model, 0.990 and 0.79, respectively by
Quadratic model (Keskin & Dağ 2006). R
2values
of Linear and Quadratic models (83.13% and
91.04%) were lower, whereas MSPE values (65.9
and 34.657) were higher than our values. Aytekin
et al (2009) reported that the highest R
2values were
obtained from Linear, Quadratic, Cubic models
used to identify the growth curve of Akkaraman and
Anatolian Merino lambs during the fattening period.
The findings of Aytekin et al (2009) were higher than
our findings. However, MSPE and RESC values
determined by Aytekin et al (2009) were lower than
those of our study.
The models representing higher R
2and lower
MSPE and RESC values should be recommended
as a best-fitting model to describe the growth curve.
Our R
2, MSPE and RESC values demonstrated that
the Cubic model was the best fitting model, and
it was followed by the Gompertz, Quadratic and
Logistic models, respectively.
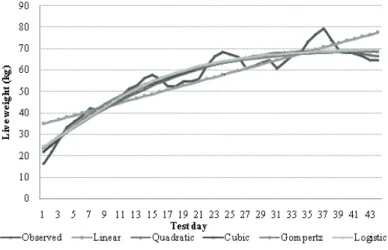
The actual and estimated live weight values of
Malya sheep during growth period considering the
models are presented in Figure 1. As seen in Figure 1,
the estimated growth curves of different models
for Malya sheep were similar except for the growth
curve of linear model. The actual live weights
of Malya sheep declined at 15th, 24th and 37th
control periods (Fig. 1).
This can be explained by
parturition events of sheep at these periods. Sheep
gave first birth at the age of 17-18 months, second
birth at the age of 26-27 months and third birth at
the age of 39-40 months. Glucose requirement of
fetus increases, while appetite and feed intake of
ewe decline towards the end of pregnancy. As a
result, ewes cannot consume enough organic matter,
especially glucose.
Energy and glucose requirement
of fetus may not be fulfilled. In this case, sheep have
to use the body storage materials (glycogen and
fat tissue). The ewes carrying particularly twins or
triplets need more body storage agents in order to
supply energy requirements of twins or triplets. In
this case, ewes become weakened at birth and lose
body weight until reaching maximum daily milk
yield (Sezenler et al 2008).
Up to date, many studies were carried on
post-natal growth of farm animals with different models
and a number of suggestions were made on this
subject. In recent years, studies have focused on
pre-natal growth. The studies on this subject are of
great importance in order to increase future yields of
farm animals in Turkey.
Figure 1- The observed and estimated growth curves by several models in Malya sheep
Ta r ı m B i l i m l e r i D e r g i s i – J o u r n a l o f A g r i c u l t u r a l S c i e n c e s 19 (2013) 71-78
77
4. Conclusions
In the present study, higher R
2value, lower MSPE
and RESC values and similarity of actual and
estimated live weight values were preferred in order
to determine the best-fit model for Malya sheep. Our
values revealed that the best fit to the growth curves
of Malya ewes was acquired with cubic model.
However, all the models except for the linear model
described adequately the growth of Malya sheep in
this period. These results are of great importance
to determine appropriate rearing and nutrition
strategies for growers.
References
Akbaş Y, Taşkın T & Demirören E (1999). Comparison of several models to fit the growth curves of Kivircik and Daglıc male lambs. Turkish Journal of Veterinary and Animal Sciences 23(3): 537-544
Aytekin İ, Karabacak A, Zülkadir U, Keskin İ & Boztepe S (2009). Usage of some models for describing the growth curves of Akkaraman and Anatolia Merino lambs raised in open and closed sheepfolds at the fattening period. Selçuk Journal of Agriculture and Food Sciences 23(49): 30-35
Aytekin İ, Zülkadir U, Keskin İ & Boztepe S (2010). Fitting of different mathematic models to the growth curves of female Malya lambs weaned at two different live weights. Trends in Animal and Veterinary Sciences 1(2): 19-23
Bayram B, Akbulut Ö, Yanar M & Tüzemen N (2004). Analysis of growth characteristics using the Richards model in female Brown Swiss and Holstein Friesian cattle. Turkish Journal of Veterinary and Animal Sciences 28: 201-208
Brown J E, Fitzhung Jr H A & Cartwright T C (1976). A comparison of nonlinear models for describing weight-age relationships in cattle. Journal of Animal Science 42: 810-818
Çamdeviren H & Taşdelen B (2002). Mono and multiphasic analysis of growth curves selected of a Japanese quail line at 5-week’s body weight. Turkish Journal of Veterinary and Animal Sciences 26: 421-427
Çetin M, Şengül T, Söğüt B & Yurtseven S (2007). Comparision of growth models of male and female
partridges. Journal of Biological Sciences 7(6): 964-968
Çolak C, Orman M N & Ertuğrul O (2006). Simental x Güney Anadolu Kırmızısı sığırlarına ait canlı ağırlık ölçümlerine dayanan doğrusal ve doğrusal olmayan büyüme eğrileri. Lalahan Hayvancılık Araştırma Enstitüsü Dergisi 46(1): 1-5
Daşkıran I, Koncagül S & Bingöl M (2010). Growth characteristics of indigenous Norduz female and male lambs. Journal of Agricultural Sciences 16: 62-69 Efe E (1990). Büyüme eğrileri. Doktora Tezi, Çukurova
Üniversitesi, Fen Bilimleri Enstitüsü ,Zootekni Anabilim Dalı (Yayımlanmamış), Adana
Esenbuğa N, Bilgin Ö C, Macit M & Karaoğlu M (2000). İvesi, Morkaraman ve Tuj kuzularında büyüme eğrileri. Atatürk Üniversitesi Ziraat Fakültesi Dergisi
31(1): 37-41
Karakuş K, Eyduran E, Kum D, Özdemir T & Cengiz F (2008). Determination of the best growth curve and measurement interval in Norduz male lambs. Journal of Animal and Veterinary Advances 7(11): 1464-1466 Keskin İ & Dağ B (2006). Comparison of the Linear and
Quadratic models for describing the growth of live weight and body measurements in Anatolian Merino male lambs in fattening period. Journal of Animal and Veterinary Advances 5(1): 81-84
Keskin İ, Dağ B, Sarıyel V & Gökmen M (2009). Estimation of growth curve parameters in Konya Merino Sheep. South African Journal of Animal Science 39(2): 163–168
Kocabaş Z, Kesici T & Eliçin A (1997). Growth curve of Akkaraman, Awassi x Akkaraman and Malya x Akkaraman lambs. Turkish Journal of Veterinary and Animal Science 21(3): 267-275
Koncagul S & Cadirci S (2009). Comparison of three non-linear models when data truncated at different lengths of growth period in Japanese quails. European Poultry Science 73(1): 7–12
Koncagul S & Cadirci S (2010). Analysis of growth curve of broiler with restricting and unrestricting initial body weight in Gompertz-Laird model in different environments. Italian Journal of Animal Science 9(1): 20–25
Kor A, Başpınar E, Karaca S & Keskin S (2006). The determination of growth in Akkeci (White goat) female kids by various growth models. Czech Journal of Animal Science 51(3): 110–116
Ta r ı m B i l i m l e r i D e r g i s i – J o u r n a l o f A g r i c u l t u r a l S c i e n c e s 19 (2013) 71-78
78
Lopez de Torre G, Candotti J J, Reverter A, Bellido M M, Vasco P, Garcia L J & Brinks J S (1992). Effects of growth curve parameters on cow efficiency. Journal of Animal Science 70: 2668-2672
Narinç D, Aksoy T, Karaman E & Cürek D İ (2010). Analysis of fitting growth models in medium growing chicken raised indoor system. Trends in Animal and Veterinary Sciences 1(2):12-18
Norris D, Ngambi J W, Benyi K, Makgahlela M L, Shimelis H A & Nesamvuni E A (2007). Analysis of growth curves of indigenous male Venda and Naked Neck chickens. South African Journal of Animal Science 37: 21–26
Özdemir H & Dellal G (2009). Determination of growth curves in young Angora goats Tarım Bilimleri Dergisi
15 (4): 358-362
Özen N (1997). Cattle feeding and fattening of beef cattle. Akdeniz Üniversity, Agricultural Faculty, Note book: 2, Antalya
Sezenler T, Köycü E & Özder M (2008). Karacabey merinosu koyunlarda doğum kondisyon puanının kuzuların gelişimi üzerine etkileri. Tekirdağ Ziraat Fakültesi Dergisi 5(1): 45-53
Soysal M İ, Tuna Y T, Gürcan E K & Özkan E (1999). The investigation on comparison of various linear and
non-linear growth curve in Japanese Quail (Coturnix coturnix japonica). Hayvancılık Araştırma Dergisi
9(1-2):40-44
Statistica 5.0 (1995). Stat soft, Inc. 2325 East 13th Street,
U.S.A
Şengül T & Kiraz S (2005). Non-linear models of growth curves in Large White Turkeys. Turkish Journal of Veterinary and Animal Sciences 29: 331-337
Şireli H D & Ertuğrul M (2004). Dorset Down x Akkaraman (GD1), Akkaraman ve Akkaraman x GD1 genotipli kuzularda büyüme eğrilerinin Logistic model ile tahmini. Tarım Bilimleri Dergisi-Journal of Agricultural Sciences 10(4): 375-380
Topal M, Özdemir M, Aksakal V, Yıldız N & Dogru U (2004). Determination of the best nonlinear function in order to estimate growth in Morkaraman and Awassi lambs. Small Ruminant Research 55: 229–232 Yakupoglu C & Atil H (2001). Comparison of growth
curve models on broilers II: Comparison of models. Online Journal of Biological Science 1(7): 682–684 Yıldız G, Soysal M İ & Gürcan E K (2009). Determination
of growth curve with different model in the Karacabey Merino x Kıvırcık crossbred lambs raised in Tekirdağ provinces. Tekirdağ Ziraat Fakültesi Dergisi 6(1): 11-19