Fundamental Ratios and Stock Market Performance: Evidence from Turkey Parlak, Deniz; Doğuş University, İstanbul
ABSTRACT
The fundamental analysis strives to determine the approximate future market value of a firm by examining related economic, financial and other qualitative and quantitative factors. An important step in a fundamental analysis is the computation of basic ratios which provide an indication of firms' financial performance in several key areas. The purpose of this study is to investigate the financial performance of Turkish manufacturing companies and the impact of this performance on common stock returns for the three years from 2009 to 2012.
The sample consisted of 20 chemical-sector firms quoted to the Istanbul Stock Exchange. The chemical sector was intentionally selected as it is a field that provides significant input to many branches of industry, such as automotive, leather products, glass, textile and paper products and it is considered one of the key sectors of the Turkish economy. For each company seven key financial ratios were calculated separately for three years in the analysis. The selected ratios are return on asset and return on equity which measure profitability, current ratio and quick ratio which measure liquidity, debt ratio which measures leverage, and accounts receivable turnover and asset turnover which measure efficiency.
Technique for Order of Preference by Similarity to Ideal Solution (TOPSIS) is a multi-criteria decision analysis that compares a set of alternatives by identifying weights for each criterion, and calculating the geometric distance between each alternative and the ideal alternative, which represents the best score in each criterion. In the context of this analysis the method is applied to rank the firms in the sample according to seven criteria, which are financial ratios in the context of this analysis. TOPSIS ranking was performed separately for the three years of this analysis.
Based upon the rankings two portfolios are constructed: the first is comprised of 10 best performers and the second is comprised of 10 worst performers. The stock market returns of both portfolios are calculated separately for three years in the analysis. The t-test which was conducted revealed that there was no significant difference between the yearly returns of the two portfolios for any of the three years of this analysis.
JEL CODE: G32
Key words: Ratio analysis, TOPSIS, portfolio return
1. Introduction
Performance evaluation is one of the most critical challenges facing the organizations. The financial performance measurement system plays a key role for managers in developing strategic plans, evaluating the achievement of firms’ objectives and implementing corrective actions when required. But the most important role of performance evaluation however, lies in the determination of the present and future value of a firm.
The fundamental analysis which is a widely used technique in performance measurement, strives to determine the approximate future market value of a firm by examining related economic, financial and other qualitative and quantitative factors. An important step in a fundamental analysis is the computation of basic ratios which provides an indication of firms' financial performance in several key areas. Of critical concern in this process is the determination of which ratios and which weights will be used to measure the performance. Multi-criteria decision-making techniques offer various methods of dealing with the above-mentioned problem (Brealey et all., 2012).
One of the more widely used multi-criteria decision-making methods is “The Technique for Order of Preference by Similarity to Ideal Solution (TOPSIS)”. This is a multi-criteria decision analysis technique, that was originally developed by Hwang and Yoon in 1981 with further developments by Yoon in 1987, and Hwang, Lai and Liu in 1993. TOPSIS is a method of compensatory aggregation which compares a set of alternatives by identifying weights for each criterion, normalizing scores for each criterion and calculating the geometric distance between each alternative and the ideal alternative, which represents the best score in each criterion (Demireli, 2010).
An important output of the TOPSIS technique is the ranking of alternatives which in the context of firms’ performance evaluation provides an important input to portfolio managers. In order to increase the performance of their portfolios portfolio managers strive to select the best performing stocks, for which an important determinant is the performance of the companies underlying the shares.
The purpose of this study is to investigate the persistence in the financial performance of Turkish chemical sector manufacturing companies and the impact of this performance on common stock returns for the three years from 2009 to 2012. The TOPSIS method is used to evaluate and to compare the performance of 20 firms in the analysis.
Although a vast amount of literature on firms’ financial performance already exists, the multi-criteria decision-making methods are rarely used in the evaluation process of such companies. This is the main contribution of this paper to existing literature. Emerging markets on the other hand, have their own dynamics which makes them unique and different than developed markets. Considering this phenomenon from an emerging market perspective represents another important contribution of this research.
The reminder of the paper is organized as follows. Data and methodology are presented in Part 2; Part 3 presents the analysis and the results. Part 4 concludes the discussion.
2. Data and Methodology
As stated in the introduction, the purpose of this study is to search for persistence in the financial performance of industrial companies in the chemical sector and the impact of this performance on common stock returns. Hence the hypothesis of the study is:
H1: The stock returns of a portfolio composed of the shares of the firms with higher financial
performance are greater than those of a portfolio composed of the shares of the firms with lower financial performance.
The analysis was conducted on a sample of 20 Turkish chemical-sector firms quoted to the Istanbul stock exchange. The chemical sector was intentionally selected as it is a field that provides significant amounts of input to many branches of industry, such as automotive, leather products, glass, textile and paper products and is considered one of the key sectors of Turkish economy. The industry employs more than 81,500 people in approximately 4,000 companies. It has developed significantly and is expected to develop further in terms of quality, productivity, and environmental awareness as part of Turkey’s adaptation to EU standards. As one of the main producers of soda ash, chrome and boron in the world Turkey has competitive advantage in this sector. The primary products exported by the Turkish chemical industry include petrochemicals, fertilizers, pharmaceuticals, synthetic fiber and strings, soap and detergent, as well as paints. There are about 314 companies with foreign investment in the Turkish chemical industry, an industry which has captured 13 percent share of total foreign capital in Turkey. The export volume of the Turkish chemical industry is increasing steadily. Today, the chemical industry was one of the most important exporting sectors among total industrial exports. In recent history, exports of chemicals constituted approximately 6.2 percent of all Turkish exports, making it the 4th largest sector by value of exports after the automotive, steel and textile industries (Deloitte, 2010; Erk ,2010).
Due to data restrictions only 20 firms which were quoted to the stock exchange were included in the sample. Of those 20 firms, 13 were local firms and the remaining 7 had foreign ownership greater than 40 percent. Five firms had a sales volume greater than $1 billion; 5 had sales volumes between $500 million and $1 billion, the remaining 10 firms were small companies with sales volume less than $500 million.
Financial ratios provide insights about the company in an organized way and allow for the comparison of different firms. The ratios are classified according to the information they provide. The main areas of measurement are liquidity, profitability, efficiency and leverage of a company. Liquidity ratios measure the extent to which assets can be turned into cash quickly whereas profitability ratios measure how much profit a business has made. Leverage ratios reveal the financing and risk structure of a company and finally efficiency ratios measure how effectively a company utilizes its assets and manages its liabilities (Weygandt et all., 2012)
In the existing literature many metrics have been developed to measure these dimensions. In the context of this analysis seven measures are used of which two are for liquidity, two for profitability, two for efficiency and one for leverage. The two metrics that measure liquidity are current ratio (CR) and quick (QR) ratio. Both show the short-term debt-paying ability of a company. CR is defined as current assets divided by current liabilities whereas QR is defined as quick assets -which are cash, marketable securities and receivables- divided by current liabilities. Profitability is measured according to return on assets (ROA) and return on equity (ROE). ROE is calculated as net income divided by average equity whereas ROA is calculated by dividing net income less financial expenses to average assets. Efficiency measures used in this study is account receivable efficiency (ARE) and asset efficiency (AE).ARE is calculated by dividing net sales to average accounts receivables and AE is calculated by dividing net sales to average assets. Finally leverage is measured by debt equity ratio (DE) which is calculated by dividing total liabilities to total equity (Brealey et all., 2012; Weygandt et all. 2012).
The balance sheets and income statements of 20 firms in the sample were obtained from the website of public disclosure platform (www.kap.gov.tr) and the ratios were calculated thereupon.
To rank the 20 companies in the sample The Technique for Order of Preference by Similarity to Ideal Solution (TOPSIS) method was used. In this method two artificial alternatives are hypothesized. The first is the ideal alternative which represents the alternative that has the best level for all attributes considered and the second is the negative ideal alternative which represents the alternative that has the worst attribute values. TOPSIS selects the alternative that is the closest to the ideal solution and farthest from negative ideal alternative (Uygurtürk and Korkmaz, 2012).
To apply TOPSIS m alternatives (options) and n attributes/criteria should be selected and the score of each option with respect to each criterion should be calculated. After the identification of alternatives and options TOPSIS is applied at five stages:
1. Construction of the normalized decision matrix: This step transforms various attribute dimensions into non-dimensional attributes, which allows for comparisons across criteria. Scores or data are normalized scores or data as follows:
rij = xij/ (Σx2ij) for i = 1, …, m; j = 1, …, n
2. Construction of the weighted normalized decision matrix. A set of weights is determined for
each criteria wj for j = 1,…n. Each column of the normalized decision matrix is multiplied by its
associated weight.
3. Determination of the ideal and negative ideal solutions. Ideal solution is:
A* = { v1* , …, vn*}, where
vj* ={ max (vij) if j € J ; min (vij) if j € J' }
Negative ideal solution.
A' = { v1' , …, vn' }, where
v' = { min (vij) if j € J ; max (vij) if j € J' }
4. Calculation of the separation measure for each alternative. The separation from the ideal alternative is:
Si * = [ Σ (vj*– vij)2 ] ½ i = 1, …, m
Similarly, the separation from the negative ideal alternative is:
S'i = [ Σ (vj' – vij)2 ] ½ i = 1, …, m
5. Calculation of the relative closeness to the ideal solution Ci*
Ci* = S'i / (Si* +S'i ) , 0 < Ci* < 1
The option with Ci*closest to 1 is selected.
In the context of this analysis in the calculation of “C” score, equal weights are given to each criterion and the firms are ranked according to their “C” values for each year in the analysis separately.
To test the single hypothesis of this study two different portfolios were formed. The first consisted of 10 best performers and the second consisted of 10 worst performers. The stock market returns of both portfolios were calculated separately for three years in the analysis. The data for stock prices was obtained from the website of Istanbul Stock Exchange (www.imkb.gov.tr) and yearly stock returns were calculated thereupon.
3. Analysis and Findings
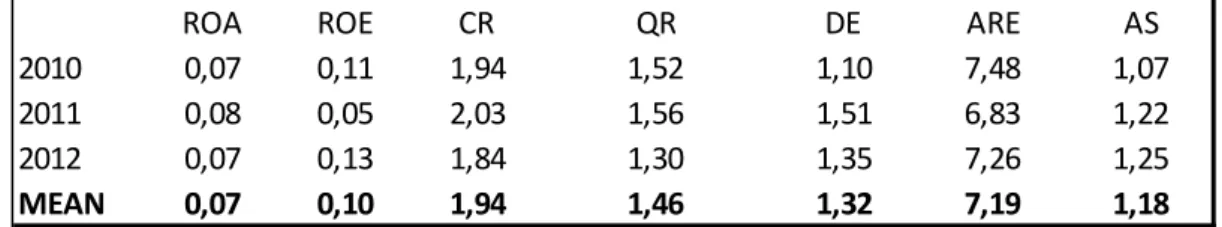
The calculated ratios are presented at Attachment 1 and the mean ratios at Table 1. Table1. Financial Ratios
As Table 1 shows, in terms of net income, highest profitability was obtained at year 2011 whereas in terms of net income less financial expenses at year 2012. Firms in the sample had both highest liquidity and largest debt at year 2011. The most efficient year in terms of accounts receivables was 2010 whereas in terms of assets the year 2012.
At the next step, consistent with TOPSİS approach, the ratios were normalized. Mean normalized ratios are presented at Table 2.
Table2. Normalized Financial Ratios
To construct weighted normalized matrix, equal weights were given to all ratios. Based on normalized weighted matrix ideal positive and negative solutions were calculated. The computed ideal positive and negative solutions are presented at Table 3.
Table 3. Ideal positive and negative ratios
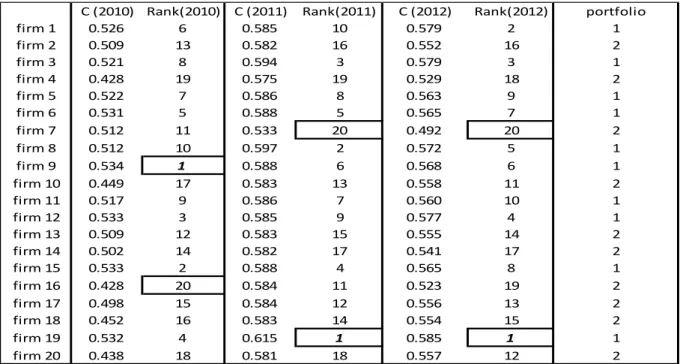
“C” values were then computed for each observation based on the distance between the observation and positive and negative ideal solution. The observations were ranked according to “C” values for all 3 years from 2009 to 2012. Based upon these rankings two portfolios were formed. The first portfolio is comprised of 10 best performers and the second portfolio is comprised of 10 worst 10 performers. The “C” values, rankings and portfolio attributions are presented at Table 4.
ROA ROE CR QR DE ARE AS
2010 0,07 0,11 1,94 1,52 1,10 7,48 1,07
2011 0,08 0,05 2,03 1,56 1,51 6,83 1,22
2012 0,07 0,13 1,84 1,30 1,35 7,26 1,25
MEAN 0,07 0,10 1,94 1,46 1,32 7,19 1,18
ROA ROE CR QR DE ARE AS
2010 0,017 0,030 0,512 0,438 0,342 2,033 0,267
2011 0,021 0,071 0,640 0,584 0,586 1,885 0,316
2012 0,019 0,040 0,494 0,381 0,476 2,042 0,318
MEAN 0,019 0,047 0,548 0,467 0,468 1,987 0,300
ideal + ideal - ideal + ideal - ideal + ideal - ideal + ideal - ideal + ideal - ideal + ideal - ideal + ideal -2010 0,012 0,000 0,021 0,000 0,534 0,004 0,624 0,001 0,000 0,494 1,268 0,010 0,160 0,000 2011 0,010 0,000 0,145 0,000 1,236 0,002 1,354 0,000 0,001 1,338 1,368 0,011 0,197 0,000 2012 0,017 0,000 0,047 0,000 0,451 0,002 0,585 0,000 0,001 0,932 1,305 0,009 0,188 0,000 MEAN 0,013 0,000 0,071 0,000 0,740 0,003 0,855 0,000 0,001 0,921 1,314 0,010 0,182 0,000 ARE AS ROA ROE CR QR DE
Author's Copy
Table 4. “C” Values, Rankings and Portfolio Attributions
As table 4 shows, portfolio attributions were the same for all years and for all observations meaning that the companies in the sample were either in the first or second portfolio for all three years of the analysis which showed performance persistence. Still the same persistence was not found to be valid when within-portfolio rankings were considered. The 2011 and 2012 rankings were very similar to each other but differed from those of 2010. The best and worst performers of 2011 maintained their position also in 2012.
At the last step of the analysis portfolio returns were calculated based on individual stock returns. The weights of the stocks in the portfolio were assumed to be equal. As a result portfolio returns were calculated as simple averages of individual stock returns. The results are presented at Table 5. Table 5. Portfolio Returns
As Table 5 indicates, surprisingly the return of the portfolio two was greater than that of portfolio 1 for the years 2010 and 2011. When the mean of the three years are considered, the return of the first portfolio was one point lower than that of portfolio two, demonstrating that there was no
C (2010) Rank(2010) C (2011) Rank(2011) C (2012) Rank(2012) portfolio
firm 1 0.526 6 0.585 10 0.579 2 1 firm 2 0.509 13 0.582 16 0.552 16 2 firm 3 0.521 8 0.594 3 0.579 3 1 firm 4 0.428 19 0.575 19 0.529 18 2 firm 5 0.522 7 0.586 8 0.563 9 1 firm 6 0.531 5 0.588 5 0.565 7 1 firm 7 0.512 11 0.533 20 0.492 20 2 firm 8 0.512 10 0.597 2 0.572 5 1 firm 9 0.534 1 0.588 6 0.568 6 1 firm 10 0.449 17 0.583 13 0.558 11 2 firm 11 0.517 9 0.586 7 0.560 10 1 firm 12 0.533 3 0.585 9 0.577 4 1 firm 13 0.509 12 0.583 15 0.555 14 2 firm 14 0.502 14 0.582 17 0.541 17 2 firm 15 0.533 2 0.588 4 0.565 8 1 firm 16 0.428 20 0.584 11 0.523 19 2 firm 17 0.498 15 0.584 12 0.556 13 2 firm 18 0.452 16 0.583 14 0.554 15 2 firm 19 0.532 4 0.615 1 0.585 1 1 firm 20 0.438 18 0.581 18 0.557 12 2 portfolio 1 portfolio 2 2010 2011 2012 mean 2010 2011 2012 mean firm 1 48% 28% 23% 33% firm 2 21% 11% 56% 29% firm 3 47% 16% 15% 26% firm 4 64% -1% 16% 26% firm 5 93% 21% 128% 81% firm 7 35% -52% 54% 12% firm 6 10% -33% 8% -5% firm 10 75% 14% 55% 48% firm 8 60% -48% 42% 18% firm 13 92% 2% 45% 47% firm 9 65% -34% 9% 14% firm 14 56% -16% 41% 27% firm 11 88% -36% 25% 26% firm 16 33% -48% 22% 2% firm 12 66% -10% 54% 37% firm 17 87% 3% -4% 29% firm 15 7% 18% 8% 11% firm 18 46% 4% -27% 8% firm 19 35% -46% 43% 11% firm 20 39% 17% 37% 31%
portfolio return 52% -12% 35% 25% portfolio return 55% -7% 29% 26%
return return
relationship between financial performance indicators and stock returns hence the present firm value.
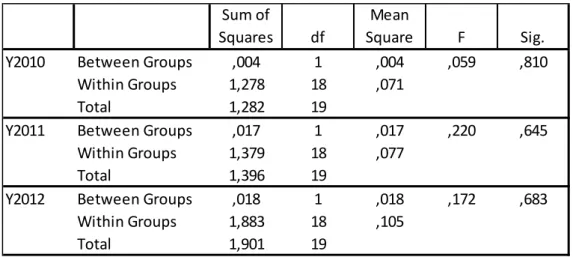
The analysis of variance test demonstrated that mean of the two portfolios was not significantly different for all three years in the analysis. The results are presented at Table 6.
Table 6. Analysis of Variance Test Results
As the Table 6 indicates the hypothesis stating that the stock returns of a portfolio composed of the shares of firms with higher financial performance are greater than those of a portfolio composed of the shares of the firms with lower financial performance was rejected.
4. Conclusion
The purpose of this analysis was to examine the relationship between financial performance indicators and stock returns. It was hypothesized that the stock returns of a portfolio composed of the shares of firms with higher financial performance are greater than those of a portfolio composed of the shares of the firms with lower financial performance Seven key financial indicators were calculated from a sample of 20 Turkish chemical industry manufacturing firms for three years from 2009 to 2012. The TOPSIS method was applied to rank the firms according to equally weighted financial indicators and based upon these rankings two portfolios were constructed. The first was comprised of the best performers and the second was comprised of the worst performers. An important finding was that all firms in the sample fell in the same portfolio for all three years in the analysis demonstrating persistence in terms of financial performances.
The computed portfolio returns revealed that the return of the second portfolio which was comprised of firms with lower financial performance indicators was higher than that of the first portfolio for two years of the analysis. Similar results were obtained when overall returns were considered. The three-year return of the second portfolio was 26 percent whereas that of the first was 25 percent. The analysis of variance test which was performed demonstrated that the mean of the two portfolios was not significantly different for any year in the analysis. Hence the single hypothesis of this study was rejected.
The results revealed that although the financial performance of the companies was persistent through the years, there wasn’t any link between financial results and firm value. It is important to
Sum of
Squares df
Mean
Square F Sig.
Y2010 Between Groups ,004 1 ,004 ,059 ,810
Within Groups 1,278 18 ,071
Total 1,282 19
Y2011 Between Groups ,017 1 ,017 ,220 ,645
Within Groups 1,379 18 ,077
Total 1,396 19
Y2012 Between Groups ,018 1 ,018 ,172 ,683
Within Groups 1,883 18 ,105
Total 1,901 19
note that due to data restrictions the analysis was limited to 20 observations and only seven ratios which represents the main limitation of this study.
References
1. BIST; Borsa İstanbul; www. Imkb.gov.tr
2. Brealey, R.A.; Myers, S.C.; Allen, F.(2011). Principles of Corporate Finance. McGraw- Hill Irwin, New York.
3. Deloitte, (2010). Turkish Chemical Industry Report. www.invest.gov.tr
4. Demireli, E.(2010). “TOPSIS Multicriteria Decision Making Method: An Examination on State Owned Commercial Banks in Turkey”. Girişimcilik ve Kalkınma Dergisi,5: 101-112
5. Erk, T. (2010). Turkish Chemical Industry. www.tobb.org.tr
6. Hwang, C.L.; Yoon, K. (1981). Multiple Attribute Decision Making: Methods and Applications. New York: Springer-Verlag.
7. Hwang, C.L.; Lai, Y.J.; Liu, T.Y. (1993). "A new approach for multiple objective decision making". Computers and Operational Research 20: 889–899
8. KAP; Public Disclosure Platform; www.kap.gov.tr
9. Uygurtürk, H.; Korkmaz,T. (2012). “The determination of Financial Performance with TOPSIS Multiple Criteria Decision Making Method: An application on Basic Metal Industry
Enterprises. Eskişehir Osmangazi Üniversitesi IIBF Dergisi, 7. 95-115
10. Weygandt J.J.; Kimmel, P.D.; Kieso D.E. (2012). Accounting Principles. John Wiley & Sons. 11. Yoon, K. (1987). "A reconciliation among discrete compromise situations". Journal of
Operational Research Society 38. pp. 277–286.
Appendix 1: Ratios RATIOS 2010 2011 2012 2010 2011 2012 2010 2011 2012 2010 2011 2012 2010 2011 2012 2010 2011 2012 2010 2011 2012 1 0,05 0,07 0,11 0,08 0,12 0,17 1,67 1,77 1,61 1,27 1,33 1,23 0,75 0,94 0,60 3,92 4,16 5,03 0,96 1,01 1,04 2 0,06 0,08 0,06 0,09 0,13 0,09 2,72 2,47 2,32 1,91 1,69 1,47 0,36 0,53 0,49 6,59 4,89 4,98 0,76 0,75 0,79 3 0,07 0,12 0,05 0,12 0,18 0,13 1,90 1,78 1,56 1,63 1,37 1,08 0,39 0,26 0,24 17,50 18,11 18,10 1,66 2,01 1,89 4 0,17 0,15 0,07 0,25 0,31 0,10 2,68 2,63 2,72 2,35 1,82 1,26 0,35 0,47 0,42 14,73 9,27 11,35 1,12 0,93 1,11 5 0,07 0,08 0,09 0,13 0,15 0,19 1,63 1,42 1,01 0,96 0,78 0,66 0,76 1,25 1,54 4,46 4,04 3,17 1,24 1,27 1,14 6 0,01 0,04 0,08 -0,00 -0,05 0,09 1,42 1,37 1,30 0,86 0,90 0,87 0,83 0,93 0,91 2,56 2,42 2,18 0,62 0,61 0,58 7 0,04 -0,00 0,07 0,02 -1,20 0,24 0,87 0,95 0,87 0,71 0,79 0,72 4,86 10,48 7,88 1,73 1,77 2,03 0,73 0,77 0,87 8 0,10 0,12 0,05 0,16 -0,00 0,10 0,55 0,39 0,39 0,23 0,11 0,12 1,29 1,23 0,79 19,00 19,00 19,00 0,74 0,83 0,91 9 0,08 0,06 0,08 0,14 0,09 0,13 1,54 1,57 1,67 1,38 1,33 1,52 1,21 1,26 1,12 1,83 1,67 1,63 0,90 0,91 0,89 10 0,03 0,09 0,10 0,05 0,19 0,13 1,74 1,69 2,23 1,23 1,12 1,56 0,87 0,96 0,57 4,80 6,14 5,67 1,58 1,89 1,95 11 0,14 0,17 0,21 0,30 0,31 0,52 0,93 1,12 1,08 0,60 0,77 0,82 1,66 1,47 1,59 4,96 3,96 5,84 0,64 0,77 1,03 12 0,09 0,09 0,14 0,15 0,14 0,19 3,44 2,38 4,70 2,51 1,54 2,58 0,35 0,59 0,26 3,92 3,70 3,19 0,67 0,68 0,91 13 0,08 0,01 0,01 0,11 -0,02 -0,03 2,87 1,84 1,61 2,37 1,23 1,13 0,42 0,62 0,70 6,79 6,00 5,49 1,35 1,66 1,47 14 0,05 0,06 -0,01 0,08 0,06 0,01 1,62 1,59 1,41 1,01 1,04 0,96 0,48 0,57 0,68 7,01 6,66 7,99 1,22 1,46 1,55 15 0,03 0,01 0,03 0,04 -0,17 0,08 1,53 1,17 1,27 1,15 0,87 0,92 1,22 1,85 1,57 1,83 2,19 2,31 0,82 0,94 0,98 16 0,04 0,05 0,05 -0,02 -0,10 0,01 1,25 1,67 1,54 0,83 1,02 0,93 2,02 2,35 2,50 14,98 13,93 12,11 2,44 2,95 2,89 17 0,09 0,08 -0,01 0,13 0,15 -0,13 1,18 1,22 1,03 0,71 0,63 0,52 1,10 1,26 1,81 7,25 5,14 4,92 1,32 1,46 1,46 18 0,07 0,11 0,09 0,11 0,23 0,13 2,09 1,96 1,70 1,69 1,61 1,33 0,54 0,53 0,43 5,96 5,14 5,69 0,70 0,71 0,83 19 0,01 0,10 0,00 0,10 0,16 0,10 6,19 10,52 5,58 6,19 10,52 5,58 0,02 0,37 0,48 7,68 6,82 5,18 0,09 0,01 0,02 20 0,06 0,11 0,07 0,19 0,28 0,30 1,05 1,08 1,14 0,83 0,64 0,74 2,57 2,35 2,50 12,00 11,47 19,31 1,88 2,76 2,75 0,07 0,08 0,07 0,11 0,05 0,13 1,94 2,03 1,84 1,52 1,56 1,30 1,10 1,51 1,35 7,48 6,83 7,26 1,07 1,22 1,25 NORMALIZED RATIOS 2010 2011 2012 2010 2011 2012 2010 2011 2012 2010 2011 2012 2010 2011 2012 2010 2011 2012 2010 2011 2012 1 0,01 0,01 0,03 0,01 0,01 0,04 0,27 0,25 0,26 0,18 0,15 0,20 0,08 0,08 0,04 0,38 0,46 0,62 0,17 0,16 0,17 2 0,01 0,01 0,01 0,01 0,01 0,01 0,73 0,48 0,55 0,42 0,25 0,29 0,02 0,02 0,02 1,07 0,63 0,61 0,11 0,09 0,10 3 0,01 0,04 0,01 0,02 0,02 0,02 0,35 0,25 0,25 0,30 0,16 0,15 0,02 0,01 0,01 7,53 8,70 8,02 0,52 0,64 0,56 4 0,08 0,06 0,01 0,11 0,07 0,01 0,70 0,54 0,75 0,63 0,28 0,21 0,02 0,02 0,02 5,34 2,28 3,15 0,23 0,14 0,19 5 0,01 0,01 0,02 0,03 0,02 0,04 0,26 0,16 0,10 0,10 0,05 0,06 0,08 0,13 0,25 0,49 0,43 0,25 0,29 0,25 0,21 6 0,00 0,00 0,02 0,00 0,00 0,01 0,20 0,15 0,17 0,08 0,07 0,10 0,10 0,07 0,09 0,16 0,16 0,12 0,07 0,06 0,05 7 0,00 0,00 0,01 0,00 1,02 0,07 0,07 0,07 0,08 0,06 0,05 0,07 3,46 9,37 6,52 0,07 0,08 0,10 0,10 0,09 0,12 8 0,03 0,03 0,01 0,04 0,00 0,01 0,03 0,01 0,02 0,01 0,00 0,00 0,24 0,13 0,07 8,88 9,57 8,84 0,10 0,11 0,13 9 0,02 0,01 0,02 0,03 0,01 0,02 0,23 0,19 0,28 0,22 0,15 0,30 0,22 0,14 0,13 0,08 0,07 0,06 0,15 0,13 0,12 10 0,00 0,02 0,02 0,00 0,02 0,02 0,30 0,22 0,50 0,17 0,11 0,32 0,11 0,08 0,03 0,57 1,00 0,79 0,47 0,57 0,60 11 0,06 0,07 0,12 0,15 0,07 0,33 0,08 0,10 0,12 0,04 0,05 0,09 0,40 0,18 0,26 0,61 0,42 0,84 0,08 0,09 0,17 12 0,02 0,02 0,05 0,04 0,01 0,05 1,16 0,44 2,24 0,72 0,20 0,88 0,02 0,03 0,01 0,38 0,36 0,25 0,08 0,07 0,13 13 0,02 0,00 0,00 0,02 0,00 0,00 0,80 0,27 0,26 0,64 0,13 0,17 0,03 0,03 0,05 1,13 0,96 0,74 0,34 0,44 0,34 14 0,01 0,01 0,00 0,01 0,00 0,00 0,26 0,20 0,20 0,12 0,09 0,12 0,03 0,03 0,05 1,21 1,18 1,56 0,28 0,34 0,38 15 0,00 0,00 0,00 0,00 0,02 0,01 0,23 0,11 0,16 0,15 0,07 0,11 0,22 0,29 0,26 0,08 0,13 0,13 0,13 0,14 0,15 16 0,00 0,01 0,01 0,00 0,01 0,00 0,15 0,22 0,24 0,08 0,09 0,11 0,60 0,47 0,66 5,52 5,14 3,59 1,12 1,38 1,32 17 0,03 0,02 0,00 0,03 0,02 0,02 0,14 0,12 0,11 0,06 0,03 0,04 0,18 0,14 0,34 1,29 0,70 0,59 0,33 0,34 0,34 18 0,01 0,03 0,02 0,02 0,04 0,02 0,43 0,30 0,29 0,33 0,22 0,23 0,04 0,02 0,02 0,87 0,70 0,79 0,09 0,08 0,11 19 0,00 0,02 0,00 0,02 0,02 0,01 3,74 8,65 3,16 4,37 9,48 4,10 0,00 0,01 0,02 1,45 1,23 0,66 0,00 0,00 0,00 20 0,01 0,03 0,01 0,06 0,06 0,11 0,11 0,09 0,13 0,08 0,04 0,07 0,96 0,47 0,66 3,54 3,49 9,13 0,66 1,21 1,19 0,02 0,02 0,02 0,03 0,07 0,04 0,51 0,64 0,49 0,44 0,58 0,38 0,34 0,59 0,48 2,03 1,89 2,04 0,27 0,32 0,32 WEIGHTED RATIOS 2010 2011 2012 2010 2011 2012 2010 2011 2012 2010 2011 2012 2010 2011 2012 2010 2011 2012 2010 2011 2012 1 0,00 0,00 0,00 0,00 0,00 0,01 0,04 0,04 0,04 0,03 0,02 0,03 0,01 0,01 0,01 0,05 0,07 0,09 0,02 0,02 0,02 2 0,00 0,00 0,00 0,00 0,00 0,00 0,10 0,07 0,08 0,06 0,04 0,04 0,00 0,00 0,00 0,15 0,09 0,09 0,02 0,01 0,01 3 0,00 0,01 0,00 0,00 0,00 0,00 0,05 0,04 0,04 0,04 0,02 0,02 0,00 0,00 0,00 1,08 1,24 1,15 0,07 0,09 0,08 4 0,01 0,01 0,00 0,02 0,01 0,00 0,10 0,08 0,11 0,09 0,04 0,03 0,00 0,00 0,00 0,76 0,33 0,45 0,03 0,02 0,03 5 0,00 0,00 0,00 0,00 0,00 0,01 0,04 0,02 0,01 0,01 0,01 0,01 0,01 0,02 0,04 0,07 0,06 0,04 0,04 0,04 0,03 6 0,00 0,00 0,00 0,00 0,00 0,00 0,03 0,02 0,02 0,01 0,01 0,01 0,01 0,01 0,01 0,02 0,02 0,02 0,01 0,01 0,01 7 0,00 0,00 0,00 0,00 0,15 0,01 0,01 0,01 0,01 0,01 0,01 0,01 0,49 1,34 0,93 0,01 0,01 0,01 0,01 0,01 0,02 8 0,00 0,00 0,00 0,01 0,00 0,00 0,00 0,00 0,00 0,00 0,00 0,00 0,03 0,02 0,01 1,27 1,37 1,26 0,01 0,02 0,02 9 0,00 0,00 0,00 0,00 0,00 0,00 0,03 0,03 0,04 0,03 0,02 0,04 0,03 0,02 0,02 0,01 0,01 0,01 0,02 0,02 0,02 10 0,00 0,00 0,00 0,00 0,00 0,00 0,04 0,03 0,07 0,02 0,02 0,05 0,02 0,01 0,00 0,08 0,14 0,11 0,07 0,08 0,09 11 0,01 0,01 0,02 0,02 0,01 0,05 0,01 0,01 0,02 0,01 0,01 0,01 0,06 0,03 0,04 0,09 0,06 0,12 0,01 0,01 0,02 12 0,00 0,00 0,01 0,01 0,00 0,01 0,17 0,06 0,32 0,10 0,03 0,13 0,00 0,00 0,00 0,05 0,05 0,04 0,01 0,01 0,02 13 0,00 0,00 0,00 0,00 0,00 0,00 0,11 0,04 0,04 0,09 0,02 0,02 0,00 0,00 0,01 0,16 0,14 0,11 0,05 0,06 0,05 14 0,00 0,00 0,00 0,00 0,00 0,00 0,04 0,03 0,03 0,02 0,01 0,02 0,00 0,00 0,01 0,17 0,17 0,22 0,04 0,05 0,05 15 0,00 0,00 0,00 0,00 0,00 0,00 0,03 0,02 0,02 0,02 0,01 0,02 0,03 0,04 0,04 0,01 0,02 0,02 0,02 0,02 0,02 16 0,00 0,00 0,00 0,00 0,00 0,00 0,02 0,03 0,03 0,01 0,01 0,02 0,09 0,07 0,09 0,79 0,73 0,51 0,16 0,20 0,19 17 0,00 0,00 0,00 0,00 0,00 0,00 0,02 0,02 0,02 0,01 0,00 0,01 0,03 0,02 0,05 0,18 0,10 0,08 0,05 0,05 0,05 18 0,00 0,00 0,00 0,00 0,01 0,00 0,06 0,04 0,04 0,05 0,03 0,03 0,01 0,00 0,00 0,12 0,10 0,11 0,01 0,01 0,02 19 0,00 0,00 0,00 0,00 0,00 0,00 0,53 1,24 0,45 0,62 1,35 0,59 0,00 0,00 0,00 0,21 0,18 0,09 0,00 0,00 0,00 20 0,00 0,00 0,00 0,01 0,01 0,02 0,02 0,01 0,02 0,01 0,01 0,01 0,14 0,07 0,09 0,51 0,50 1,30 0,09 0,17 0,17 ideal + 0,01 0,01 0,02 0,02 0,15 0,05 0,53 1,24 0,45 0,62 1,35 0,59 0,00 0,00 0,00 1,27 1,37 1,30 0,16 0,20 0,19 ideal - 0,00 0,00 0,00 0,00 0,00 0,00 0,00 0,00 0,00 0,00 0,00 0,00 0,49 1,34 0,93 0,01 0,01 0,01 0,00 0,00 0,00 AE
ROA ROE CR QR DE ARE
AE
ROA ROE CR QR DE ARE AE
ROA ROE CR QR DE ARE