SEGMENTATION BASED OTTOMAN TEXT
AND MATCHING BASED KUFIC IMAGE
ANALYSIS
a thesis
submitted to the department of computer engineering
and the graduate school of engineering and science
of bilkent university
in partial fulfillment of the requirements
for the degree of
master of science
By
Hande Adıg¨
uzel
July, 2013
I certify that I have read this thesis and that in my opinion it is fully adequate, in scope and in quality, as a thesis for the degree of Master of Science.
Asst. Prof. Dr. Pınar Duygulu S¸ahin (Advisor)
I certify that I have read this thesis and that in my opinion it is fully adequate, in scope and in quality, as a thesis for the degree of Master of Science.
Vis. Prof. Dr. Fazlı Can
I certify that I have read this thesis and that in my opinion it is fully adequate, in scope and in quality, as a thesis for the degree of Master of Science.
Asst. Prof. Dr. Sinan Kalkan
Approved for the Graduate School of Engineering and Science:
Prof. Dr. Levent Onural Director of the Graduate School
ABSTRACT
SEGMENTATION BASED OTTOMAN TEXT AND
MATCHING BASED KUFIC IMAGE ANALYSIS
Hande Adıg¨uzel
M.S. in Computer Engineering
Supervisor: Asst. Prof. Dr. Pınar Duygulu S¸ahin July, 2013
Large archives of historical documents attract many researchers from all around the world. The increasing demand to access those archives makes automatic re-trieval and recognition of historical documents crucial. Ottoman archives are one of the largest collections of historical documents. Although Ottoman is not a currently spoken language, many researchers from all around the world are in-terested in accessing the archived material. This thesis proposes two Ottoman document analysis studies; first one is a crucial pre-processing task for retrieval and recognition which is segmentation of documents. Second one is a more spe-cific retrieval and recognition problem which aims matching Islamic patterns is Kufic images. For the first segmentation task, layout, line and word segmenta-tion is studied. Layout segmentasegmenta-tion is obtained via Log-Gabor filtering. Four different algorithms are proposed for line segmentation and finally a simple mor-phological method is preferred for word segmentation. Datasets are constructed with documents from both Ottoman and other languages (English, Greek and Bangla) to test the script-independency of the methods. Experiments show that our segmentation steps give satisfactory results. The second task aims to detect Islamic patterns in Kufic images. The sub-patterns are considered as basic units and matching is used for the analysis. Graphs are preferred to represent sub-patterns where graph and sub-graph isomorphism are used for matching them. Kufic images are analyzed in three different ways. Given a query pattern, all the instances of the query can be found through retrieval. Going further, through known patterns images can be automatically labeled in the entire dataset. Fi-nally, patterns that repeat inside an image can be automatically discovered. As there is no existing Kufic dataset, a new one is constructed by collecting images from the Internet and promising results are obtained on this dataset.
Keywords: Historical Manuscripts, Ottoman Documents, Layout Segmentation, Line Segmentation, Word Segmentation, Islamic Pattern Matching.
¨
OZET
B ¨
OL ¨
UTLEME TABANLI OSMANLICA MET˙IN VE
ES
¸LES
¸T˙IRME TABANLI KUF˙I RES˙IM ANAL˙IZ˙I
Hande Adıg¨uzel
Bilgisayar M¨uhendisli˘gi, Y¨uksek Lisans Tez Y¨oneticisi: Asst. Prof. Dr. Pınar Duygulu
Temmuz, 2012
Tarihsel ar¸sivler d¨unyanın pek ¸cok yerinden akademisyenlerin ve konuyla ilgile-nen ara¸stırmacıların ilgisini ¸cekmektedir. Bu belgelere eri¸sim iste˘ginin artması otomatik eri¸sim ve tanıma sistemlerini zorunlu kılmaktadır. Osmanlıca belgeler tarihsel belgeler arasında ¨onemli ve b¨uy¨uk bir yer kaplamaktadır. Osmanlıca g¨un¨um¨uzde halen konu¸sulan bir dil olmamasına ra˘gmen bir ¸cok tarih¸cinin il-gisini ¸cekmektedir. Bu tezde de iki adet Osmanlıca belge analizi ¸calı¸sması sunulmaktadır. ˙Ilki Osmanlıca belgelerin b¨ol¨utlenmesi olup; b¨olge, satır ve ke-lime b¨ol¨utleme ¸calı¸sılmı¸stır. B¨olgelere ayırma Log-Gabor filtreleme y¨ontemi ile sa˘glanmı¸stır. Satırlara b¨ol¨utleme i¸cinse 4 farklı y¨ontem sunulmaktadır. Son olarak ise belgeler morfolojik y¨ontemler ile kelimelere ayrılmı¸stır. Veri k¨umelerine Osmanlıcanın yanında farklı dillerden olu¸san belgeler (˙Ingilizce, Yunanca ve Bangla) da eklenmi¸stir. Deneylerden elde edilen sonu¸clar b¨ol¨utleme algorit-malarının iyi ¸calı¸stı˘gını g¨ostermektedir. Tezin ikinci kısmında ise Kufi resim-lerinde ˙Islami motiflerin tespiti ama¸clanmı¸stır. Motiflerin temsili i¸cin grafikler kullanılmı¸stır. E¸syapılı grafikler ve alt¸cizgeler incelenerek motifler e¸sle¸stirilmeye ¸calı¸sılmı¸stır. Kufi imgeleri farklı deneyler ile incelenmi¸stir. ˙Ilki verilen bir sorgu motifinin veri k¨umesinden geri getirilmesidir. ˙Ikinci deney Kufi resimlerinin otomatik etiketlenmesidir. Son olarak, her resimdeki tekrarlanan motifler ince-lenmi¸stir. ˙Internet ¨uzerinden toplanan resimlerle bir veri k¨umesi olu¸sturulmu¸stur.
¨
Onerilen y¨ontem bu veri k¨umesi ile test edilmi¸s ve umut verici sonu¸clar elde edilmi¸stir.
Anahtar s¨ozc¨ukler : Tarihi Metinler, Osmanlıca Belgeler, B¨olge B¨ol¨utleme, Satır B¨ol¨utleme, Kelime B¨ol¨utleme, ˙Islami Motif E¸sle¸stirme.
Acknowledgement
First of all, I would like to express my gratitude to my supervisor Dr. Pınar Duygulu from whom I have learned a lot due to her supervision, patient guid-ance, and support during this research. Without her invaluable assistance and encouragement, this thesis would not be possible.
I am indebted to the members of my thesis committee Prof. Dr. Fazlı Can and Asst. Prof. Dr. Sinan Kalkan for accepting to review my thesis and their valuable comments.
I would like to express my special thanks to my friends Burcu and Zeren for always being so supportive and cheerful towards me.
I am thankful to all my friends from the RETINA group especially Fadime, Nermin, Gokhan, Sermetcan and Caner. Conference days or Quick China meet-ings would not be so memorable and enjoying without them.
The biggest of my love goes to my beloved family, for their endless support and love. None of this would be possible without them.
Contents
1 Introduction 1
2 Segmentation of Ottoman Documents 4
2.1 Motivation . . . 4 2.2 Related Work . . . 7 2.3 Methodology . . . 9 2.3.1 Pre-processing . . . 10 2.3.2 Layout Segmentation . . . 11 2.3.3 Line Segmentation . . . 19 2.3.4 Word Segmentation . . . 29 3 Segmentation Experiments 32 3.1 Dataset Descriptions . . . 32
3.1.1 Ottoman Dataset with Multi-Oriented Lines . . . 32
3.1.2 Ottoman Dataset with Similarly Oriented Lines . . . 33
3.1.3 ICDAR Dataset . . . 34
3.2 Evaluation Strategies . . . 34
3.3 Experiments and Discussion . . . 36
3.3.1 Ottoman Document Segmentation Experiments . . . 36
3.3.2 Script-Independent Document Segmentation Experiments . 42 4 Matching Islamic Patterns in Kufic Images 49 4.1 Motivation . . . 49
4.2 Challenges in Kufic patterns . . . 51
4.3 Related work . . . 53
CONTENTS vii
4.4.1 Extraction of foreground pixels . . . 56
4.4.2 Extraction and labeling of sub-patterns . . . 57
4.4.3 Sub-pattern matching . . . 60
5 Kufic Pattern Matching Experiments 65 5.1 Dataset Description . . . 65
5.2 Other Approaches . . . 66
5.2.1 Profile based features with DTW matching . . . 66
5.2.2 Sequence matching based on contour representation . . . . 67
5.3 Experiments . . . 69
5.3.1 Query retrieval . . . 70
5.3.2 Image indexing . . . 74
5.3.3 Repeating pattern detection . . . 75
5.4 Discussion . . . 76
6 Conclusion 77
List of Figures
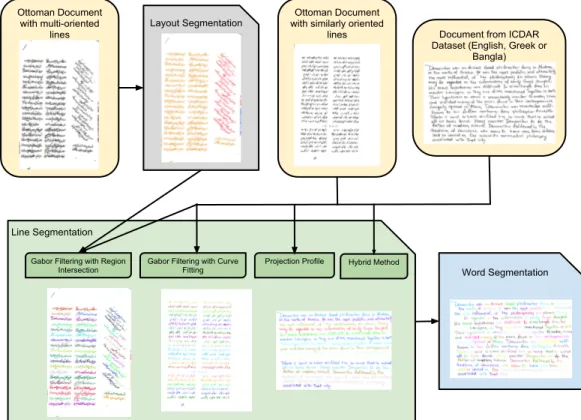
2.1 The overall organization of our segmentation system. . . 6 2.2 (a) and (c): Some examples from the historical degraded
docu-ments, the ink is faded, paper is stained and the images are noisy; (b) and (d): Adaptive binarization manages to overcome those difficulties. . . 11 2.3 A binarized document with multi-oriented lines. . . 13 2.4 A bank of Log-Gabor filters with 4 different orientation and scales
for a minimum wavelength of 40 and scaling factor of 2. . . 14 2.5 Convolution response images to Log-Gabor filters with 4 different
orientations. Only a single scale is shown here. . . 15
2.6 (a) Response image constructed from 4 ∗ 4 Gabor
filter-ing results with findfilter-ing the maximum response for each cell (ResponseImage). (b) Region image with cells tagged with 4 possible values indicating orientations computed from maximum responses of different filters (RegionImage). . . 16
2.7 (a) BoundaryImage combined with the RegionImage showing
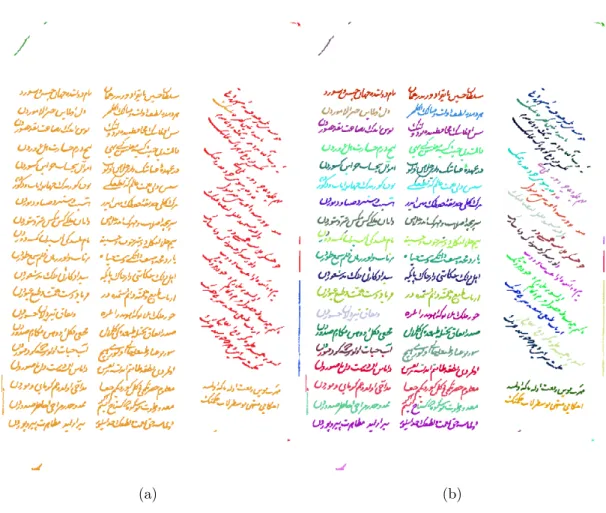
approximate line boundaries with orientation tags. (b) Post-processed image of (a). . . 17 2.8 (a) Layout segmentation result. (b) Line segmentation result. . . 18 2.9 (a) Binarized document image, (b) image without small-sized
com-ponents. . . 21 2.10 Procedure of extracting baseline pixels. (a) connected component,
(b) contour image, (c) left-to-right, (d) right-to-left, (e) bottom-to-top gradient images, (f) approximate baseline pixels, (g) exact baseline pixels. . . 22
LIST OF FIGURES ix
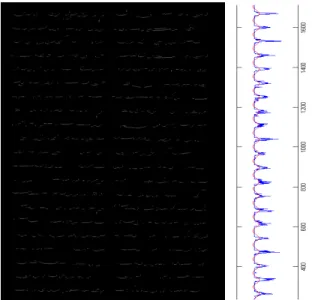
2.11 Left part shows the image reconstructed from the baseline pixels of connected components, right part is the vertical projection profile of the reconstructed image. A Fourier curve is fitted to the projection. 22 2.12 (a) Approximation of interline gaps, (b) computed baselines. . . . 23 2.13 (a) Original binary image to be line segmented. (b) Pre-processing
applied to (a) with processes: morphological operations, small sized connected component removal and extreme smoothing. . . . 25 2.14 Image constructed from the baselines of connected components. . 26 2.15 Approximate line boundaries computed by binarizing the
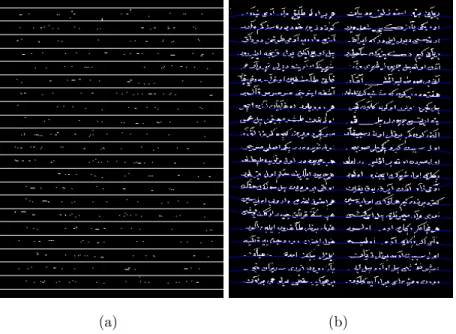
maxi-mum convolution response. . . 27 2.16 (a) Intersection of line boundaries with ink pixels is visualized. (b)
Final line segmentation result. . . 28 2.17 Baselines shown on the original binary image, computed by fitting
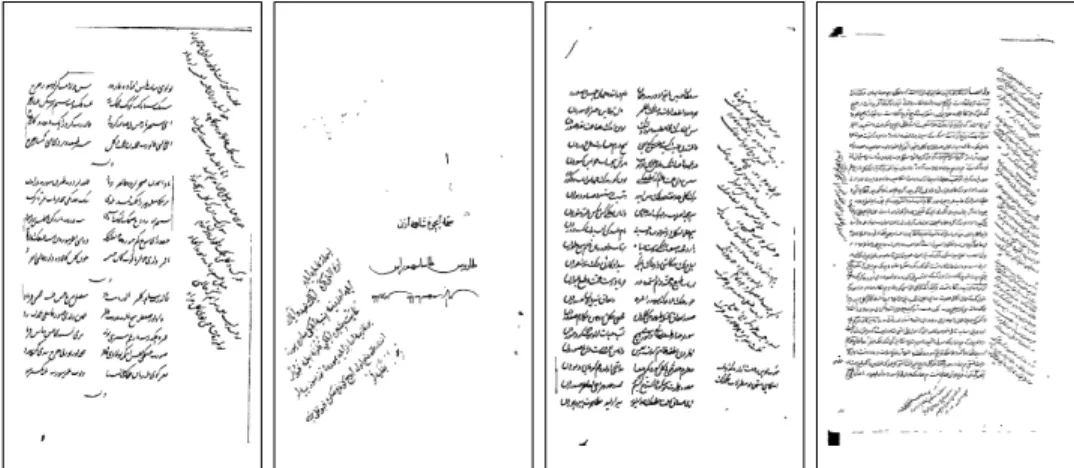
lines to line boundaries. . . 29 2.18 Example page in Ottoman. . . 30 2.19 Word segmentation result for a Greek document. . . 31
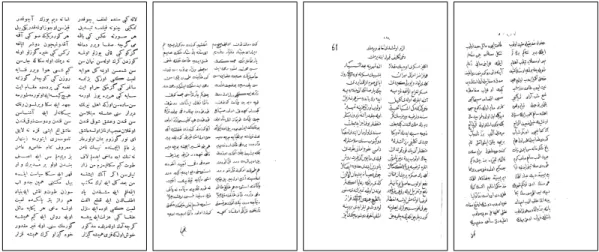
3.1 Example images from the first Ottoman dataset with
multi-oriented lines. . . 32 3.2 Example images from the second Ottoman dataset with similarly
oriented lines. The leftmost one is printed while the others are handwritten. . . 33
3.3 Example images from the ICDAR dataset combined with Ottoman
documents. From left to right: English, Greek, Bangla and Ot-toman document. . . 34 3.4 (a) Ground truth. (b) Segmentation result. (c) Matchscore table. 35 3.5 Layout segmentation results. . . 37 3.6 Layout segmentation errors showed with black circles. (a) Type
1 error caused by small regions. (b) and (c) Type 2 error caused by closely located components. (d) Type 3 error caused by shape illusions. . . 38 3.7 Line segmentation results of Ottoman dataset with multi-oriented
LIST OF FIGURES x
3.8 Line segmentation results of the hybrid method applied to Ot-toman dataset with similarly oriented lines. . . 42 3.9 Line segmentation results of 4 methods categorized according to
languages. PP: Projection Profile, HM: Hybrid Method, GFRI: Gabor Filtering with Region Intersection, GFLF: Gabor Filtering with Line Fitting. . . 44 3.10 Line segmentation results of 4 methods for the whole dataset. PP:
Projection Profile, HM: Hybrid Method, GFRI: Gabor Filtering with Region Intersection, GFLF: Gabor Filtering with Line Fit-ting. . . 44 3.11 Line segmentation results of GFRI: Gabor filtering with region
intersection for Greek, Bangla, English and Ottoman documents. 46 3.12 Word segmentation results. From top row to bottom row: English,
Greek and Bangla documents. . . 48 4.1 Some decorative Kufic patterns. Left: Gudi Khatun Mausoleum in
Karabaghlar, Azerbaijan, 1335-1338 (Image taken from [1]). Mid-dle: Coin of the Hafsids, with ornamental Kufic script, from Bejaia, 1249-1276 (Image taken from [2]). Right: Tombstone of Abbas, with floriated Kufic, 9th century (Image taken from [3]). . . 50 4.2 Square Kufic script letters. Note that, due to the nature of Arabic,
the same character may have different shapes, depending on its position within the sentence. Characters may also have different shapes in different designs. (Image courtesy of [4]) . . . 52 4.3 The same sub-words in different shapes and different sub-words
in similar shapes. In the first two images, the gray (sub-pattern lillah), light gray (sub-pattern la) and lighter gray sub-patterns have different shapes in both designs. For example, the gray ones are different designs of the letter La. In the last image, the gray (sub-pattern lillah), light gray and lighter gray ones are different sub-patterns but they share similar shapes. . . 53 4.4 The overall organization of our system. . . 55
LIST OF FIGURES xi
4.5 Top (a-d): Example Kufic images, bottom (e-h): their correspond-ing color histograms. As can be seen from the color histograms (a) and (b) has a few distinct colors, while the degradation in (c) and (d) result in multiple colors. . . 56 4.6 Some square Kufic images with Allah patterns are shown in red
(gray). Note that this word has different shapes in different designs (Images 1,2,3 are taken from [4], 4-10 and 12 from [5]). . . 58 4.7 The patterns in green (light gray) are Resul patterns, which are
formed by three sub-patterns. The red (gray) sub-patterns are from the La ilaha illa Allah pattern. The last image contains four Resul patterns at each corner (First image is taken from [6] and second one is from [1] and third-fourth ones are from [7]). . . 58 4.8 The patterns in red (gray) are La ilaha illa Allah. The green (light
gray) patterns are Resul patterns and note that the last one’s two sub-patterns are connected. In the first image, first black pattern is Allah, while second black one is Muhammed and in the second image first black sub-pattern is Muhammed, while the second one is Allah and the same for the third image. (The first and second images are taken from [7] and the third from [1]). . . 59 4.9 16 sample images from su sub-pattern. This is the middle
compo-nent of the word Resul. . . 60 4.10 Junction and end points of some example sub-patterns. . . 61 4.11 (a) An example sub-pattern (b) the sub-pattern’s graph (c) matrix
that represents the undirected, non-weighted graph . . . 62 4.12 Example sub-patterns with their graph representations, the graph
pairs are isomorphic. (a) La sub-pattern (b) Lillah sub-pattern (c) Muhammed sub-pattern . . . 63 4.13 Example sub-patterns with their graph representations. Although
the pairs are same sub-patterns their graphs are not isomorphic. (a) and (b) Leh sub-pattern (c) and (d) Su sub-pattern . . . 63
LIST OF FIGURES xii
5.1 Some example square Kufic images. On the first row, the 4th image from the left has four Allah and Muhammed patterns, while the 5th image has four Masaallah patterns. Note that in the second row, the 2nd and 5th images have very small sub-patterns and their outer contours also form Allah patterns. The 3rd and 6th images in the second row have patterns which have some zig-zags on the contours, which make line extraction process difficult. On the first row, the 1st,4th,5th and 6th images are from [7], the 2nd image is from [6], and the 3rd image is from [8]. The second row images are from [1]. . . 66 5.2 (a) and (b) Two Allah patterns in different shapes and the outputs
of the line simplification process. Start-end points of lines are shown with small slashes. The chain code representation of sub-pattern A is 0246424642460646, B is 0246, C is 02465324653246 and D is 0246. (c) Output of the string matching algorithm for sub-patterns A-C and B-D. (The images are taken from [9]) . . . 68 5.3 This Figure shows average TPR vs FPR results for all types of
query patterns in dataset. Results show that sequence matching is good at finding instances of a pattern but it can not easily eliminate false matches, while graph matching can discriminate false matches. 71 5.4 Connected pattern examples that our sequence matching method
can not detect (The images are taken from [7]). . . 72 5.5 Connected pattern detection experiment results by graph matching. 73 5.6 Repeating pattern examples (The images are taken from [1]). . . . 75
5.7 Muhammed patterns in different formats that our proposed
List of Tables
3.1 Results obtained with different printed and handwritten datasets with different writing styles and writers. . . 40 3.2 Results obtained on 6 different handwritten books with MS
thresh-old of 0.95. . . 40 3.3 Results obtained on 6 different handwritten books with MS
thresh-old of 0.90. . . 41 3.4 Results obtained on 2 different printed and handwritten datasets
with MS threshold of 0.95. . . 41 3.5 Results obtained on 2 different printed and handwritten datasets
with MS threshold of 0.90. . . 42 3.6 Line segmentation results of GFRI: Gabor Filtering with Region
Intersection method categorized by languages. M S − T hreshold is taken as 0.90. . . 45 3.7 Word segmentation results categorized by languages. . . 47 4.1 Number of components per class and number of images where these
patterns are found. Note that an image may contain more than a single labeled pattern. . . 60 5.1 Comparison of three methods on query retrieval based on Area
Under ROC Curve (AUC) and F1 values. . . 71 5.2 Recall and precision values of query retrieval task performed by
two different approaches: sequence matching and Graph matching. 72 5.3 10-fold cross validation, graph isomorphism accuracy results for
LIST OF TABLES xiv
5.4 Image categorization success rates with line and graph matching methods. Graph matching method again outperforms sequence matching method. . . 74
5.5 Repeating pattern detection by sequence matching and graph
matching methods. We didn’t provide results for La ilaha illa Al-lah, because at most only one instance of that pattern in images, which makes it non-repeating pattern. . . 75
Chapter 1
Introduction
Historical documents constitute a large heritage that needs to be preserved. Many researchers from all around the world are interested in accessing, analyzing and studying them. Ottoman archives are one of the largest collections of historical documents; they include more than 150 million documents ranging from military reports to economic and political correspondences belonging to the Ottoman era [10]. Ottoman empire, which had lasted for more than 6 centuries and spread over 3 continents, shaped the history of the old world for several countries [9]. Although Ottoman is not a currently spoken language, many researchers from all around the world are interested in accessing the archived material.
Until recently, access to historical documents were provided only by manual indexing which can be considered costly because excessive amount of human effort is required. Lately, digital environments became available for keeping historical documents in image format. After this technological progress, demand to access digital historical archives has been increased. To make the historical contents available, automatic indexing and retrieval systems are required. Since, most of the historical documents are kept in image format, analyzing their visual content is suggested to build automatic systems.
Optical character recognition (OCR) can be used to provide automatic docu-ment indexing and retrieval [11, 12, 13, 14]. However, applying OCR techniques on old historical documents is nearly impossible because of the poor quality of the documents, the variety of scripts and the high-level noise factors like faded ink and stained paper caused by deterioration. Moreover, existing OCR systems
are language dependent and not available for every language. Thus, retrieval and indexing of historical documents problems are usually solved by word spotting approaches [15, 16, 17].
As a pre-processing step, segmentation provides several benefits for retrieval and indexing tasks by supporting fast and easy navigation. In the first part of this thesis, segmentation of Ottoman documents is studied. First layout segmen-tation which aims to detect regions consisting of text lines written with different orientations is explored. A Log-Gabor filtering based approach is used to segment documents with multi-oriented lines. Experiments are performed on an Ottoman dataset constructed with documents with multi-oriented lines.
The second segmentation task is line segmentation where four different ap-proaches are proposed. The first one is a traditional line segmentation method, called projection profile, used for printed documents with straight lines and it is used as a baseline system. The second method is a hybrid line segmentation, com-bining projection profile and connected component based methods. This method is proposed for segmenting lines from Ottoman documents. The last 2 methods are based on Log-Gabor filtering like the layout segmentation and they support script independency. The first one uses region intersection while line fitting is preferred for the second one.
The hybrid line segmentation method is tested on both printed and handwrit-ten Ottoman documents to compare the algorithm’s performance for different type of texts. Also, another handwritten Ottoman dataset is constructed with different books and authors to evaluate the performance under different writing styles and writers. The four line segmentation methods are tested and compared on a mixed dataset including Ottoman, English, Greek and Bangla documents.
The last segmentation task is word segmentation where a simple morpholog-ical method is applied. The tests are performed on English, Greek and Bangla documents. Ottoman word segmentation is not in our study’s scope because it can be only performed by language based rules which requires Ottoman language experts.
The second part of this thesis concentrates on Islamic pattern matching in Kufic images. The approach involves four main steps: (i) foreground extraction, (ii) sub-pattern extraction, (iii) representation and matching, (iv) analysis. The
sub-patterns are considered as basic units and extracted connected components are used as sub-patterns. The relationships between straight lines in specific orientations are observed and thought to be important for the identification of Kufic patterns. Based on this observation, a line-based method for representing and matching sub-patterns is proposed. Each sub-pattern is represented with a graph and then graph and sub-graph isomorphism are applied to match the patterns.
Sub-pattern matching is used for the analysis of Kufic images in three different ways. Given a query pattern, all the instances can be found through retrieval. Going further, through known patterns images can be automatically labeled in the entire dataset. Finally, patterns that repeat inside an image can be automatically discovered.
The rest of the thesis is arranged as follows. First segmentation of documents is explained in the order: layout, line and word segmentation. Line segmentation section is divided into four, where each section explains a different algorithm. Afterwards, the segmentation experiments are given; first one is Ottoman doc-ument segmentation where layout and line segmentation results are discussed for Ottoman documents. Second experiment section is script-independent seg-mentation where line and word segseg-mentation results for different languages are given.
Second part of the thesis focuses on matching Islamic patterns in Kufic images. First, extraction of foreground pixels and labeling of sub-patterns is explained. Then in the next section, graph isomorphism is proposed for sub-pattern match-ing. Finally, analysis is done with three different experiments; query retrieval, image indexing and repeating pattern detection.
Chapter 2
Segmentation of Ottoman
Documents
2.1
Motivation
Large archives of historical documents attract many researchers from all around the world. The increasing demand to access those archives makes automatic re-trieval and recognition of these documents crucial. Ottoman archives are one of the largest collections of historical documents; they include more than 150 million documents ranging from military reports to economic and political corre-spondences belonging to the Ottoman era [10]. Researchers from all around the world are interested in accessing the archived material [18]. Unfortunately, many documents are in poor condition due to age or recorded in manuscript format.
Line segmentation is usually a crucial pre-processing step in most of the docu-ment analysis systems. Although text line segdocu-mentation is a long standing prob-lem, it is still challenging for hand-written degraded documents. The problems of handwritten texts can be categorized into 2 parts: (i) line-based problems such as, variance of interline distances, inconsistent baseline skews, multi-oriented text lines and high degrees of curl; and (ii) character-based problems such as, broken characters due to degradation, touching and overlapping text lines, small-sized diacritical components, noisy components like ornamentation and variance of character size.
for complex datasets, the studies in text line segmentation are dominated by projection profile and connected component-based approaches. Projection profile based methods are usually successful on machine printed documents [24], never-theless, they can be extended to deal with slightly curved text lines [23]. Besides, projection profile based methods are easy to implement and fast thru the basic intuition of straightness of text lines.
Connected component based methods are appropriate for more complex doc-uments where interline distances and baseline skews change. However, most of the connected component based methods work directly on the input image where each pixel is treated equally and a change of one pixel may result in a different result [23].
In this study, we first propose a layout segmentation algorithm based on Log-Gabor filtering to obtain line segmentation for documents with multi-oriented lines. First, the document image is convolved with a Log-Gabor filter bank with different scales and orientations and then the convolution results are divided into cells and maximum Gabor response per cell is computed.
Secondly, four different line segmentation algorithms are explained. First one is based on vertical projection profile which is used as a baseline system. Second one is a new segmentation algorithm where we use a hybrid approach which combines both connected components and projection information. Rather than obtaining the projection profile directly from the input image or straightly using connected components for line detection, baselines of connected components are extracted and passed to second phase where projection profiles are used. This process also allows some skew tolerance.
The last two line segmentation algorithms are based on Log-Gabor filtering like the layout segmentation algorithm. Firstly, document image is pre-processed to suppress language based characteristics and emphasize the line structure. Then pre-processed image is convolved with different Log-Gabor filters with different scales to detect the correct character scale. Afterwards, convolution result is binarized to obtain the line regions. The first algorithm intersects connected components with detected regions while the other one fits lines to boundaries and computes the closest baseline for each component.
Figure 2.1 shows the overall system design. Ottoman Document with multi-oriented lines Layout Segmentation Word Segmentation Projection Profile Gabor Filtering with Curve
Fitting Gabor Filtering with Region
Intersection
Hybrid Method
Ottoman Document with similarly oriented
lines Document from ICDAR Dataset (English, Greek or
Bangla)
Line Segmentation
Figure 2.1: The overall organization of our segmentation system.
The contributions of this study are threefold. First we address the layout and line segmentation problem for historical Ottoman documents which are rarely studied. We intend to apply our method to considerably large and complex his-torical datasets with multiple authors from various time periods including doc-uments with multi-oriented lines. To achieve a simple but effective line segmen-tation method, bottlenecks of projection profile based and connected component based methods are prevented through a hybrid approach. Second, Fourier curve fitting is suggested for determining the peaks and valleys in projection profile analysis which is still considered as a problematic issue [23]. Additionally, script independent line segmentation and words segmentation methods are proposed. As far as we know, our study is the first one to use Gabor filtering for the text line segmentation problem.
2.2
Related Work
Text line segmentation algorithms can be mainly categorized as projection profile based [24, 25] and connected component based [26, 27]. Projection based methods makes the assumption of text lines being parallel and straight thus, they are effective for machine printed documents.
For handwritten documents where interline gaps are small or lines have con-siderably high skew, piece-wise projection approaches are used [25]. In these ap-proaches documents are divided into vertical strips and vertical projection profiles of strips are combined to obtain the results.
Connected component based methods [26, 27] extracts geometrical informa-tion such as shape, orientainforma-tion, posiinforma-tion and size from connected components to group or merge them into lines. They are more appropriate for complex docu-ments than the projection profile based methods. However, they are sensitive to small changes in connected component structures. Another disadvantage is that they may be script dependent. For example, there is a space between neighboring words in English, but a Chinese text line is composed of a string of characters without word spaces [28].
There are also studies which propose script-independent line segmentation methods with deformable models [20, 22, 28]. The paper [28] first enhances text line structure using Gaussian window and then uses level set method to evolve text line boundaries. With the prior knowledge that a text line is a horizontally elongated shape, the text line boundaries are forced to grow faster in the hori-zontal direction. However, the approach is sensitive to the number of level set evolution iterations.
Another study that segments lines with deformable models is [20], which uses the Mumford-Shah Model. The approaches presented in [20, 28], depend on skew-correction and zone segmentation before text line segmentation. Also, they are sensitive to large number of touching and overlapping components and they use heuristic post-processing rules for splitting and joining segmented text lines to handle these cases [22].
The authors of the paper [22] solve these problems by using active contours to detect curved lines. First, snakes are deformed in horizontal direction and then
neighboring baby snakes are joined together. Since, they preferred to use image smoothing using multi-oriented Gaussian filters that enhance the line structure even on high curvature; the algorithm does not depend on skew correction or zone segmentation.
Another script-independent line segmentation study is [29]. In this study, text line segmentation is achieved by applying Hough transform on a subset of the document image connected components. A post-processing step includes the correction of possible false alarms, the detection of text lines that Hough trans-form failed to create and finally the efficient separation of vertically connected characters using a novel method based on skeletonization. Although, Hough-based methods can handle documents with variation in the skew angle between text lines, they are not very effective when the skew of a text line varies along its width [30].
There are few studies [10, 31] that apply line segmentation on Ottoman datasets. In [10], it is assumed that baselines will have more number of black pix-els than the other rows. With this intuition projection profile of the documents are analyzed and peaks of the profile are detected according to some predefined threshold. However, due to inconsistent baseline skews, multi-oriented text lines and small interline gaps observed in Ottoman documents; directly applying pro-jection profile method is likely to fail. Further, different threshold values need to be set for different types of writing styles or writers.
Another study that demonstrate their results on Ottoman documents, con-structs a Repulsive-Attractive Network for line segmentation [31]. In this net-work, attractive and repulsive forces are defined and baseline units’ y-coordinates are iteratively changed according to these forces until local convergence is ob-tained. Nevertheless, the lines must have similar lengths and each baseline is detected according to previously examined one where a detection error can trig-ger other ones.
There are also papers which work on line segmentation of documents with multi-oriented lines [22, 32, 33, 34]. In paper [34], multi-oriented text line extrac-tion from handwritten Arabic documents is studied. The local orientaextrac-tions are determined using small windows obtained by image paving. The orientation of the text within each window is estimated using the projection profile technique
considering several projection angles.
Another study [32] focuses on multi-oriented line segmentation on English documents. Their method is based on foreground and background information of the characters of the text. In the proposed scheme at first, individual components are detected and grouped into 3-character clusters using their inter-component distance, size and positional information. Then clusters are merged to obtain individual lines. Another study that segments multi-oriented text lines [33], uses a similar strategy of clustering connected components. First they obtain word groups from the clusters and then, text lines of arbitrary orientation are seg-mented from the estimation of these word groups.
Word segmentation is applied on Ottoman documents in a few studies [9, 10]. In [9] a version of a document, in which word segmentation is easy, is used as a source data set and another version in a different writing style, which is more difficult to segment into words, is used as a target data set. The source data set is segmented into words by a simple method and extracted words are used as queries to be spotted in the target data set. In [10] a more simpler method is preferred. To find the boundaries between the words, they apply a threshold value on the length of the space in between the words.
There are also statistical methods for word segmentation [35, 36, 37, 38]. However, they are usually preferred for Chinese documents where sentences are written as characters strings with no spaces between 2-character words. Thus, statistical features that capture the dependency among connected components of a word such as mutual information and context dependency are used to extract words.
2.3
Methodology
Our segmentation process consists of four main tasks whose details are given in the following sections. First, pre-processing of documents is explained which consists of binarization, simple repairment and page segmentation steps. These steps are only applied to Ottoman documents. ICDAR dataset which consists of English, Greek and Bangla documents were already binarized and page segmented when it was obtained.
The second task is layout segmentation, which is applied to Ottoman docu-ments that include multi-oriented text lines in a single page. Within the layout segmentation, how to segment lines from documents with multi-oriented lines is also explained.
The third task is line segmentation, where we present 4 different approaches. First one being projection profile is a traditional method which we use as a base-line system. Second method is a hybrid base-line segmentation, combining projection profile and connected component based methods. This method is proposed for segmenting lines from Ottoman documents. Third and fourth line segmentation methods are designed for script-independent documents and both of them are based on Gabor filtering, first one uses region intersection while line fitting is preferred for the second one.
The last segmentation task is word segmentation where we apply a simple morphological method whose parameters are optimized based on simple charac-teristics of different languages. Ottoman word segmentation is not in our study’s scope because of the fact that it can be only done by language based rules which requires Ottoman language experts.
2.3.1
Pre-processing
Binarization is one of the important pre-processing steps of segmentation. Global binarization methods use a single threshold value to classify pixels into foreground or background classes. However, they do not always yield satisfactory results es-pecially on historical documents that are degraded, deformed and not in good quality due to faded ink and stained paper and may be noisy because of deterio-ration (see Figure 2.2 (a) and (c)).
After the original documents are converted into gray scale, adaptive binariza-tion method [39], which calculates multiple threshold values according to the local areas, is used for binarization (see Figure 2.2 (b) and (d)). Then, small noise such as dots and other blobs are cleaned by removing connected components which are smaller than a predefined threshold.
(a) (b)
(c) (d)
Figure 2.2: (a) and (c): Some examples from the historical degraded documents, the ink is faded, paper is stained and the images are noisy; (b) and (d): Adaptive binarization manages to overcome those difficulties.
After binarization, to connect broken characters; first Manhattan distance between adjacent foreground pixels are calculated then pixels are connected if the measured distance is smaller than a predefined threshold.
The documents in our datasets are scanned in 2-page format. Therefore, before segmentation documents must be segmented into pages. The horizontal projection profile of each document is calculated and then the two largest peaks of the profile are observed for segmenting the two pages. To detect the widest peaks, a Fourier curve [40] is fitted to the horizontal projection profile and then the image is cropped according to the smallest value of the profile that lie between the two peaks.
2.3.2
Layout Segmentation
For layout segmentation task we preferred to use Gabor filters to detect regions which include similarly oriented lines. Gabor filtering, which is named after Denis Gabor is basically a linear filter used to detect edges [41]. Besides, the theory pro-posed in [42] explains that the retinal image is decompro-posed to a number of filtered images with different sizes and orientations in the human visual system. This the-ory indicates that Gabor functions are similar to perception in the human visual system and thus, Gabor filters are found to be appropriate for texture represen-tation, optical character recognition, iris recognition and fingerprint recognition
[41].
A Gabor filter is a Gaussian Kernel function multiplied by a complex sinusoid which are known as the envelope and the carrier respectively. The formula of a complex Gabor function in space domain is [43]:
g(x, y) = s(x, y)wr(x, y); (2.1)
where s(x, y) is a complex sinusoid, and wr(x, y) is a 2-D Gaussian-shaped
func-tion. The complex sinusoid is defined as follows:
s(x, y) = exp(j(2π(u0x + v0y) + P )); (2.2)
where (u0, v0) and P define the spatial frequency and the phase of the sinusoid
respectively. This sinusoid can be thought as two separate components, conve-niently allocated in the real and imaginary part of a complex function. Besides, the two components may be formed into a complex number or used individually [41].
The Gaussian envelope is as follows:
wr(x, y) = Kexp(−π(a2(x − x0)2r+ b2(y − y0)2r)); (2.3)
where K scales the magnitude of the Gaussian envelope, (x0, y0) is the peak of
the function, a and b are scaling parameters of the Gaussian, and the r subscript stands for a rotation operation.
For segmentation tasks usually a Gabor filter bank is constructed with filters of different scales and orientations. Then the filters are convolved with the image and the response in Gabor space is analyzed. This process is very similar to the process in the human primary visual cortex [44]. Another study [45] proposes that the real parts of the Gabor function is a good approximation of a receptive function belonging to cats’ striate cortex. For our study, we adapt a similar process of constructing a Gabor filter bank and analyzing the real components of different responses generated by Gabor filters with different orientations and scales.
eliminates some traditional disadvantages such as DC-bias. They are basically constructed with the logarithmic transformation of the Gabor domain.
Firstly for a binarized document (see Figure 2.3), connected components are extracted and average connected component height (avgH) is found. This metric is used as a parameter for the wavelet scale of the Gabor filter. Then, the binary image is convolved with a bank of Log-Gabor filters with 4 orientations and 4 scales, resulting in 16 different filters (see Figure 2.4). Peter Kovesi’s Gabor Convolve software is used for the convolution task 1. The filters with different
orientations are used to detect the text line regions with different orientations and different scales are used to obtain accurate results for the documents which has characters with varying sizes.
Figure 2.3: A binarized document with multi-oriented lines.
1
1 2 3 4 1 2 4 3 Orientation Scale
Figure 2.4: A bank of Log-Gabor filters with 4 different orientation and scales for a minimum wavelength of 40 and scaling factor of 2.
The wavelength of the smallest scale filter is set to half of the average con-nected component height (avgH/2) and the scaling factor between successive fil-ters is set to 2, which results in filfil-ters with scales avgH/2, avgH, 2avgH, 4avgH. The ratio of the standard deviation of the Gaussian describing the log-Gabor filter’s transfer function in the frequency domain to the filter center frequency is set to 0.65 and the ratio of angular interval between filter orientations and the standard deviation of the angular Gaussian function used to construct filters in the frequency plane is set to 1, 3. Figure 2.5 shows the real part of the convolution responses to Log-Gabor filters of 4 orientations and a single scale.
Figure 2.5: Convolution response images to Log-Gabor filters with 4 different orientations. Only a single scale is shown here.
Afterwards, an empty image is constructed with the same size as the original image and it is divided into n ∗ m cells. For each cell, the maximum convolution response that reside in the same location in 16 response images is extracted which makes 16 responses for each cell grid. To compute the maximum of these 16 responses, the result of convolving with the even symmetric filter, which are the real components; are summed and then sorted. After the maximum sum is found, the cell is assigned to the response which was extracted as a grid from the response image. Figure 2.6 (a) shows an example image obtained with this approach.
Besides, each maximum response’s orientation is saved and each cell is tagged with that orientation. Figure 2.6 (b) shows an example image with 10 ∗ 10 cells, each tagged with 4 possible different orientations. As a result, two images are constructed from different Log-Gabor filters, resulting one with responses (ResponseImage) and the other with regions (RegionImage) tagged with inte-gers indicating different orientations (see Figure 2.6).
(a) (b)
Figure 2.6: (a) Response image constructed from 4 ∗ 4 Gabor filtering results with finding the maximum response for each cell (ResponseImage). (b) Region image with cells tagged with 4 possible values indicating orientations computed from maximum responses of different filters (RegionImage).
Afterwards, to detect the approximation of the line boundaries, binarization is applied to the computed response image (RI). A predefined threshold is used for binarization, which is max(ResponseImage)/10. The resulting image indi-cates the approximate of line boundaries, where boundaries are tagged as 1 and background pixels are tagged as 0 (BoundaryImage).
To approximately find the regions which have differently oriented lines, the BoundaryImage computed from the ResponseImage is combined with the RegionImage. Each pixel of the binary image with the value 1, is assigned to the value of the pixel which is at the same location in RegionImage. Figure 2.7 (a) shows the resulting image.
(a) (b)
Figure 2.7: (a) BoundaryImage combined with the RegionImage showing
approximate line boundaries with orientation tags. (b) Post-processed image of (a).
After this step, post-processing is applied to correct some results. Firstly, connected components that have multiple orientation tags are found and if the ratio of the pixels with different values are lower than 50%, the pixel group which are the minority are assigned to the majority pixels’ value. The reason we are using a threshold like 50% is to eliminate assigning a connected component to a single orientation while it contains multiple regions. Figure 2.7 b shows the resulting post-processed image.
To segment the image, we prefer tagging each connected component with a value indicating the orientation of the line that it belongs. To obtain this, first we intersect the original binary image with the image that indicates boundaries with orientations. The ink pixels intersecting with a boundary are tagged with the boundary’s orientation. There remains some ink pixels in the original image which do not intersect with any of the boundaries. Thus, we find those pixels and for each of them, we count the votes using a grid whose size is predefined and
centered on the pixel. Therefore, each unassigned pixel is tagged with a value indicating the orientation.
Final step is computing the majority of the tags for each connected nent. What we mean by this statement is that, sometimes connected compo-nents of the original image are assigned to multiple tags cause they were partly intersecting with multiple boundaries. A similar approach we explained in the post-processing step is used except there is no threshold. Thus, all connected components of the original image are assigned to single values. Figure 2.8 a shows the result of layout segmentation.
(a) (b)
Figure 2.8: (a) Layout segmentation result. (b) Line segmentation result.
Line segmentation of these kind of documents, documents that include multi-oriented lines, can be done in a very similar approach to layout segmentation.
Instead of assigning orientations to line boundaries which is computed by bi-narizing the maximum Gabor response per cell, each line boundary can have a different tag indicating the line identification number. Similar post-processing techniques can be used such as using voting for correcting the boundary tags or connected component tags. Figure 2.8 b shows an example line segmentation result done in a similar fashion.
2.3.3
Line Segmentation
We propose 4 different line segmentation algorithms. First one is projection profile, which is a traditional line segmentation method generally preferred for printed documents with straight lines. Second one is a new method that we designed specifically for Ottoman documents which uses advantages of both pro-jection profile and connected component based methods. Third and fourth algo-rithms are based on Gabor filtering where the first one uses region intersection after the line boundaries are extracted, while the other one fits lines to bound-aries as baselines. These 2 algorithms were designed so that they will suppress language based features and emphasize the line structure and because of these characteristics they prove to be successful on script-independent documents.
2.3.3.1 Projection Profile
Projection profile is applied for segmenting lines of Ottoman documents in other studies too. The authors of [10] indicates that finding positions of baselines and segmenting lines according to character sizes is a better solution than finding spaces between lines. The reason comes from the fact that, Ottoman language includes many characters with long ascender and descender parts resulting in narrow spaces between lines. They propose a method, where vertical projection profile of the image is calculated and then peaks of the profile are extracted as lines. To detect the peaks, projection profile values are compared to a threshold value with the intuition of lines should have greater number of black pixels in the profile. However, using a single threshold value may produce extra or missing lines in the results. To eliminate that, we propose a new idea for detecting the peaks of the profile. First a Fourier curve [40] is fitted to the profile and local maxima
points are found. These points are thought to be the location of baselines. Fourier curve can capture the repetitive pattern of lines. A Fourier series is defined as: y = a0+ n X i=1 aicos(nwx) + bisin(nwx); (2.4)
where the function is a weighted sum of sine and cosine functions that describes a periodic signal, ai’s are the weights, n is the number of terms and w is the
fundamental frequency of the curve.
Finally, connected components are assigned to closest baselines.
2.3.3.2 A Hybrid Approach
Ottoman language has some common properties with Arabic; most notably the al-phabet and the writing style which relies on dots and diacritics heavily. However, these small-sized components may produce ambiguous results for line segmenta-tion since they usually lie between the text lines. In [47, 48] it is mensegmenta-tioned that diacritical points can generate false separating or redundant lines.
Some line segmentation studies applied on languages that include diacritical symbols [48, 49] does not filter these small connected components during line segmentation and then apply a post processing step for correcting the approxi-mate results. On the other hand, some studies [34, 19] eliminate those small-sized components during segmentation and reconsider them to generate the final line segmentation results.
We propose a method that ignores small-sized components during line seg-mentation to obtain results more accurately without post processing. After we detect all connected components, the small ones are marked so that they will not be used during detection of the lines.
To find the small-sized components, each connected component’s filled area is calculated and then components which have a smaller filled area than a pre-defined threshold are marked as small. After the lines are detected, small-sized components are reconsidered and assigned to related lines. Figure 2.9 b shows the document image without small-sized components. As it can be observed, the text line structure is enhanced.
(a) (b)
Figure 2.9: (a) Binarized document image, (b) image without small-sized com-ponents.
Baseline is the fictitious line which follows and joins the lower part of the character bodies in a text line [50]. Thus, each connected component has baseline pixels that fit or come close on its baseline. In this study, for baseline extraction first each connected component’s baseline pixels are found approximately. To find those pixels, contour image of the connected component is obtained (see Figure 2.10 (b)). Then, left-to-right (see Figure 2.10 (c)) and right-to-left (see Figure 2.10 (d)) gradient image, measuring the horizontal change in both left and right directions are calculated.
Also, the bottom-to-top (see Figure 2.10 (e)) gradient image which shows the vertical change in the upward direction is obtained. Then these 3 gradient images are subtracted from the contour image which results in the group of pixels that approximately lie on the baseline (see Figure 2.10 (f)).
To obtain the exact baseline pixels, first the y-coordinates’ standard deviation (s) and mean (m) values are calculated. Then the pixels where |p − m| > s are considered as outliers and removed from the group. The rest of the pixels are used as baseline pixels (see Figure 2.10 (g)).
(a) (b) (c) (d) (e) (f) (g)
Figure 2.10: Procedure of extracting baseline pixels. (a) connected component, (b) contour image, (c) left-to-right, (d) right-to-left, (e) bottom-to-top gradient images, (f) approximate baseline pixels, (g) exact baseline pixels.
This procedure is applied for each connected component and a new image is reconstructed from these obtained baseline pixels which can be seen from Figure 2.11. Then to detect the baselines of each line, vertical projection profile of the reconstructed image consisting of baseline pixels is obtained (see Figure 2.11). The peaks of this profile can be interpreted as lines and the valleys as interline gaps.
To detect the peaks, a Fourier curve [40] is fitted to the profile and local maxima points are found. Fourier curve can capture the repetitive pattern of lines.
Figure 2.11: Left part shows the image reconstructed from the baseline pix-els of connected components, right part is the vertical projection profile of the reconstructed image. A Fourier curve is fitted to the projection.
Then, for each two adjacent peaks of the curve, the smallest value in the profile that lie between these peaks, which is usually zero, is obtained as a cut point. Thus, for each gap a cut point is calculated respectively. These points can be considered as an approximate of the interline gaps and are used for separating the baseline pixels that belong to different adjacent lines (see Figure 2.12).
After obtaining the baseline pixels that belong to each line (see Figure 2.12 (a)), polynomial curves are fitted to each group of those pixels to calculate the actual baselines (see Figure 2.12 (b)). Line fitting can also be used however; we preferred to use a 4th degree polynomial to tolerate some amount of curvature.
(a) (b)
Figure 2.12: (a) Approximation of interline gaps, (b) computed baselines.
After the baseline curves are extracted, the connected components which are not marked as small are assigned to their closest curves. To find the closest curve of a component, the distance function is obtained from the curve’s equation and the component’s midpoint. Then, the derivative of the distance function is computed to find the closest distance between the midpoint and the curve.
Finally, the component is assigned to the curve which has the minimum distance to its midpoint.
To finalize the results, removed diacritical components are assigned to lines. First each small-sized connected component’s nearest neighbors in 4 directions (right, left, up, down) are found. The nearest neighboring components should not be small-sized thus, must be assigned to some line.
The 4 nearest neighbors’ assigned lines are voted accordingly to their distances to the small-sized component. To, illustrate if the nearest neighboring component in some particular direction is closest to the small-sized component, its line id gets the highest vote. With this voting scheme each small-sized connected component has at most 4 different line candidates with their votes calculated according to the distances. Finally, each small-sized component is assigned to the line which has the highest vote.
2.3.3.3 Gabor Filtering with Region Intersection
To achieve script-independency for line segmentation, an algorithm not only en-hances the line structure but suppresses the language based characteristics should be used. Thus, we designed and algorithm that applies morphological and pre-processing operations on the image before the line segmentation step, to eliminate the mislead of language based properties. Also, Log-Gabor filter bank that we used for layout segmentation is also used here to detect line boundaries.
First of all, average connected component width (avgW ) is calculated. The image is dilated with a disk structuring element of size average width (avgW ). Then, opening and closing is applied with a disk of size 2. Small connected components are removed from the image in the same fashion explained in section 2.3.3.2 and they are left to be assigned after the lines are detected.
Since we are studying hand written documents many of them include charac-ters with long ascender and descender parts although they are in different lan-guages. By intuition these parts may cause problems during line segmentation since they complicate the process of discriminating lines with gaps. To eliminate this problem, extremes of connected components are smoothed. First, connected components whose rate of filled over convex area larger than 70% is found. These
connected components are thought to have extremes. The y-axis contour coordi-nates of the connected components are found and their mean (m) and standard deviation (s) is computed. Finally the pixels whose y-values lie in the range of (m − s, m + s) is cropped from the connected component and the others are con-sidered as outliers and removed from the component. Figure 2.13 shows the so far pre-processed image with the processes: morphological operations, small sized connected component removal and extreme smoothing. As you can see, the line structure is enhanced and language based properties are less significant.
(a)
(b)
Figure 2.13: (a) Original binary image to be line segmented. (b) Pre-processing applied to (a) with processes: morphological operations, small sized connected component removal and extreme smoothing.
From the pre-processed image connected components are extracted and base-line’s of components are computed with the same approach explained in section 2.3.3.2. As an additional step instead of using baseline pixels, lines are fitted
to each connected component’s baseline pixels and actual baseline formulas are used. Afterwards, an image is constructed from those baselines which can be seen in Figure 2.14.
Figure 2.14: Image constructed from the baselines of connected components.
The projection profile method we explained in section 2.3.3.1 is applied to the constructed baseline image to compute the frequency of the Fourier curve which indicates an approximate of gap and line distance together (GaL). This metric is used as a parameter for the wavelet scale of the Gabor filter. A filter bank is constructed from Gabor filters with a single orientation and 4 scales. Peter Kovesi’s Gabor Convolve software is used for the task 2.
Since we explained how to segment lines from documents with multi-oriented lines in section 2.3.2 and our line segmentation datasets include documents with similarly oriented lines, we used single orientation for the Gabor filters. Different scales are used to decrease the error rate caused by computing the gap and line distance (GaL). Thus, multiple scales are used to find the best approximation of gap distance.
Wavelength of the smallest scale filter is set to half of the gap and line length (GaL/2) and scaling factor between successive filters is set to 2, which results in filters with scales GaL/2, GaL, 2GaL, 4GaL. Ratio of the standard deviation of the Gaussian describing the log Gabor filter’s transfer function in the frequency domain to the filter center frequency is set to 0, 65 and ratio of angular interval
2
between filter orientations and the standard deviation of the angular Gaussian function used to construct filters in the frequency plane is set to 1, 3.
The filter bank is convolved with the constructed image and the maximum convolution response image is chosen. To find the maximum, the result of con-volving with the even symmetric filter, which are the real components are summed and then sorted.
Afterwards, to detect the approximate of the line boundaries, binarization is applied to the maximum convolution response image (ConvolutionImage). A predefined threshold is used for binarization, which is max(ConvolutionImage)/10. The resulting image indicates the approximate of line boundaries, where bound-aries are tagged as 1 and background pixels are tagged as 0. An example output can be seen in Figure 2.15.
Figure 2.15: Approximate line boundaries computed by binarizing the maximum convolution response.
The intersection of line boundaries and connected components of the original image is computed (see Figure 2.16 a). For each connected component, the largest intersecting line is found and the component is labeled with that line’s id. There remains unlabeled connected components which do not intersect with any of the boundaries and components which are labeled as small before. Each of them is assigned to its closest labeled connected component’s line. Figure 2.16 b shows the final line segmentation result.
(a)
(b)
Figure 2.16: (a) Intersection of line boundaries with ink pixels is visualized. (b) Final line segmentation result.
2.3.3.4 Gabor Filtering with Line Fitting
Our last line segmentation method uses the same steps with region intersection algorithm to detect the line boundaries which are explained in section 2.3.3.3. Afterwards, instead of intersecting connected components with regions, lines are fitted to each boundary and connected components are assigned to their closest lines. Figure 2.17 shows an example image with fitted lines to each boundary.
Figure 2.17: Baselines shown on the original binary image, computed by fitting lines to line boundaries.
2.3.4
Word Segmentation
Word segmentation is a difficult task for Ottoman documents because words consist of one or more sub-words (see Figure 2.18) and a sub-word means a con-nected group of characters or letters, which may be meaningful individually or only meaningful when it comes together with other sub-words [9]. This indicates that there are both inter and intra-word gaps and when intra-word gaps are as large as inter-word gaps or when both gaps are very little the words can not be discriminated. To apply word segmentation to Ottoman documents language based rules can be used which requires language experts. Also, supervised tech-niques can be applied but usually Ottoman archives do not contain segmented documents and word segmentation is usually required before recognition.
Figure 2.18: Example page in Ottoman.
Therefore, Ottoman word segmentation is not in our study’s scope. We
designed a simple morphology based word segmentation algorithm for script-independent documents. Most of the word segmentation algorithms are based on analysis of character space distances. Thus, we use basic morphological oper-ations like dilation, opening and closing to generate an output where each con-nected component will be a single word.
After line segmentation for each line image, average connected component height (avgH) and width (avgW ) is found. Then a structuring element of size proportional to average component sizes (avgH and avgW ) is generated and the source image is dilated with that structure. Opening and closing is applied with a disk of size 2. Each connected component in the resulting image is thought to be a word. So, the intersection of the resulting image and original image is found and each word is tagged with a different label. Figure 2.19 shows an example
word segmentation result for a Greek document.
Chapter 3
Segmentation Experiments
3.1
Dataset Descriptions
3.1.1
Ottoman Dataset with Multi-Oriented Lines
The first Ottoman dataset contains 50 handwritten documents from different books with total number of 44973 connected components. It was generated specifically to test layout segmentation. Thus, it only contains documents with multi-oriented lines and a document in this dataset should at least include 2 line groups with different orientations. Also, there are cases where different character sizes, line gaps and even 4 different orientations can be observed on a single page. Examples can be seen in Figure 3.1.
Figure 3.1: Example images from the first Ottoman dataset with multi-oriented lines.
3.1.2
Ottoman Dataset with Similarly Oriented Lines
Second Ottoman dataset is generated to evaluate the performance of the hy-brid line segmentation method which was designed specifically for Ottoman doc-uments. This dataset was constructed with 3 different parts. First one and the second one consist of text pages belonging to single books. First part is printed (P rinted) and includes 120 pages while the second one is handwritten (Handwritten) and includes 50 pages. These 2 parts are constructed to compare the algorithm’s performance for handwritten and printed texts.
The third part includes 240 pages taken from 6 different books (Book1−6), 20 pages from each and the documents are all handwritten. This part is constructed to evaluate the performance under different writing styles and writers. Figure 3.2 shows examples from the dataset. Number of connected components and lines in the dataset are given in Table 3.1.
Figure 3.2: Example images from the second Ottoman dataset with similarly oriented lines. The leftmost one is printed while the others are handwritten.
3.1.3
ICDAR Dataset
This dataset is released on ICDAR 2013 Handwriting Segmentation Contest. It includes 125 English, 125 Greek as well as 100 Bangla documents. The docu-ments are all handwritten and in binary format. We also converted 50 Ottoman handwritten documents to the dataset’s format and added them to obtain com-parative results with different languages. Thus, the whole dataset includes 400 pages. Figure 3.3 shows example images from the dataset.
Figure 3.3: Example images from the ICDAR dataset combined with Ottoman documents. From left to right: English, Greek, Bangla and Ottoman document.
3.2
Evaluation Strategies
Segmentation results are evaluated according to the ICDAR 2013 Handwriting Segmentation Contest’s evaluation strategies 1.
The performance evaluation method is based on counting the number of one-to-one matches between the areas detected by the algorithm and the areas in the ground truth. A M atchScore table is used whose values are calculated according to the intersection of the ON pixel sets of the result and the ground truth.
Let Gi be the set of all points of the ith ground truth region and Rj be the
set of all points of the jth result region. T is an operator that counts the number 1
of pixels in the zone. Table M atchScore(i, j) represents the matching results of ith ground truth region and the jth result region as follows:
M atchScore(i, j) = T (Gi∩ Rj)/T (Gi∪ Rj). (3.1)
An example is illustrated in Figure 3.4.
(a) (b)
(c)
Figure 3.4: (a) Ground truth. (b) Segmentation result. (c) Matchscore table.
The matching-scores between all the result zones and the ground-truth zones are obtained. If the matching score is above a predefined threshold (M S − T hreshold) then the result zone is counted as a T rueP ositive (T P ). Re-sult zones which are not matched to any ground truth zones are F alseP ositives (F P ) and the ground truth zones which are not matched to any result zones are F alseN egatives (F N ). P recision, Recall and the F 1 − Score are calculated as follows:
P recision = T P
Recall = T P
T P + F N, (3.3)
F 1 − Score = 2 × P recision × Recall
P recision + Recall . (3.4)
3.3
Experiments and Discussion
3.3.1
Ottoman Document Segmentation Experiments
3.3.1.1 Layout Segmentation Experiments
Ottoman dataset with multi-oriented lines which is explained in section 3.1.1 is used for layout segmentation experiments. All layout segmentation results can be found in layout segmentation results section of Appendix A. Some example results are shown in Figure 3.5. The components which are tagged with same colors are thought to have the same orientation. As it can be observed, each document has more than one region that has a different orientation. Some has regions with changing character sizes and some has connected components which are written so close that their region boundaries are difficult to discriminate.
Layout segmentation algorithm computes the maximum Gabor response per cell (see Section 2.3.2). The number of cells are defined by two parameters n and m and during experiments both of them are set to 10. Thus, each image is divided into 100 cells. These two parameters should not be too large or too small. The cell size should be small enough to discriminate each region while it should be big enough to capture the scale and orientation relationship between components.
To evaluate the results we counted the number of connected components which are labeled wrong. As it was mentioned before, there are total 44973 connected components in this dataset and according to results only 1794 of them are labeled wrong which implies an accuracy rate of 96.01%.
Figure 3.5: Layout segmentation results.
Different types of errors can be observed from wrong labeled connected com-ponents. Figure 3.6 shows example error types from results. First type of error is caused by regions which are much smaller compared to others. Figure 3.6 (a) is an example and as it can be observed, the green part has the same writing orientation with the blue part however according to results they are labeled with different orientations. This mistake is caused by the narrowness of the green re-gion. Since those connected components construct a vertical narrow shape, during Gabor filtering a larger scale than their true character scale with a vertical orien-tation gives higher convolution response than the correct scale and orienorien-tation. This problem can be solved by using a single scale but then, the algorithm will loose its character scale-independency and it will lack of detecting regions with different character sizes which will result in a decrease in accuracy.