Man-made Object Classification in SAR Images Using
2-D Cepstrum
Abdulkadir ERYILDIRIM
Meteksan Savunma Sanayii A.Ş., TurkeyA. Enis CETIN
Bilkent University, Turkey[email protected] Abstract— In this paper, a novel descriptive feature parameter
extraction method from Synthetic Aperture Radar (SAR) images is proposed. The new method is based on the two-dimensional (2-D) real cepstrum. This novel 2-D cepstrum method is compared with principal component analysis (PCA) method by testing over the MSTAR image database. The extracted features are classified using Support Vector Machine (SVM). We demonstrate that discrimination of natural background (clutter) and man-made objects (metal objects) in SAR imagery is possible using the 2-D cepstrum feature parameters. In addition, the computational cost of the cepstrum method is lower than the PCA method. Experimental results are presented.
I. INTRODUCTION
Automatic recognition and classification of man-made objects in Synthetic Aperture Radar (SAR) images have been an active research area because SAR sensors can produce images of the scenes in all weather conditions at any time of day and night that are not possible with infrared or optical sensors [1]. There are many areas of application where the recognition of a target or texture in SAR images is important including military combat identification, meteorological observation, battlefield surveillance, mining and oceanography [2, 3].
A typical and complete automatic target recognition (ATR) system includes five stages: detection, discrimination, classification, recognition, and identification [3]. In some systems, only some of the above stages are available. In general, the SAR ATR system fulfills three functions: detection, discrimination and classification.
In this paper, the novel feature extraction method based on the two-dimensional (2-D) cepstrum from SAR images is proposed and compared with the principal component analysis (PCA), which is the most popular feature extraction method. Cepstrum is the most important feature extraction method used in speech recognition and speaker identification. However, to the best of our knowledge, the application of two-dimensional (2-D) cepstrum to the SAR image classification and detection problems is not fully investigated. We introduce a novel D cepstrum feature extracted using a non-uniform 2-D 2-DTFT grid and weighting. This new cepstrum feature is
invariant to the amplitude changes and rotational variations and provides the description of objects with low computational complexity. It is assumed that regions of interest (ROIs) from SAR images are available. Then the proposed 2-D cepstrum approach and PCA method are used to discriminate the natural background (clutter) and man-made (metal) objects in the ROIs. Extracted features are classified using Support Vector Machines (SVMs) [4].
The rest of this paper is organized as follows. In Section II, the proposed 2-D cepstrum method for feature extraction is described. In Section III, PCA is explained. Section IV gives the experimental results, followed by Section V which gives the conclusions.
II. THE 2-DCEPSTRUM METHOD
The 2-D cepstrum methods have been applied to the echo removal, automatic intensity control, and enhancement of repetitive features in image processing [5, 6]. In our work, we use the 2-D cepstrum approach to extract descriptive features from SAR images.
The real cepstrum
x
ˆ
(
n
1,
n
2)
of a 2-D signal is defined as:x
ˆ
(
n
1,
n
2)
=
F
2−1(log
|
X
(
u
,
v
)
|)
(1) where (n1, n2) are the 2-D cepstrum domain coordinates,1 2−
F
represents the 2-D inverse discrete-time Fourier transform (IDTFT) and X( vu, ) is the discrete-time Fourier transform (DTFT) of the original signalx
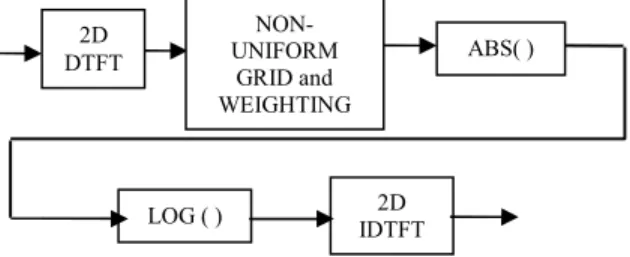
. The DTFT is computed using the FFT algorithm on a uniform grid.Our 2-D cepstrum feature method applied to 2-D SAR images comprises of five major steps: The 2-D discrete-time Fourier transform (DTFT) computation, transforming the 2-D DTFT data into non-uniform 2-D DTFT grid and weighting, the absolute value or power calculation, the logarithm computation and the inverse 2-D discrete-time Fourier transform (IDTFT). Figure 1 illustrates the process of computing the 2-D cepstrum feature of a given SAR image ROI. To reduce the computational load and improve the discrimination capability, the cepstral feature vector is obtained applying a non-uniform grid with weights. This is a
This research is funded in part by Meteksan Savunma Sanayii A.Ş. under contract no. 106A030.
similar approach as in speech cepstral processing. The 2-D DTFT grid is non-uniformly divided into cells varying in size and the weighted mean value of each cell is used.
Figure 1. The 2-D Cepstrum feature extraction
Weights are higher for low frequencies. By this operation, more emphasis is given to the low frequencies which contain most of the target energy and correspondingly, less emphasis to the high frequency components. The N by N 2-D DTFT matrix is reduced to L by L (L<<N) matrix with this process. For computational considerations, L can be selected as a power of 2. Figure 2 and 3 show a sample grid and a sample SAR image of a target, respectively. Figure 4 and 5 summarize the effect of the above operations.
To extract cepstral feature parameters, a window around the maximum value of the centered 2-D cepstrum grid is used. Then, the cepstral feature vector is obtained by circularly scanning the window. The size of the window determines the length of the cepstral feature vector.
One of the principal benefits of the log transformation is to compress dynamic range and it provides invariance to the amplitude changes and rotational variations to some extent. Let
X
be the 2-D image of an object andaX
is its amplified (or attenuated) version. The log spectrum of theaX
is given by)
)
,
(
log(
)
log(
)
)
,
(
log(
aX
u
v
=
a
+
X
u
v
(2)and the corresponding cepstrum is
x
ˆ
a(
n
1,
n
2)
=
a
ˆ
δ
(
n
1,
n
2)
+
x
ˆ
(
n
1,
n
2)
(3) where⎩
⎨
⎧
=
=
=
otherwise
when
n
n
n
n
0
0
,
0
1
)
,
(
1 2 1 2δ
(4) i.e.x
ˆ
a(
n
1,
n
2)
=
x
ˆ
(
n
1,
n
2)
for(
n
1,
n
2)
≠
(
0
,
0
)
(5) Therefore, the amplitude parametera
only effects the (0,0)th entry (DC level) of the centered 2D cepstrum. Therefore, cepstral parameters except the (0,0)th entry are invariant to amplitude variations of the original image. This is a very important feature of the cepstrum because the signal strength and quality of the 2-D SAR image may get affected by the look-angle change and speckle noise.Robustness of the cepstrum to rotational variance is experimentally observed in Section IV.
Figure 2. A sample non-uniform grid for 128 by 128 images
Figure 3. SAR image (128 by 128) of BMP-2 armored personel carrier
Figure 4. The log-spectrum matrix of the image (128 by 128) shown in Figure 3
Figure 5. The reduced log-spectrum matrix of the image (16 by 16) in non-uniform grid with non-non-uniform weights
III. PRINCIPAL COMPONENT ANALYSIS
PCA is one of the most popular methods used in feature extraction in SAR images [7]. PCA projects d-dimensional data onto a lower-dimensional subspace by minimizing the sum-squared error [8]. The first step of the PCA is the computation of the d-dimensional mean vector
μ
and d by d covariance matrixC
using the full dataset (i.e. training dataset). Next, the eigenvectors and eigenvalues are computed and eigenvectors are ordered according to the decreasing eigenvalue. This provides the components in order of significance. Then, p eigenvectors having the largest eigenvalues are selected and a d by p matrixT
whose columns are the p eigenvectors is constructed. The feature vector of the input data is extracted by projecting the input datax
onto the p-dimensional subspace using the equation)
(
~
=
T
x
−
μ
x
t(6) where
T
t is the transpose of the matrixT
.2D DTFT ABS( ) LOG ( ) IDTFT 2D NON-UNIFORM GRID and WEIGHTING
Since PCA implementation involves the construction of the covariance matrix using the full dataset and computation of eigenvectors, its computational cost is higher than the 2-D cepstrum method, in particular for large dataset. In addition, PCA demands larger memory than the cepstrum method as it needs to temporarily store the training dataset.
IV. EXPERIMENTAL RESULTS
A. Dataset
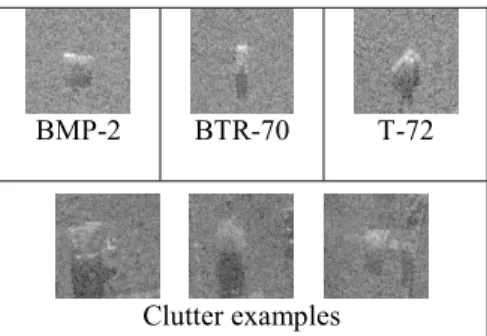
In this paper, MSTAR SAR image database is used [9]. The targets which refer to man-made (metal) objects in this work are BMP-2, BTR-70 armored personal carriers and T-72 main battle tank. The clutter refers to the natural background and man-made objects other than the targets.
BMP-2 BTR-70 T-72
Clutter examples
Figure 6. MSTAR target and clutter image examples
B. Procedure
In this experimental study, a simple median filter is implemented to reduce the speckle noise in SAR images. The target ROIs, which are of size 128 by 128, are available in the MSTAR database and clutter ROIs with the same size are generated from the original images in the MSTAR database by cropping. Examples of target and clutter ROI images (which are 128 by 128) are shown in Figure 6. As inputs, we used these 128 by 128 ROI images and also 64 by 64 image chips obtained from these ROI images. The 64 by 64 image chips are obtained by cropping the area, which covers the target located in the center, from the ROI images.
The cepstral feature parameters are computed from each input ROI as explained in Section 2 and Principal Component Analysis (PCA) is implemented to obtain the feature vectors based on the equation (6). Support Vector Machine (SVM) is used to classify the extracted features [10].
We constructed training and test sets with two classes containing targets and clutter (no target) respectively. Table I shows the number of samples corresponding to each category.
The results obtained from above procedures are presented in the following section.
TABLE I. NUMBER OF IMAGES USED IN TEST AND TRAINING
Training Process Testing Process Target 1376 1376 Clutter 1307 11007
C. Results and Discussions
We define the detection accuracy of the method as the number of correct detections of the targets divided by the total number of sample images tested. The false alarm percentage (PF) is equal to the number of false positives (clutter samples which are misclassified) divided by the total number of sample images tested.
TABLE II. DETECTION ACCURACY AND FALSE ALARM PERCENTAGES
USING 2-DCEPSTRUM AND PCA
Input Images Performance Measures 2-D Cepstrum PCA 128 by 128 Detection Acc. (%) 99.2913 98.6497 PF (%) 00.1032 00.1511 64 by 64 Image chips Detection Acc. (%) 99.7145 99.4534 PF (%) 00.0293 00.0359
The best classification performance is achieved using the radial basis function (RBF) kernel of the SVM.
For the 2-D cepstrum method, the best results are obtained using a window size of 6 by 6 which corresponds to 36 cepstral parameters based on our trials. Further increase in feature vector length does not improve the performance. A similar size feature vector is also used in PCA method.
Table 2 gives the best experimental results obtained. When the 2-D cepstrum method is used, 8 out of 1376 target samples are misclassified and 11 of 11007 clutter samples are detected as target for the 128 by 128 images. The performance slightly increases when 64 by 64 image chips is used. The results demonstrate that the 2-D cepstrum method provides good descriptive feature parameters to detect the targets and reject the clutter accurately and efficiently.
Based on our observations, as expected, the PCA method is computationally more expensive as it needs much more time in average than the 2-D cepstrum method to extract the features from the input images as shown in Table 3 based on our MATLAB implementation. In addition, PCA does not provide better results than the 2-D cepstrum method in terms of the detection accuracy and false alarm percentage.
TABLE III. THE TOTAL COMPUTATION TIME OF THE ALL FEATURES
FROM THE TRAINING SET IN MATLAB
2-D cepstrum PCA
Time (minute) 1.22 15.41
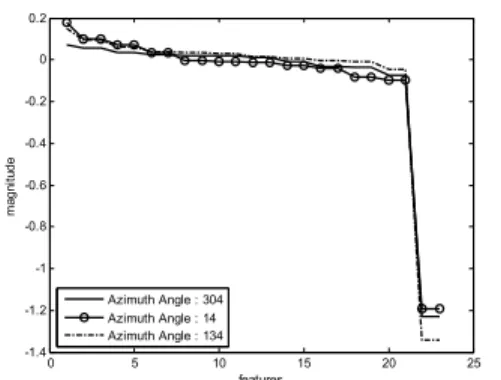
Rotational variance of the targets is also absorbed by the cepstrum feature. Cepstrum features (sorted) of the same target with different orientation (Azimuth angles are 304, 14 and 134 degrees) are shown in Figure 6. Azimuth angles are given in the MSTAR database. The distributions of the features belonging to different orientations are similar to each other as shown in Figure 6.
0 5 10 15 20 25 -1.4 -1.2 -1 -0.8 -0.6 -0.4 -0.2 0 0.2 features ma gn itu de Azimuth Angle : 304 Azimuth Angle : 14 Azimuth Angle : 134
Figure 7. Effect of the orientation on cepstrum feature parameters
V. CONCLUSION
A novel method of extracting descriptive feature parameters from the two-dimensional (2-D) cepstrum of a SAR image is presented. An important feature of the cepstral feature parameter extraction is that it is invariant to the amplitude changes and rotational variations to some extent. It is experimentally observed that the proposed cepstral feature extraction method provides better results in terms of the accuracy and processing time than the PCA in the MSTAR SAR image. The initial tests to classify the MSTAR targets (BTR-70, BMP-2 and T-72 military targets) using 2-D cepstrum give motivating results.
REFERENCES
[1] Chris Oliver and Shaun Quegan, “Understanding Synthetic Aperture Radar Images”, Scitech Publishing, 2004
[2] John C. Curlander and Robert N. McConough, ” Synthetic Aperture Radar, Systems and Signal Processing”, Wiley Series in Remote Sensing, 1992
[3] Schroeder J., “Automatic Target Detection and Recognition Using Synthetic Aperture Radar Imagery” Workshop on the Applications of Radio Science, WARS02, 2002
[4] Q. Zhao and J. Prindipe, “Support vector machines for SAR automatic target recognition”, IEEE Trans. On AES, vol.37,no.2, pp.643-654, 2001
[5] Alok R. Kher and Sunanda Mitra, ”Registration of noisy SAR imagery using morphological feature extractor and 2D cepstrum”, Proc. SPIE, Vol. 1771, 281 (1993).
[6] Lee J.K., Kabrisky T.M., Oxley M.E., Rogers S.K. and Ruck D.W., “The Complex Cepstrum Applied to Two-Dimensional Images”, Pattern Recognition, 26, 10, Oct, 1993, 1579-1592
[7] A.K. Jain, R.P.W. Duin and J. Mao, "Statistical pattern recognition: a review", IEEE Transactions on Pattern Analysis and Machine Intelligence, vol. 22, no. 1, 2000, 4-37.
[8] Richard O. Duda, Peter E. Hart and David G. Stork, “Pattern Classification”, Wiley, 2001
[9] MSTAR image database, https://sslweb.cis.jhu.edu/%20DATASETS/- MSTAR/
[10] Chih-Chung Chang, Chih-Jen Lin, LIBSVM, 2001, http://www.csie.ntu.edu.tw/~cjlin/libsvm, Available online