See discussions, stats, and author profiles for this publication at: https://www.researchgate.net/publication/3675242
Online exercise ECG signal orthogonalization
Conference Paper
· October 1996
DOI: 10.1109/CIC.1996.542517 · Source: IEEE Xplore CITATIONS27
READS23
2 authors:
Some of the authors of this publication are also working on these related projects:
Lecture Notes on Electroacoustic Transduction
View project
Impacts of Pressurized Irrigation Technologies on Efficient Water Resources Uses in Semi-Arid
Climate of Konya Basin of Turkey
View project
Bilal Acar
University of Sussex
46PUBLICATIONS
875
CITATIONS
SEE PROFILE
Hayrettin Koymen
Bilkent University
106PUBLICATIONS
828
CITATIONS
SEE PROFILE
All content following this page was uploaded by
Hayrettin Koymen
on 28 July 2016.
The user has requested enhancement of the downloaded file.Onlline Exercise ECG Signal Orthogonalization
Rurali Acar arid
TIayrettin
Kiiymeri
Billieiit Uiiiversity, Dept. of Electrical
and
Electronics Engineering, Ankara
,
Tuxltey
Abstract
Iii t h i s p a p e r a n e f i c i e n t m e i h o d of m a k i n g use oj -the reduii,daiecy in s t a n d a r d 12 lead ECG sigiials t o e l i m i n a t e n o i s e is described. T h e naelhod i s based o n o r t h o g o n a l i z a t i o n v i a o n l i n e S i n g a l a r V a l u e D e c o m p o - s i t i o n (SVD). Its a p p l i c a t i o n as a f i l t e r t o r e m o v e F M C
n o i s e aiid b a s e l i n e w a n d e r a r e e x p l a i n e d . il coinparu- % w e s t u d y of ST a i d y s i s resudts of o r i g i n a l a n d p r o - cessed exercise EGG d a t a is r e p o r t e d .
1.
hit
roductioii
Exercise electrocardiogram
(ECG)
is cont,ainiiiat,cd byEMG
iioisc aiid Ixseline wander(BW).
Storage oEdata constitutes a. prohlem because this requires high storage capacity.
Several techniques were reported in the literature t o enhance t h e exercise ECG signals [l]. All o l them are based on solme sort of composite heat, formation.The iiiaiii object,ive iii thest: a.pproaclies is t o disregard the outliiier sample values a n d filter out t h e noise which i s assumed to b e stationary and uncorrelated with t h e sig- nal. Averaging a n d median filtering are two basic tecli- niques applied with this objective. However these as-
suniptioiis are t o o restrictive and usually rnost of them are coiri[,irl,atioiially involved.
Our algorit,hin
[a],
ton the otlier hand,
is a recur-sive one which approxiinates Singular Valuc? Decoinpo- sit,ion (SVD) first proposed by Vnnderscliool et.al. [3], t,o seperate fetal ECG from inaternal ECG signals. 'This approach is employed jii tlie presented work t o reiliovc redunda.ncy by t h e ort,hogorralizatiorl of input s i g n d s . Thus all the information conta.ined in t h e input sig- nals is represented in a, fewer iiumber of output signals. Since these signals are orthogoiial t o each other, no
redundancy exists in the o u t p u t signal set.
2 .
Basis Of
The
Algorithm
T h e d g o r i t h m is based on t h e online approximation
oi SVD of a matrix
.
M E R F x " . SVD of M is given in [4] asU'MV x: (1)
U U T = U V J = I ,
,
VV'=I,, (2)from which we can establish tlic relation 1xtwec.n S V D
of M a n d eigenvalue decoiupositioii ol' MMT as
where
r = rcln.k(lM) (12)
( 1 3 )
U = [UrllTn]. (14)
B = [SI . . . s,.O.. .O]
n
Zeros i n
W
are subst~itut~cd for noise c,haniiels.IS,.
cor- responds-
t o Iiigh singular vallles u i d slmiis thc signal space. U,, is its orthogoiml coitirp1eiiit:nt ant1 slia..iis tlie noise space. Q; is the Giveii's Rotkition niat,rix t h a t makes an off diagonal element of B; zero[4].
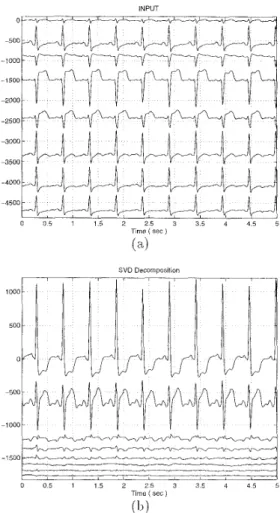
l h e max- iinurn off dia.gona1 element of B; is chosen tmo he inade zero a t each stcp in the above algorithm. inti is t h e input signal vector at, h i e instant i . s f corresponds t o the decomposed signal set at t h a t instant. mi isthc reconstructed signal set. Figure 1 shows t h e input and the decomposed signal sets. The first r channels ( = 2 in the example ) are t h e projections of input channels onto the subspacc spmiierl b y U,. (st:e Q u a , -
tion l4).'l'hese iiialte t i p t h e signal space. T h e rest of the tlecoiriposccl sigrials-a.rc t h c project,ions onto t h e noise space spanned b y Upl.
-
3.
Noise
Eliiiiiiiatioii
INPUTIn t,he following describe our online noise detection algorithm developed aiid tested on real d a t a .
In geucral, t h e algorithm is capable o f mapping noise a n d ECG onto orthogonal subspa.ces, the signal space aiid the noise space as mentioned before. However in some ca.ses shift#s between t h e two subspaces can occur a n d noise can be seen in t h e signal space. T h e rea,son for this differs.
It
inay be due to high amplitude noise, low amplitude long lasting noise, noise in the major- ity of input channels, and noise in an important input cha.nne1. Noise det,ection a.nd eliinina.tion is clone t o avoid sucli interferences into t h e signal space.T w o methods are developed for this purpose. High amplitude noise causes u i ’ s
( i
5
r a n k ( M ) ) which de- fine the projection o€ the input signal set onto si, torotate significantly. ‘[’he direction of rotation is such t,liat t,he component of ui corresponding t o the iioisy input channel experiences t h e highest increase in ab- solute value. As a result ui begins to m a p iioise onto the signal space. To preserve orthogonality some
ECG
signal is also mapped onto t h e noise space. Settinga, rotmation angle threshold for iii’s t h a t span t>he sig- na,l space, we let them rotate within some limits so as
not t o ca.use any interfcreiice bet,ween subspa.ces as ex- pla,iiied above. Whciiever this threshold is violated, the noisy input chaiiiiel is determined for the components
of U;.
Low amplitude noise is directly mapped oiit,o t,lie
noise space. Ilowever if tlie noise in tlie input lasts
€or a long time, the energy colitsent of t h e o u t p u t noise clmnnel begins to increase considerably depending on t,he value of cy. Aft,er a while, tlie diagonal entry of C corresponding to t h a t noise channel reaches a signifi- cant fra,ction of the one corresponding t,o t h e smallest signa.1 cha.iine1. This causes a rotation o f U; sucli t,liat tlie noise is projected onto tlre signal spa.ce. ‘This is a. sirni1a.r result as in high aniplit,ude noise. However, these rot,atioiis a.re slower and ca.nnot be detected by observing t h e rotat,ion angle of iii. Rather, the accu- mulation can he detec,t>ed by observing the dia.goiia1 entries of C . When it is detected, the component of i i i ,
mapping that pa.rticular noise, which is t h e greatest, in absolute value sliows the iioisy input channel.
I h v i n g determined t,he noisy input channel, t h e cor- responding row a n d left niost column of U are deleted together with t h e la.st row and column of C . This cor- responds to excluding t,he noisy input chnnnel froin the input, dat,a set, decrea.sing the dimension by one, disre- garding t h e sinallest
SVD
o u t p u t channel.These input channels. excluded from the decompo- sition, are clieclted via. c,ross corre1at)ioii of QFLS coni-
Time ( sec ) (a) SVD Decomposition -1500 0 0 5 1 1 5 2 2 5 3 7 5 4 4 5 5 Time ( s e c ) 01)
Figure 1 8 charinel (a)Lnput
,
(b)SVD O u t p u t splexes t o detect whether tlie noise has disappeared. T h e segiiieiits of the noisy input channel t o be cross
correlated are chosen from the cleaii input clianiiels’
QRS containing portions by time aligiiinent. If‘ a high correlation occurs then t,lint cliaiiiiel is included in t h e input d a t a set t,o lie decoiiiposed. ’l’his i s done by in- creasing t,lie dimension by recovering old U and C used j u s t before the most recent tliriieiisioii reductlion.
4.
Observatioiis
Exhaustive a,nalysis o f exercise ECC; da.ta records from 23 pa.tient,s showed t,Jiat, rank of M is generally
two a n d in f e w cases a third channel is seen in which colisiderable amount of‘ QR.S iiiformatioii exists.
High noise coizt,aiiiiiiat,ioii of tlir signal cliaiiiiels were observed in case of noisy DII. ‘This indicates t1ia.t DIT
i s the channel tliat is tlie lcast correlated cha.nne1 with
substitutcd by signal content in other channels. This is due t o its spatial position on the body. Recordiiig
DIII independently will help improving this unique de- pendence on DIT and increase the noise imrnuiiity by adding further redundancy t o the input set.
'The f o r g e t h g h c t o r ,
a ,
determines how far the algorithm remembers past d a t a .It
affects the set- tling time a.nd noise a.ccuniulation. As a gets higher, the probability of passing noise accumulation thresh- old falls, i.e. low power noise is mapped onto the noise space for longer periods. T h e decrease in the adaptive nature of the algorillim is a dra.wbacli for high C Y . As a gets lower, imniunity to noise is lost. If it is too low,ECG cannot lie preservlxl in the signal space even in the absence of noise. Be'cause the a.lgoritlim cmiiot re- member past d a h at a.11 and is extraordinarily seiisitive t o the input. As a. result, Q R S complexes cause high
rotations of ui's iiiuch like high amplitude noise does. Good results were obta.ined with a
=
1-
2-13.T h e algorithm is sensitive t o DC levels. DC compo- nents behave like independent signal sources. 'The rank
of M increases t o accomplish this. This means inore
QRS containing cliannels are seen a t tlie output. 'They do not c o n h i n signals with different morphologies but
the same signals with different I)C levels. 'l'he only information they add t o the decomposed signal set, is the DC value. A first order Butterworth high pass fil-
ter with a cut-off frequency of' 0.7 Hz is applied t o the input si& t o assure a zero DC level. Since the order of tlie filter is low, it do" not affect the morphology of
ECG.
T h e third signal chainnel, when exists, i s a low a n -
plitude channel. It is not immune to noise as much as
other output channels. To overcome this problem, a limit is enforced on the speed of the rotat,ion of 113.
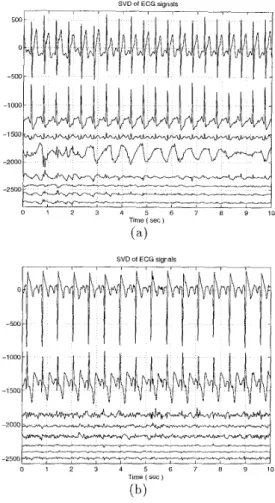
It can he observed t h a t the algorithm is capable of sepera.ting EMG noise and BW, rpovided that the for- getting €actor is chosen properly. 'rhe decomposed sig- nal sets ca.n be seen in Figure 2.
5 .
ST Aiialysis
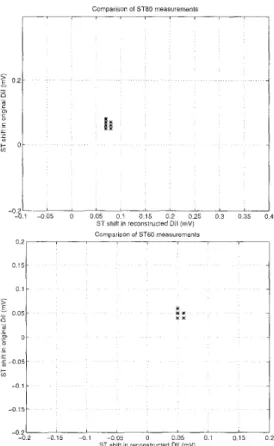
ST segment's potential level measurements were done both on the origiiial aiicl reconstructed d a t a sets a t two points, BO and SO m s after QRS. ECG records in Fig-
ures 3 and 4, which are 14:40 min. and 21:40 inin. long respectively, are sampled a t 500 sainples/sec. ST iiieasiireinents were take11 on average heat>s of succes- sive 20 sec. episodes. D a t a in Figure 3 is taken from
ECG with ST level variation and has 44 d a t a points.
Data. i n Fignre 4 is t,al.:en horn ECG without S T level
variat,ion and has 65 data points. T h e measureinent>s were c,oinpaied iisiiig linea,r regression analysis for each
500 0 -500 -2500 -
2z-y-j
-t u 0 1 2 3 4 5 6 7 8 9 10 Time ( sec ) SVD of ECG slor~als 0 -500 -1000 -1500 2000 -2500 0 I 2 3 4 5 6 7 a 9 10 Time ( s e c )Figure 2: ( a ) SVD Of ECG With U W
(b) SVD Of ECG With EMG
channel. ?'he model used is y j = U x "ui
+
b , whereyi's and xi's are
ST
measureinelits of original and re- constructed d a t a , respectively. I n the d a t a with STlevel shifts, a line with a slope close t o 1 is fitted by
MINITAB.
S'r
iiieasurements on channel DIT, which is the hardest t o reconstruct are compared in Figures 2 and1.
T h e regression lines in Figure 3 aiitl 4 areyi = 0.991 x xi -
0.028
and yi =: 0.913 x zi-0.018).
In the d a t a from normal ECG, which has d m o s t constantS'r
levels, no line is fitted, however, ,the ST measure- ments in both dat,a sets are almost equal (see Figure 4). T h e enhancement in ECG is clear w h m the iiuinber ofQRS complexes included in the iiieasurements are com-
pared. For the d a t a in Figure 3 the number of QRS
complexes accepted in DII are 1625 and 1765 for orig- inal and reconstructed signals respectively. They are 1004 and 1058 for the dat,a in Figure 4 . Ally disconti- nuity in the ST measureiiiciits iii the original data. due I,O high noise are removed in tlie reconstructed data.
Comparison 01 STBO measurements 0 1 5 - 0 1
-
> 0 0 5 - 0 - p 0 --
-0 0 5 - t -0 1 ~ - 0 1 5 - -0 2 - 0 2 - 0 1 5 - 0 1 -005 0 0 0 5 0 1 0 1 5 0 2ST shill in reconstructed DII (mV)
Figurc 3:
ST
~iiea~urements from abnormal ECGComparison of ST60 measurements 0 1
-
> - 0 0 5 - 0 - p 0 --
;
-0 05 b -0 1 - x *.x x x 1 -0 151-I
-0 2 -02 -075 - 0 1 - 0 0 5 0 0 0 5 0 1 0 1 5 0 2 ST shift in reconstructed DII (mV)Figure
4:
S7’ measurenlents from normalECG
7.
References
A new approach for online noise elimination in ex-
ercise ECG sigiials is described. It is based on t h e redundaacy iii standard 12 lead ECG signals. I t is observed tjliatl signal c.omponents can be represented in 2 diineiisioiial space with preserving arryhthniic n-ior- phologies. Original signals can be reconstructed with- out noise and totally lost cliaiiiiels can be constructed providing a non-stop exercise t,est.
This algorithm improves data. compression by pro-
viding noise-free ECG signals which can be compressed
more eflic,iently. T h e most, important improvement, is the inforniation compression. If t h e analysis of ECG
is done 011 t,lie decomposed signal set, which is guaran-
teed to contain all the informatioii, then keeping this redmed dimensional signal set would be enough, which provides a compression of 1 to 4. As a first step, QRS
detection on decomposed signals was done by Caglar
[5].
Further research is needed on arrylltllmia detect,ioil and classification on t,liese low dimensional orthogonalECG signals.
Afoiiso
V.X.,
Toiiipkins W . J . , Nguyeii T.Q., Michler li., Lilo S . , “Comparing stress ECG eiiliaiicement al- gorit,hnis,” IEEE EMB M a g a z i n e , vol. 15, No. 3,pp. 37-44,
M a y / J u i i e 1 9 9 6 .Acar
B.
~ “Singu1a.r value decomposition based onlineECG signal orthogorialization,” To lie s u b m i t t e d as an
M.S. T h e s i s t o B i l k e n t U n i v e r s i t y ! i l n k a r a , Turkey,
Sept,ember l99G.
Vsnderschoot, J., e t al. “Two nietlrods Tor opt.imal
MECG elimination a n d FECG det,ectioii from skin elctrode signals,” IEEE Trun,s. O n Uiornedical Eny.,
vol. BME-34, No. 3 , pp. 233-242, March 1987. Goliib G.H., Va.n Loan C.F., “Matrix Computations,”,
Jolm IIopkins University Press, Baltimore, 1989. <!.@Jar I<., .‘QRS dctec1,ioii 011 01 t8hogoiialized signals,”
To be strbmitted a s r i n Al.S. T h e s i s t o Bilkent 1Jniver-
s i t y , A n k a r a , Tuvkey, Sept.emher 1996. Address for correspondence:
Bilkent University
Eng. E‘ac. EE Dept,. 06533 Ankara Turkey
tel/fax: ++90-312-2664307 e-mail: b u r a k a ~ e e . h i 1 k e n t . e d u . t ~
240
View publication stats View publication stats