'·ί ;·; - д ' ί·"^·:Γ-Τ·Ι ^vg·' J ■ Н б і ·
кзь
/ээ>
A THESIS
SUBMITTED TO THE DEPARTMENT OF PHYSICS AND THE INSTITUTE OF ENGINEERING AND SCIENCE
OF BILKENT UNIVERSITY
IN PARTIAL FULFILLMENT OF THE REQUIREMENTS FOR THE DEGREE OF
DOCTOR OF PHILOSOPHY
|
5
/» ^ in<w5By
İsmet İnönü Kaya
February 1997
асб-Н-б
И6?-
• k Z 3
is e /+
dissertation for the degree of Doctor of Philosophy.
Assoc. Prof. Recai Ellialtioglu (Supervisor)
I certify that I have read this thesis and that in my opinion it is fully adequate, in scope and in quality, as a dissertation for the degree of Doctor of Philosophy.
Prof. Cemal Yalabık
I certify that I have read this thesis and that in my opinion it is fully adequate, in scope and in quality, as a dissertation for the degree of Doctor of Philosophy.
I certify that I have read this thesis and that in my opinion it is fully adequate, in scope and in quality, as a dissertation for the degree of Doctor of Philosophy.
Assoc. Prof. Bilal Tanatar
I certify that I have read this thesis and that in my opinion it is fully adequate, in scope and in quality, as a dissertation for the degree of Doctor of Philosophy.
Assistant Prof. Orhan Aytiir
Approved for the Institute of Engineering and Science:
Prof. Mehmet Baray^
нот
ELECTRON INTERACTIONS IN NANOSTRUCTURES
İsmet İnönü Kaya
Ph. D. in Physics
Supervisor: Assoc. Prof. Recai Ellialtioğlu
February 1997
Modern semiconductor growth and processing techiques have provided the capability of fabricating a huge variety of devices which have atomically precise layered structures and lateral patterns with nanometer sizes. This not only provided novel device possibilités but also opened a new field in condensed matter physics, so called mesoscopics. It does not seem likely that the mesoscopic electronic devices will be available in the near future. Two main obstacles for mesoscopic electronics are the low temperature requirements and the breakdown of the phase coherence of the carriers as their energies exceed the Fermi level. This strongly suggests the investigation of the excited carriers with energies well in excess of their thermal equilibrium energy as the dimensions shrink. In this thesis, the interactions of hot electrons in semiconductor and metal structures with deep submicron characteristic dimensions have been studied. Tunneling Hot Electron Transfer Amplifier (THETA) constructed by abrupt semiconductur heterojunctions is a perfect system to analyze the interaction of hot electrons with cold electrons and the other possible excitations in solids. Recently, it has been discovered that an electron multiplication effect took place in such devices under certain conditions and resulted in a transfer ratio of greater than
unity. In this work a novel fabrication technique has been developed. It would make it possible to utilize this effect for fabrication of a high frequency oscillator in the THz regime, in a future work. In addition, a kind of lateral THETA device has been constructed using a Two Dimensional Electron Gas structure. Electron multiplication effect for the first time has been observed in
2
DEG structures. Moreover, the dependence of the effect on parameters such as injection energy, emitter and collector barrier heights and electron transit length has been investigated. The other direction of the work has been the investigation of metal wires under extremely high current densities. A strong nonlinearity in conductivity is introduced when a free standing submicrometer wire is biased to heat upto very high temperatures. The geometry of two crossing wires has been investigated under this condition.K e y w o r d s : Gallium Arsenide, Two Dimensional Elecron Gas, Hot Elec tron, Nanostructure.
N AN O YAPILARDA SICAK ELECTRON ETKİLEŞİMLERİ
İsmet İnönü Kaya
Fizik Doktora
Tez Yöneticisi: Assoc. Prof. Recai Ellialtioğlu
Şubat 1997
Modern yarıiletken işlemleme ve atomsal ayrıntılarda kristal büyütme teknikleri ile nanometre boyutlarında aygıtların fabrikasyonu mümkün olmak tadır. Bu ilerlemeler yeni aygıtların geliştirilmesi olanaklarını açmasının yamsıra mezoskopik denilen bir yoğun madde fiziği dalının da doğmasına neden olmuştur. Düşük sıcaklık gereksinimi ve taşıyıcıların enerjisinin Fermi seviyesinin üzerine çıkarıldığında bağdaşıklığını yitirmesi nedeniyle mezoskopik fiziğin yakın gele cekte uygulama alanı bulması olası görülmemektedir. Ancak, bu nanoyapılarda yüksek enerjili uyarılmış elektronların davranışı yeni uygulama olasılıkları açması yönünden önemli olmaktadır. Bu tezde, mikronaltı boyutlarındaki yarıiletken ve metal yapılarda sıcak elektron etkileşimleri incelenmiştir. Yarıiletken heteroyapılarıyla gerçekleştirilen Tünelleyen Sıcak Elektron Transfer Yükselticisi sıcak elektron etkileşimlerini incelemek için çok uygun bir sistemdir. Kısa süre önce bu tip yapılarda, bazı durumlarda transfer oranının l ’in üzerine çıktığı elektron çoğalması etkisi gözlenmiştir. Bu çalışmada bu etkiyi kullanarak THz mertebesinde çalışabilecek bir osilatör yapımını mümkün kılabilecek bir fabrikasyon tekniği geliştirilmiştir. Ayrıca iki boyutlu elektron gazı yapısı kullanılarak elektron taşmımmm yanal olduğu bir sıcak elektron aygıtı da
tasarlanmış ve gerçekleştirilmiştir. Bu aygıt kullanılarak iki boyutta elektron çoğalması etkisi ilk kez gözlenmiş ve etkinin elektron enerjisine, engel yükseklikleri ve aralıklarına bağlılığı incelenmiştir. Çalışmaların bir başka yönü de yüksek akım yoğunluklarında mikronaltı metal tellerin elektriksel özelliklerinin incelenmesi olmuştur. Çok yüksek sıcaklıklara ulaşıncaya kadar gerilim uygulanan asılı metal köprü yapılarının iletkenliği doğrusal davranışından uzaklaşmaktadır. Çapraz geometride yapılan bu tür metal tellerin davranışları bu koşullarda incelenmiştir.
Anahtar
sö zcü k le r: Galyum Arsenit, İki Boyutlu Elektron Gazı, Sıcak Elektron, Nanoyapı.
I would like to express my gratitude to Assoc. Prof. Recai Ellialtioglu for his invaluable guidance and contributions throughout my graduate study and preperation of this thesis.
I would like to thank Prof. Igor Kulik for taking our attention to the problem of hot electron transport in metallic cross junctions and fruitful discussions. I wish to express my thanks to Dr. Simon Bending who provided the facilities and financial support during my visit to University of Bath where I studied on tunneling hot electron transfer amplifier structures. My sincere thanks are due to my friend Dr. Ahmet Oral for his help during this visit. I also would like to thank to Prof. Joachim Wolter for supplying the high mobility two dimensional electron gas wafer used in the fabrication of lateral hot electron devices.
I am grateful to the faculty and research assistants of the Department of Physics and especially the members of the Advanced Research Laboratory, Bilkent University for their help, valuable discussions and comments.
My special thanks are due to my wife Yeşim, for her patience, understanding and continuous morale support.
Contents
Abstract 1
Özet İÜ
Acknowledgement v
Contents "'^i
List of Figures viii
1 Introduction 1
2 Hot Electron Transport in Metals 8
2.1 Electron-Phonon Interactions in Metallic C ross... 11
2.2 Experimental Techniques 11
2.2.1 Fabrication of Devices ... 11
2.2.2 Measurement Techniques and Setup 13
2.3 Results and Comparison with T h e o r y ... 16
3 Vertical Hot Electron Transport in G aA s/A lG aA s Heterostruc
tures 26
3.1 Electron Interactions in G a A s ... 28
3
.2.1
A High Erequency Oscillator Making Use of the Multipli cation E ffe c t... ■ ... 32 3.3 A New Fabrication Route for THETA Devices to Implement THzO scilla tors... 33 3.3.1 Fabrication of D e v i c e s ... 35
3
.3.2
Measurement S y s te m ... 383.4 Results and Discussions 41
4 Lateral Hot Electron Devices 50
4.1
The Two Dimensional Electron G a s ... 504.2
Low Field Parallel Transport in Two Dimensional Electron Gas 53 4.3 Hot Electron Transport in 2DEG and Electron Scattering Mechanisms ... 59 4.3.1 Lateral Hot Electron Devices and Electron Interactions in
2
D E G ... 624.4
A Lateral Hot Electron Device to Investigate Electron Multiplication in
2
D E G 674.4.1 Fabrication of D e v i c e s ... 69 4.4.2 Measurement S e tu p ... 71
4.5 Results and Discussions 72
5 Summary and Conclusions 83
Appendix 86
6
.A Electron Beam Lithography86
Bibliography 92
Vita 99
List of Figures
1.1 Various hot electron transistor stru ctu res... 4
2.1
Electron heating experiment in a meal wire... 102.2 SEM view of a free standing metallic cross junction... 14
2.3 Schematic representation of the measurement setup and electrical connections... 15
2.4 Resistance of a free standing gold wire versus bath temperature. . 17
2.5 Current voltage characteristics for a single wire excitation... 18
2.6 Electron temperature distributions along the channels. 21 2.7 The calculated average electron temperatures... 22
2.8 The effect of the control current on the probe channel conductance. 23 2.9 Comparison of the temperatures on both wires as only one is biased. 24 3.1 The potential distribution in a THETA device... 27
3.2 The current-voltage characteristics for the THETA device shown in Figure 3.1... 29
3.3 The transfer ratios for a THETA with very low collector barrier. . 31
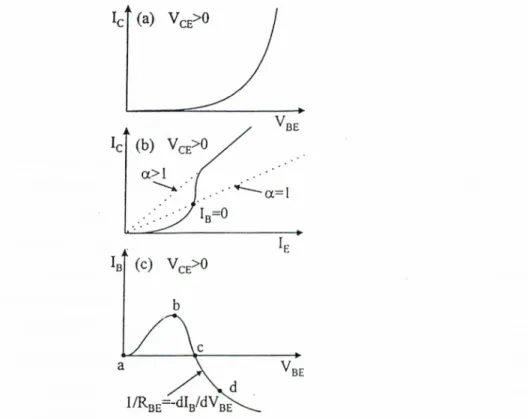
3.4 Current-Voltage relationships at various terminals of a THETA device with transfer ratio a > 1... 34
3.5 The growth schematic of the ion implanted THETA structure. . . 36
3.6 Schematic diagram of an oscillator structure... 39
3.7 Photograph of the completed devices... 40
3.8 Block diagram of current-voltage measurement set-up... 41
3.9 Block diagram of a sample connections... 42 3.10 T V characteristic for the Emitter-Base and Collector-Base at 4.2 K. 43
4.1
The2
DEG heterostructure... 51 4.2 Improvement of the 2DEG mobility in the last two decades. . . . 54 4.3 Variation with temperature of various scattering-limited mobilitiesin MD AlxGai^xAs! GaAs heterostructures... 55
4.4
Dependence of the 2DEG mobility on spacer layer thickness. . . . 56 4.5 Electron mobility versus electron density... 574.6
Mobility and electron density versus temperature for the 2DEG. . 58 4.7 Electric field dependence of 2DEG used in this work. 604.8
Electron velocity versus field in 2DEG ... 61 4.9 Transistor characteristics for a lateral hot electron device... 63 4.10 Hot electron transfer ratio for two opposing point contacts... 654.11
Experimentally derived electron-electron scattering rate in 2DEG.66
4.12 Modified Young’s double slit experiment...66
4.13 Calculated electron temperature variation in a2
DEG structure. .68
4.14 The SEM picture of the lateral hot electron device fabricated. . . 69 4.15 The schematic drawing of the lateral hot electron device investigated. 73 4.16 Conductance versus gate bias for the point contact ... 74 4.17 The schematic potential profile for the lateral hot electron device. 75 4.18 I /V characteristics for the lateral hot electron device... 76 4.19 Base current reversal in the lateral hot electron device... 77 4.20 The calculated transfer ratio... 784.21 Peak transfer ratio versus emitter gate bias. 80
4.22 Transfer ratio as function of injection energy... 81 4.23 The peak transfer ratio as a function base length... 82
6.1
Schematic diagram of SEM converted EBL sy stem ... 906.2
Close up view of a point contact written by the EBL system. . . . 91Chapter 1
Introduction
For the last 50 years hot electron transport has been a fruitful subject in the field of solid-state physics both for theory and experiments. This is mainly the result of the efforts made to meet the requirements of the rapidly growing semiconductor industry. Modern microelectronics has entered the submicrometer scale of miniaturization, and it can easily be seen that even a few volts in the applied voltage can lead to electric fields in the order of 10,000 У /c m and carrier drift velocities in the order of 10^ cm /s. These very high drift velocities form the basis of devices with operating frequencies approaching the THz regime. In most of the device applications and physics experiments the carriers are excited to have an energy well in excess of their thermal equilibrium energy. In some cases the carriers behave in a manner that can be associated with an elevated temperature, giving rise to the name hot carrier. The name is used more widely to refer to any highly excited carrier.
The hot electron concept was introduced in late 40’s during the studies related to the dielectric breakdown in insulators.^ After the discovery of transistor, the study of the nonlinear behavior of current-voltage characteristics was carried out in semiconductors. Later, experiments performed by superimposing other fields such as magnetic, strain etc. together with static electric field, enlarged the subject. After the availability of computers, the numerical methods were utilized for exact solution of the Boltzmann equation, and the ’’ Monte Carlo” method
was developed. These led to a better interpretation of experiments. In the same period, materials promising for application purposes such as, Si, Ge, GaAs and related IITV and II-VI compounds were systematically characterized.
The development of epitaxial growth techniques opened a new area of research centered around multilayered structures. In the last decade the field of semiconductor heterojunctions made a tremendous expansion. It is now possible to routinely make well characterized high quality interfaces, which are finding applications in novel device structures.
Using heterojunctions, one can inject carriers from wider-gap into narrower- gap semiconductors. The injected carriers are initially very hot, having an initial velocity as much as
10
times that of the saturated drift velocity, and one can study the detailed mechanisms by which they lose their excess energy and momentum and return to thermal equilibrium temperatures.Although they have wide area of applications and are inevitably used in semiconductor devices, there are very few electronic devices proposed which are fabricated from metals. The well established semiconductor industry will not allow introduction of totally new technologies for the electronics related applications for many years. Any new material system first should be able to integrate the existing silicon technology to grow and prove its superiority over the semiconductors. In the view of this fact the metals do not seem to have a chance to compete with semiconductors in electronics applications. However, the electron transport in metals are widely investigated for long time and many interesting phenomena were discovered in this very important material system.
Hot electrons in metals are studied through electron heating experiments. The electrical and thermal conductivity are studied in detail both experimentally and theoretically. Low temperature nonequilibrium measurements have been used to investigate the relaxation processes taking place. Nevertheless, with the improvement of submicron fabrication technologies different electrical and mechanical properties of metals with reduced dimensions are being discovered. In Chapter
2
of this thesis nonlinear current-voltage characteristics in a metallic cross junction is presented. The structure is originally proposed by Kulik^ asa new electronic device that has been expected to display transistor action due to the strong nonlinearity arising from the nonequilibrium phonons created by the injection oi hot electrons. Although the structure does not seem to be a competent device it is quite useful to investigate the electron-phonon interactions and transport in metals.
M e th o d s for G e n e ra tin g H ot C arriers: T h e R o le o f H e te r o ju n c tio n s
Chapter 1. Introduction
3
A carrier can be heated by several methods. In bulk semiconductors, the two most common methods are the application of electric or optical fields. In the former, electrons and holes are accelerated under the applied field and gain energy such that they occupy quantum states of the crystal for which the equilibrium Fermi function would be vanishingly small. In a semiclassical picture, the carriers in an electric field E accelerate along the band structure according to the rule that
h ^ k = - e E (1.1)
dt
until some scattering takes place. The scattering for acoustic phonon emission occurs on a time scale of r ~
1
ns and for optic phonon emission r ~1
ps. The mean free paths for such carriers depend sensitively on the carrier density, the electric field, and the lattice temperature, and they typically vary over the range 0.01 to1
fim. Optical absorption generates electron-hole pairs, provided that the dilference in energy between the electron in the valence band and that in the conduction band matches the optical absorption energy. For visible and ultraviolet light, the electrons may be excited high into the conduction bands, where they undergo energy relaxation processes on the time scale of1
ps. There are other methods for generating hot carrier distributions in bulk semiconductors. These include direct local heating (as with transient heat pulses), or using some injecting contact, such as a Schottky barrier at the surface of the semiconductor.With multilayers, there are new methods for generating hot electrons in semiconductors. One can form electrostatic barriers, such as the planar doped barriers, and the electrons that pass over such a barrier by thermionic emission
Planar doped barrier injector and analyser
A /\
/
____ _______________________________________
Tunnel injector, square barrier analyser
Graded gap injector, planar doped barrier analyser
Graded gap injector and analyser
F igu re
1
.1
: Various hot electron transistor structures(a) A hot electron transistor structure consisting of three heavily doped GaAs layers (emitter, base, and collector) separated by two energy barriers for electrons. During action, the emitter is forward biased to inject hot electrons, and the collector barrier is reversed bias to collect the hot electrons, (b) The conduction band profiles of various hot electron transistor structures that have been examined in the GaAs-AlGaAs materials system. Figure from Kelly.^
are initially hot in the post-barrier region (Figure
1
.1
). The potential heights can vary from a small fraction of1
eV, to several eV, depending on the doping density- thickness product. The observation of hot electron effects requires a structure where the shorter arm of the planar doped barrier potential triangle is rather shorter in length than the mean free path for a significant hot electron relaxation. Alternatively, heterojunctions involving two different chemical compositionscan be used to generate hot electrons. Here, carriers created in a wide- gap semiconductor gain a pulse of energy as they cross into a narrower-gap semiconductor, and the instantaneous velocity that they acquire can be very large. If a (relatively) thick barrier of height AE is interposed between two regions of the same composition, carriers can pass over the barrier by thermionic emission, with a characteristic T^exp(—A E Ik T ) temperature dependence for the current density. If the barrier between the two layers is sufficiently thin, electrons can tunnel through it, and this process has several advantages. First, the tunneling current has a much smaller dependence on temperature. It is possible to obtain hot electron distributions that are quasi-monochromatic, in that they have a spread in energy typified by a Fermi energy within a few meV rather than a wide spread of energies characteristic of thermionic emission over a barrier. Multiple thin barriers can be used to narrow the distribution even further. The tunnel current is generated by applying a bias across the tunnel barrier.
Hot Electron Spectroscopy by Transport Studies
Chapter 1. Introduction
5
During the research for a fast unipolar transistor, several multilayer structures were investigated in the m i d - 1 9 8 0 s . In Figure
1.1
the conduction band profiles of the multilayers involved are shown. They share the following characteristics: there are three conducting layers (emitter, base, and collector in the usual transistor nomenclature) separated by two barriers. In the early samples, the conducting layers were.GaAs, while the barriers could be formed electrostatically using the principles of the planar doped barrier and/or compositionally using AlGaAs layers of varying shapes that allowed thermionic currents to be generated. The transistor operates with the emitter-base barrier under forward bias and the base-collector barrier under reverse bias. If the differential resistance of the former is less than the latter, the transistor action takes place. A successful transistor must be fast, and so all possible RC time constants associated with switching a transistor on and off must be minimized. In particular, the conducting regions must have low resistance, and in practice a low base resistance is the most difficultto achieve. This is because of the other requirements for a high gain transistor. If a fraction a of the emitter carrier is actually collected, the ratio of the collector current to the base current, which is the current gain, has the value o :/(l — a). The challenge is to collect as high a fraction of the emitter current as possible.
The measurements of a are made as follows. The current-voltage characteris tics of the base-collector barrier are measured for different values of the forward bias on the emitter and hence the injected emitter current. The ratio A /c /A /^ ; is determined numerically. And these are transformed into a useful form by using a detailed analysis of the collector barrier height. The A le data at a given emitter bias are plotted against the energy of the barrier with respect to the Fermi energy in the base region. For a fixed emitter current, the differential increase in collector current from a differential lowering of the collector barrier.
Detailed simulations have been set up to analyze results obtained from many different experiments, with the emitter barrier height, the electron density in the base, and the base layer thickness being key variables. Several important processes can be identified by which injected hot electrons could loose their excess energy. First there is the emission of phonons, just as it occurs when electrons in bulk semiconductors are heated by strong electric fields and reach a saturated drift velocity. Secondly, because the base is doped, there are two types of electron- electron interaction. A single cold electron in the Fermi sea in the base can extract energy from a single hot electron. Alternatively, the hot electron can excite one of the (collective) plasmon modes in the electron gas of the base. Formalisms are set up for calculating the scattering rate once the frequency and energy-dependent dielectric function is obtained.
Tunneling hot electron transistors has been utilized successfully for investi gating the physics of hot electrons in semiconductors. The direct observation of ballistic transport and single longitudinal optical phonons in GaAs for the first time accomplished by use of this kind of structures. Recently, it has been found that, in tunneling hot electron transistors with very low collector barrier height a kind of electron multiplication occurs due to the interaction of hot ballistic electrons with the cold base electrons.^ This results in a transfer ratio in
excess of unity and negative differential resistance between the emitter and base contacts. Chapter 3 of this thesis is devoted to the investigation of this effect and a fabrication of a high frequency oscillator making use of this effect.
Parallel Transport in Two Dimensional Electron Gas
Chapter 1. Introduction
7
The patterning of Schottky gates above a two dimensional electron gas (
2
DEG) provides a way to tailor it laterally to perform huge variety of transport experiments. This is called split-gate technique and one of the applications is to produce a lateral hot electron transistor structure, by forming electrostatic barriers and separate 2DEG into three regions as in the conventional hot electron devices described above. At low temperatures this type of device could give quite high a base transfer efficiency and a gain. Furthermore, this system is very useful for studying the motion of ballistic electrons, but leakage currents at higher temperatures limit any wider applications.The flexibility of the devices fabricated with
2
D EG structures using split- gate technique lies in the capability of changing the barrier height by playing the bias on the gates. Therefore, they have advantages over the conventional hot electron devices where the barriers are formed by heterostructures. The device geometries can be designed and fabricated more easily to meet the requirements of the experiments desired. In Chapter 4 of this thesis a new design has been introduced for the observation of electron multiplication in2
DEG which provides more control on the device parameters to understand the mechanisms leading to this effect.Hot Electron Transport in
Metals
Energy relaxation in metal microstructures have been studied for some time by low temperature nonequilibrium transport measurements. In these experiments, a dc electric field E applied across the microstructure is used to heat the electrons above the lattice temperature. The electric field causes a current density J to flow through the metal and the power J.E is delivered to the electron system. In steady state this power is also equal to the power delivered to the phonons and to the substrate. These measurements provide information on the relaxation processes taking place in the metals. Recently, there have been various experiments studying the electron heating in metal wires®“’ ^ and free-standing metal w i r e s . H o t electrons injected in such structures relax their excess energy by several means. In metals, electron-phonon scattering causes the lattice temperature to rise resulting in a temperature dependent resistivity to be added to the residual resistivity as given by the Matthiessen’s rule, p = pr + Pph{T).
When T > Od, where $d is the Debye temperature, the phonon related resistivity varies linearly with T, whereas for T < it should obey the Bloch-Gruneissen T® law. Experimentally, however, the resistivity of normal metals does not exhibit such a simple universal dependence at low temperatures, since ppk depends only on temperature and pr depends only on sample perfection in clean metals. The
Chapter 2. Hot Electron Transport in Metals
T® law assumes that the Fermi surface of the metal is a sphere and neglects the Umklapp-processes, whereas experimental values of the exponent range between 4 and
8
for various metals.^® In a real metal, one must take into account the detailed electronic structure, i.e. the shape of the Fermi surface, and the phonon spectrum together with the screening properties of the electrons to obtain an accurate description of the electron- phonon coupling. Inelastic scattering of both electrons and phonons from impurities and defects may also influence the temperature dependence, dominating especially at very low temperatures.®’^®If hot electrons are injected into a metal film or a wire the excess energy will be readily absorbed by the phonons and the phonon distribution function will deviate from Planck distribution. Depending on the dimensions of the structure with respect to the dominant phonon wavelength one may have reabsorption of the non-equilibrium phonons by electrons, nonequilibrium phonon-thermal phonon scattering, or phonon-impurity scattering if the metal is not "clean” enough. In either case, the Lorentz constant L, which relates thermal and electronic conductivities in metals through the VViedemann-Franz law, k/ct = LT,
deviates^® from the Sommerfeld value Lo = (7rV3)(^B/e)^
There are many experimental and theoretical work for the case that there is an acoustical 'coupling to the s u b s t r a t e . I n the case of strong coupling the phonons in the microstructure is assumed to remain at the temperature of the substrate, which is the same as assuming that the electron-phonon scattering rate is much smaller than the rate of thermal energy loss from the metal to the substrate. For that case the inelastic energy loss rate from the electron gas has been calculated by Anderson et using a simple heat capacity argument, i.e.
R~p ~ Cei{T)fTin{T). They found the electron temperature Tg to be proportional to £ ’
2
/2
+p^ where p is the phonon dimensionality. Roukes et al.^ experimentally found that Te ~ E"^/^ for100
nm thick metal films deposited on single crystal sapphire.In the case of finite coupling to the substrate the situation is described by a bottleneck between the electron-phonon scattering and escape rate of the phonon from the structure to the substrate. The schematic representation of this case is
Microstructure
J E
I
E (V m-i)
F ig u re 2.1: Electron heating experiment in a meal wire,
a) A schematic representation of an electron heating experiment, b) Electron temperature versus electric field dependence where 77 is the parameter. Figure from Kanskar et al2^
shown in Figure 2.1 (a). Kanskar et alH calculated energy relaxation rate versus
Te for that case where coupling constant,
77
, is the parameter. They found that for not very small fields, strong coupling {rj < 1) gives field dependence approaching £5/2 while for weak coupling(77
> 1) Tg ~ Their theoretical results are shown in Figure2.1
(b).At low temperatures the rate of electron-electron scattering which relaxes the energy within the electron system is much higher than the electron-phonon scattering rate. When a dc electric field is applied to metal microstructures the energy of the electrons immediately gets its equilibrium distribution due to the very short mean free path for electron-electron scattering, /ee· However, at low temperatures the mean free path for electron-phonon scattering, which is associated with the energy relaxation from the electron system becomes comparable to the sample dimensions. For sample dimensions, L > l^p the transport is in dissipative regime and as sample dimensions reduced below l^p
transport becomes nondissipative. Kanskar et al}^ observed the crossover from dissipative to nondissipative transport as the wire length is changed from L > l^p
Chapter 2. Hot Electron Transport in Metals
11
to L < lep at temperatures T <
1
K. For a given wire as the electric field is increased the change in resistance, hence, in electron temperature Tg shows a crossover from stronger E dependence to weaker E dependence.2.1
Electron-Phonon Interactions in Metallic
Cross
In a recent work by Kulik^ it has been predicted that in a geometry of two metal wires crossing each other the nonlinearity in the conductance of one channel can be controlled by the current on the other channel. The coupling between the channels has been calculated by considering the reabsorption of nonequilibrium phonons generated at the crossing point. During this thesis, these predictions have been attempted to be verified experimentally. First experiments have been done with a gold cross junction deposited on Si surface. Although a nonlinearity is observed both in longitudinal and cross conductance, the measured effect was not as strong as the theory predicted. This deviation has been attributed to the heat leak to the substrate material, since in the calculations perfect thermal isolation from the substrate has been assumed. Therefore to perform experiments closer to the theoretical assumptions, new processing techniques were developed and a free standing metal cross junction has been fabricated.^' The change in conductance structure as functions of the currents in both channels has been measured in the diffusive regime; that is, the dimensions are large compared to the electron mean free path, /«.
2.2
Experimental Techniques
2.2.1
Fabrication of Devices
Substrate Preparation
The substrate for the samples was a Si(lOO) wafer. For the fabrication of free standing structure SiOi: was deposited on the surface by Plasma Enhanced
Chemical Vapor Deposition (PECVD) technique at temperature of 100 °C, chamber pressure of 300 mTorr and rf power of 10 W. 2% SiH
4
in N2
, and N2
O have been used as the process gases. A 0.5 pm thick SiOj; film has been grown in 30 min.Metal Cross Junction
The minimum dimensions of the structure requires submicron resolution in fabrication hence electron beam lithography is utilized (See appendix).
• PM M A is spun on the sample surface at 10000 rpm which gives a resist thickness of about
0.2
^m.• Resist is prebaked in an oven at 165 °C for 30 min.
• The cross pattern exposed using the e-beam lithography system. The wire lengths were 3.6 pm, 5.5 pm and 9.3 pm with varying widths from 0.5 pm
to
1.2
^m.• Exposed parts of the PMMA developed in 1:3 MIBK:IPA solution for 45 s are then rinsed in isopropanol and DI water.
•
1000
A
99.99% pure Au is thermally evaporated onto the sample surface. • Unwanted metalization is lifted-off by immersing the sample in acetone foran hour.
Bonding Pads
T i / Au pads need to be placed at the ends of the metal cross wires for electrical connections.
• AZ5214E photoresist is spun at 6000 rpm to give a
1.2
pm resist thickness.• Resist is prebaked on hot plate at
110
°C for 60 s.• Pad patterns on the home made optical mask are exposed to 5 m W /cm^ of UV light in the mask aligner for 60 s.
Chapter 2. Hot Electron Transport in Metals
13
• Photoresist is treated by a chlorobenzene soak for 12 min before development.
• Exposed parts of the photoresist are developed in 1:4 AZ-400K:DI water.
• Residual resists on the developed parts are removed by Reactive Ion Etching in O
2
plasma, at process pressure of 8.10“ ^ mbar and rf power of 18 Watts for2
min.•
100
A
Ti and2000
A
Au are thermally evaporated onto the sample surface. • Unwanted metalization lifted-off by immersing the sample in acetone forfew minutes.
Free Standing Bridge
At that level of fabrication the metal cross structure is completed, but the structure is in contact with the SiOi material. Inserting the sample into a 1:9 HF:H
20
solution for10
s etches the SiOj, material isotropically down to the Si substrate. This removes all of the SiOi underneath the wires so that the cross wires form an air bridge. The sample is rinsed in DI water to stop etching and dried carefully in N2
gas jet.The individual devices were separated by dicing and then epoxied on alumina substrates. Gold wire bonding is used to connect the pads on the silicon chips to the gold pads on the alumina.
A scanning electron microscope picture of a typical device is shown in Figure 2.2.
2.2.2
Measurement Techniques and Setup
Extreme care was taken during measurements in order to protect the samples from being destroyed by electrostatic discharge. A home made connector is used to make the electrical connections to the pads on the alumina substrate to avoid soldering which may damage the samples too. A usual method to overcome the electrostatic discharge problem is to put shunt resistors parallel to
F ig u re
2
.2
: SEM view of a free standing metallic cross junction.The gold cross bridge is 0.5 pm above the substrate. The cross and the wide leads were defined by e-beam lithography. The feature at the right upper corner of the figure is the extension of the Ti/Au pad registered by using optical mask.
the wires. However, in our case the resistance of the wires are very small and use of shunt resistors could result in inaccuracies in the measurements. Certainly, measurement of the unprotected devices needed excellent grounding of people performing the experiment and any tool used during the sample mounting. The yield for measurement was less than 50%; that is more than half of the devices were damaged before fully characterized.
Although the cross structure of the devices is symmetrical, that is all four arms are identical to each other one of the crossing wires, which is named ’probe wire’ , has two connections on each side to allow four probe measurements. The other wire is named ’cross wire’ or control wire, interchangeably, and is excited during the cross conductance measurements (see Figure2.3).
Low temperature measurements are performed using a Janis closed cycle refrigerator which can go down to
8
K. The samples were mounted on the cold head by using GE varnish to assure good heat conduction. TemperatureChapter 2. Hot Electron Transport in Metals 15
F igu re 2.3: Schematic representation of the measurement setup and electrical connections.
dependent resistance was measured in the region between
8
K and room temperature by applying Ip = 3 mA current bias to the probe terminals of the devices. This value of current is small enough not to introduce any electrical heating to the sample as can be seen from Figure 2.5. Current voltage characteristics is still in the linear regime for this bias value. The voltage on the probe wire, hence, the resistance of the probe wire, V p //p , is measured by four wire method to discard the lead resistances which are compared to the resistances measured. Hewlett Packard 4142B Source Monitor Unit is used to perform electrical measurements. The electrical connections and measurement setup are shown in Figure 2.3.The longitudinal conductance (Ip vs Vp) and cross conductance (Gp vs C)
measurements were performed both at
8
K and room temperature. Depending on the wire sizes the maximum allowed current for the measurements rangesfrom 30 to 70 mA. Above that value the wires are melted and broken due to electrical heating. The measurements are performed at current biases very close to these values to be able to see the highly nonlinear regime. For the cross conductance measurements two currents on each wire has to be applied and these currents should not leak to the other wire at the crossing point. This is achieved by connecting the both ends of the control wire to two independent current sources adjusted to identical currents of opposite directions. During the cross conductance measurements conductance of the probe wire was measured with respect to both probe and control currents.
2.3
Results and Comparison with Theory
Figure 2.4 shows the temperature dependence of resistance of the probe wire with no current in the control channel. This is the complete equilibrium case, in which the bath, the lattice and the electron temperatures are uniform and the same, since the current during the resistance measurements was very small, < 3 mA. The symbols represent the measured data, and the solid line is the plot of the expression^
+
Pi[l + /3{T/0
d
TY^^]
(2
.1
)which is in accord with the Mattheissen’s rule with pr = po+pi- Here L is the wire length, A the cross-sectional area, ^£>=170 K for gold,^® and the fitting parameter /? is found to be 3.2 x 10^. This clearly gives T® dependence for low temperatures and linear dependence for high temperatures. However, our data do not agree with the Bloch-Gruneissen law in the region 8 < T < 20 K, this deviation is quite difficult to explain since there exists experiments in the literature showing much better agreement.
The room temperature resistivity was calculated to be 4.9 x 10“ ® i)m in agreement with the literature. It follows from the product^® pig = 8.3 x 10“ ^® that the electron mean free path at
8
K can be obtained as /e=44 nm using the8
K resistivity value of 1.9 x 10“ ® flm. Using the values for longitudinal and transverseChapter 2. Hot Electron Transport in Metals
17
F ig u re 2.4: Resistance of a free standing gold wire versus bath temperature.
The measurements were taken in the 0-3 mA current region in order to avoid heating the wire. The solid line is a fit to Equation 2.1, saturating to the residual resistance of 2.4i2 at low temperatures. The symbols denote experimental data.
sound velocities in gold/*^ vi = .3.42 x 10^ m /s and vt = 1-32 x 10^ m /s, one estimates the dominant phonon wavelengths \doml2· = hvj/^ikT at
8
K as 5 nm and2
nm, respectively. Thus, the number of phonon modes is between 20 and 50, corresponding to 3D phonons. The metal is in the clean limit, since qle > 1, where q = kET/huj is the typical phonon wavenumber. The residual resistivity ratio, p(293)/p(0), is found to be ~3.A nonlinear behavior is observed when the current is increased in the wire allowing hot electrons to be generated. Typical plots of probe current Ip and differential conductance, dlp/dVp as functions of the voltage Vp across the probe wire, for a control current of Ic = 0, are shown in Figure 2.5. The solid curves are for the bath temperature at
8
K and the dashed curves are those of room temperature. The I /V characteristics clearly depart from Ohm’s law, and the.5 ^ .3 Q. > ■a
i
-.1
0.0100
200
Vp (mV)
300 <E
F ig u re 2.5: Current voltage characteristics for a single wire excitation.
Probe current and differential probe conductance as functions of voltage drop across the channel. There is no current in the control channel at 8 K (solid line) and at room temperature (dashed line).
onset of this departure is faster for the low temperature case, since the number of thermal phonons is much smaller than that at room temperature. Therefore, the effect of the nonequilibrium phonons, emitted by hot electrons at
8
K, for whichkT < 1 meV, becomes observable at lower electron currents, although electrons have lower energies for the same current at
8
K. Moreover, as expected, the differentia.1 conductance is higher initially at8
K and the change is much steeper with respect to the room temperature curve. There is an excellent agreement with the conductance characteristics calculated by Smith et al}^From the data of Figure 2.5, the resistance can be calculated as a function of the voltage developed along the probe channel and using the curve in Figure 2.4 as the thermometer. Therefore the average probe wire temperature can be obtained with respect to probe voltage. In the experiment overall resistance of a
C h a p ter 2. H o t E lectro n Transport in M eta ls 19
wire is measured on which a nonuniform temperature and resistivity distribution develops due to a current injected into the wire hence, the measured resistance is related to the average temperature of the wire in the linear regime of the resistivity-temperature characteristics. Assuming that the wire has a uniform cross section, the temperature distribution will be an inverted parabola^®“^^ given by23
T I M = - x^)
(
2
.
2
)
where e is the electronic charge, kg the Boltzmann constant, E the electric field and L the wire length. At the center, a: = L /
2
, one has a maximum,T l{x ) = T:- + (2.3)
where V = EL and a = (\/3/27r)(e/^B) = 3200 K /V . For small bath temperatures, the dependence becomes, = otV. The average temperature for a single wire is obtained by taking the integral of Tg{x) over the length, divided by the length, as
- 1
(0
) (2.4)
where ^ = aVJTyj.' When V is extremely small Tu, = Tb and which yield Tu, = Tb justifying the use of Figure 2.4. Note, however, that above about 10 mV, we can ignore Tb{=S K), and take Tyj — aV for which =
7
t/2
. The error is less than 3% for10
mV and becomes much smaller as the voltage drop increases. Hence, in the presence of hot electrons the average electron temperature is linear in V,(2.5)
where the slope is 2513 K /V for a single wire.
In the case of a cross-junction with two wires of length Li and L2, one must include a coupling term in the temperature distribution expressions, the indices
1
and p, as well as indices2
and c are used interchangeably in the following expressions. and T /(x ) = Ti + a X i l - -6
b-r lW = n " +
i l -
+
6
b
-(
2.
6)
(2.7)satisfying r i ( ± X i /
2
) = T2{ ± L2l2) = Tb, where the origin is taken at the crossing point and the coupling coefficient b can be obtained from the boundary conditions T i(0
) = T2
(0
) = Ths, that give b — [a^ I2){V^ — V2 )· So, the hot spot temperature becomesT l = n + \ + v i ) (2.8) that is independent of the wire lengths. Figure 2.6 shows the temperature distributions Tp(x) and Tc{y) with respect to normalized half lengths \x\!Lp and
— \y\lLci respectively, for various values of Vp and Vc-
The average temperature in the branches are found as
^ _ T b v { n . - T b )
^
2
^8
32aFi. -i(roiV x\ , . _ x ( { ^ - r ) a V i
(2.9)
for the probe wire, where r =
1
— and 9 = + r'^oi^V^ and similarly as „ n , r ' ( T * , - r , )8
. /'( 4 - r ') a \ 4 '|sm
( —
j + s m
[
---
j,
--- j j
_______________(
2
.
10
)
for the control wire, where r' = 1 — IV2 and 9' = As a special case, we consider Vi = V
2
= F or r = r' =0
, that leads to=
1
^ /sin ^T}'C h a p ter 2. H o t E lectron Transport in M eta ls
21
Normalized Half Length
F ig u re
2
.6
: Electron temperature distributions along the channels.Left half shows control channel, and the right half shows the probe channel in a metallic cross junction for various control and probe voltages.
where r] = ocV/Ths. and + a^V^. Then, for not too small voltages but for small Tb, we get
T = \ n ^ ^ - a V (
2
.12
)which is exactly the same expression for a single wire, Equation 2.5. This is expected, because there is no heat exchange between the wires and so they act like two isolated wires.
Another special case is when 14 = 0; that corresponds to C = 0 in the experiment. Letting r =
1
in Equation 2.9, for not too small 14, we have(raVi/0) = 1/3, that results in
0
) 3 600 TO0
) CL £0
) H* 400 o UJ0
^200
0
> < |Tb=293 K| . Vc=Vp Vc=o • - - . - ,Tp experiment 0.1 0.2 Vp (V) 0.3F igu re 2.7: The calculated average electron temperatures.
Temperature in both wires given as a function of probe voltage for the special cases of Vc = Vp (upper solid curves), and Vc = 0 (middle and lower solid curves) at bath temperatures of (a) Tb = 8 K and (b) T& = 293 K. Corresponding experimental plots o f effective probe temperature versus probe voltage (dotted curves) were computed from the data presented in Figure 3, using the resistance characteristics shown in Figure 2.
with a slope of
2000
K /V . On the other hand, when V2 distribution in the control channel will be given by0
, the temperatureTM
=
-
f
Lli/l
2which will average to
^ 4 ( r ^ - ri>)
(2.14)
.3q2V,^ (2.1.5)
which goes to Th in the limit Vi = 0 and is proportional to (\ /2 /3 )q!Vi for large values of V\ with a slope of 1508 K /V . Calculated average electron temperature versus probe voltage plots, corresponding to K: =
0
and Vc = Vp, and the dotted curves calculated from the experimental resistance data (with/2
=0
) for the bath temperatures of =8
K and Tt = 293 K are illustrated in Figure 5(a) and 5(b), respectively. Note that the temperature values and the slopes of the experimental curves are smaller than those of the calculated middle curves in theC h a p ter 2. H o t E lectro n Transport in M eta ls
23
F ig u re
2
.8
: The effect of the control current on the probe channel conductance.Differential conductance is given at various probe currents. Switching o f T from 0 to 20 mA would result in a 28% reduction in the probe conductance at Ip=5 mA.
linear regions. This discrepancy may be due to the fact that we did not take into account the widths of the wires in our calculations. In other words, the size of the interaction region and accordingly the cooling, i.e., the amount of heat transfer out of the probe wire are larger in the experiment.
Now, if we fix the probe current to a finite value and vary the control current, we observe a decrease in the conductance of the probe channel, Gp. This is not a linear change, as shown in Figure
6
, where the measurements were taken at8
K.At Ip = 1 mA, initially, the hot spot temperature, Tks·, is at bath temperature, and the probe conductance is large. As we increase /c, T/i« increases and accordingly, the resistance of the probe wire increases; i.e., Gp decreases. If we set Ip to a higher value, we start out with an intermediate lattice temperature, so the effect of Ic on Gp becomes less. At Ip = 31 mA, both wires are already hot and the
.7
.8
.9 1.0 1.1 1.2 1.3
WIRE WIDTH (|um)
F igu re 2.9: Comparison of the temperatures on both wires as only one is biased.
The average temperature of the probe wire Tp, for average cross wire temperatures, Tc, of 100 K, 200 K, 400 K and 450 K versus (a) wire width and (b) wire length.
variation of C does not yield much influence. In other words, the larger current dominates the conductance of the whole device.
The experiment has been repeated with samples of different sizes keeping the symmetry of the crosses; i.e., Lp = Lc and Wp = Wc- Using the cross conductance data the average temperature on the both wires calculated for 1 mA bias current on the probe wire and control currents on the cross wire for several devices of different dimensions. The cross current is chosen such that the average temperature of the cross wire, Tc, reaches the temperatures 100 K,
200
K, 400 K and 450 K. For these values the average temperature on the probe wire, Tp, has been calculated from the resistance versus temperature data shown in Figure 2.4.As can be seen in Figure 2.9(a) and (b) Tp gets closer to the Tc, as Tc is increased for narrow and long wires. In other words, the temperature distribution of the cross structure is more uniform for longer wires and narrower wires, certainly for the range of dimensions given. This indicates that as the wire width is increased or wire length is decreased the thermal coupling of the probe wire
C h a p ter 2. H o t E lectro n Transport in M eta ls
25
to the bath gets stronger. Indeed, this is not a straightforward conclusion since the coupling between the wires is also expected to increase for wider wires. This result must be due to a trade off between these two effects.
These results can be compared to that of obtained with cross junction deposited on the Si surface to get an idea on how thermal coupling affects the nonlinearity. As it can be deduced from the Figure2.5 and Figure
2
.8
, the conductance of the probe wire is reduced to its 25% for the longitidual bias and 26% for the cross bias in the free standing bridge. While, the corresponding values for the thermally coupled junction are measured to be 48% and 72%, respectively. The difference in the reduction of the conductances for the latter proves that the temperature distribution on the cross junction is not as uniform as the free standing bridge junction. Because, for the thermally coupled case, the phonons escape from the cross wires to the bath not only at the wire ends but also at the wire-substrate contact.In conclusion, a new technique is developed for the fabrication of free standing metallic wires. The theory on the nonlinear conductance behavior of metallic submicrometer cross-junctions in the diffusive regime is verified. The experimental results obtained from the devices of various dimensions are in good agreement with the predictions. The strong coupling between the cross channels was studied extensively, revealing that the larger current dominates the conductance of the whole device. The proposal of utilizing the device as a transistor^ does not seem to be very realistic since the principle of operation does not yield current amplification. Because the stronger current always dominates the other one and the control of a large current with a smaller becomes impossible. However, the structure is useful for investigating the electron-phonon interactions and phonon escape mechanisms. A possible direction could be investigating the effect at frequencies up to 10^ Hz. Such experiments might provide rich experimental data related to the electron-electron and electron-phonon relaxation rates.
Vertical Hot Electron Transport
in G a A s/A lG a A s
Heterostructures
The ballistic electrons traversing a thin GaAs layer are for the first time directly observed using a Tunneling Hot Electron Transfer Amplifier (THETA) device. Devices of this type which are constructed of abrupt heterojunctions, was proposed by Heiblum in 1980^'* and first fabricated by Yokoyama et and then by Heiblum et al.^ with GaAs-AlGaAs heterostructures.
In Figure 3.1, the energy diagram of the device fabricated by Heiblum et
is shown. The structure had been grown using MBE. The thin AlGaAs layer on the left is placed between two - GaAs layers. Because of the band discontinuity between AlGaAs and GaAs, a tunneling barrier for the electrons is formed. The left GaAs layer is called the emitter (E) and the next GaAs layer the base (B). Biasing the base positive with respect to the emitter will cause electrons to tunnel from the emitter and emerge into the base with an excess energy equal to еУвЕ- The base is made very thin to allow the injected electrons to cross it with minimum chance for collisions. The collector (C) is separated from the base by another AlGaAs layer which is made relatively thick. This AlGaAs layer prevents the equilibrium electrons in the base from entering the collector even
C h a p ter 3. Vertical H o t E lectron Transport in G a A s /A l G a A s H etero stru ctu res27
E M IT T E R BASE COLLECTO R
F igu re 3.1: The potential distribution in a THETA device.
An energy versus distance diagram of the heterojuction device for the F electrons. Typical voltages for the normal operating conditions are applied. The dashed line describes the potential distribution in the collector region for negativeVcB· Figure from Heiblum et al.^
when there is substantial collector bias Vc b- However it allows the injected hot electrons which traverse the base to surmount the collector barrier. Therefore the collector barrier serves as a normal-energy high pass filter and its height can be adjusted by biasing the collector with respect to the base. To reduce the quantum mechanical reflections at the B-C interface, the A1 concentration in the collector is graded on the base side.
At low temperatures the thermal currents above the barrier are small enough and tunneling current dominate. Figure 3.2 (a) shows the collected current as a function of Vcb for several values of Ie· Without injection, Ic is negligably small for Vqb < I V . Then it rises because of tunneling of the base thermal electrons through the resultant triangular barrier. At a given injection current and Vcb >
0
, the collector current is related to the emitter current by Ic = oJe·, where a is the transfer ratio. As Vcb is increased the barrier height, </>c, decreases as a result of the interface grading and the applied fleld. This causes a to increase.The device then behaves as a transistor.
The maximum energy of ballistic electrons is eVsE above the Fermi level in the base upon injection. This energy should be equal, at the threshold condition for current collection to (f>c — ( + \ eVcB |~^c + A (the ballistic condition). Here X is the Fermi-level position with respect to the conduction band edge in the n'^-GaAs, Sc is a measure of the band bending of the accumulation layer in the collector and A is the shift of the peak of the electron energy with respect to Fermi-level at the emitter. The energy of the collected electrons satisfy this condition which proves the ballistic transport of the electrons.
This structure allows fundamental studies of the dynamics of non-equilibrium carriers in semiconductors. For negative collector voltage (as shown by the dashed line in Figure 3.1) the effective barrier height (f)c for electrons in the base depends linearly on Vc b- If one measures the dependence of the collector current Ic = n(E±)vji(E)dE_i on the Vcb at a fixed emitter current and plots the derivative of Ic with respect to (f>c (or Vc b) the resulting conductance curve
Gc will be proportional to the number of electrons as a function of F'x (the energy of the electrons associated with their momentum normal to the barrier). This dependence shown in Figure 3.2 (b). The probability for an injected electron to cross the base layer and be collected over the collector barrier reflects the total cross section for its scattering due to mainly the base electrons, impurities and LO phonons (for injection energies above the LO phonon energy).
3.1
Electron Interactions in GaAs
There are various scattering mechanisms, such as polar optical scattering, deformation potential scattering, piezoelectric scattering, intervalley scattering, impurity scattering, carrier-carrier scattering, and alloy scattering.
Among the variety of phonons in GaAs, the longitudinal optical phonons (LO phonons) are coupled most strongly to low energy electrons. Electrons with wave vector k will scatter via phonons with wave vector q to k' (q = k — k') with a probability proportional to |q|“ ^, thus preferring to maintain their original
C h a p ter 3. Vertical H o t E lectron Transport in G a A s /A l G a A s H etero stru ctu res29
VcB (mV) 60mV
F ig u re 3.2: The current-voltage characteristics for the THETA device shown in Figure 3.1.
The collector current, Ic (a) and conductance, G c (b) as a function o f Vc b- The curves in (b) represents the momentum distributions o f the ballistic electrons vtrhich are similar to the number distribution n(E), assuming the electron velocity at the injector is almost constant over the 60 meV distribution spread. From Heiblum et al.^
direction. The q = 0 LO phonon energy in GaAs has been measured via neutron scattering^® and inelastic t u n n e lin g ,a n d is huio — 36 meV. At low temperatures, when the phonon occupation number is small, scattering events are mostly due to phonon emission which is possible only when the electron energy exceeds the lowest unoccupied energy state by at least 36 meV.
THETA devices are utilized for the first time to observe the emission of a single LO phonon by Heiblum et al?^ They constructed a collector barrier which was considerably lower than hoj[^o to enable electrons with energy less than hujio
to pass, but sufficiently high to prevent those hot electrons that lost Uuio from passing. The injected energy distribution should be narrow enough to be able to see the features in the energy versus transfer ratio curves. Therefore, emitter barrier is as thick as 50 nm which gives an energy distribution with full width at half maximum of about 4 meV. Fawcett et calculated the LO phonon emission rate in GaAs as:
1
e^m'^ /^ h u J L Oj
J _ _1
t