R E S E A R C H A R T I C L E
Open Access
SIP1 is downregulated in hepatocellular
carcinoma by promoter hypermethylation
Tolga Acun
1, Emin Oztas
1,2, Tamer Yagci
1,3*and Mustafa C Yakicier
1,4*Abstract
Background: Smad interacting protein-1 is a transcription factor that is implicated in transforming growth factor-b/bone morphogenetic protein signaling and a repressor of E-cadherin and human telomerase reverse
transcriptase. It is also involved in epithelial-mesenchymal transition and tumorigenesis. However, genetic and epigenetic alterations of SIP1 have not been fully elucidated in cancers. In this study, we investigated mutations and promoter hypermethylation of the SIP1 gene in human hepatocellular carcinomas.
Methods: SIP1 expression was analyzed in HCC cell lines and primary tumors in comparison to normal and non-tumor liver tissues by using semi-quantitative RT-PCR, quantitative real-time RT-PCR and immunohistochemistry. Mutation and deletion screening of the SIP1 gene were performed by direct sequencing in HCC-derived cells. Restoration of SIP1 expression was sought by treating HCC cell lines with the DNA methyl transferase inhibitor, 5-AzaC, and the histone deacetylase inhibitor, TSA. SIP1 promoter methylation was analyzed by the combined bisulfite restriction analysis assay in in silico-predicted putative promoter and CpG island regions.
Results: We found that the expression of SIP1 was completely lost or reduced in five of 14 (36%) HCC cell lines and 17 of 23 (74%) primary HCC tumors. Immunohistochemical analysis confirmed that SIP1 mRNA downregulation was associated with decreased expression of the SIP1 protein in HCC tissues (82.8%). No somatic mutation was observed in SIP1 exons in any of the 14 HCC cell lines. Combined treatment with DNA methyl transferase and histone deacetylase inhibitors synergistically restored SIP1 expression in SIP1-negative cell lines. Analysis of three putative gene regulatory regions revealed tumor-specific methylation in more than half of the HCC cases.
Conclusions: Epigenetic mechanisms contribute significantly to the downregulation of SIP1 expression in HCC. This finding adds a new level of complexity to the role of SIP1 in hepatocarcinogenesis.
Background
Hepatocellular carcinoma (HCC) is one of the most lethal cancer types worldwide and also the most com-mon type of liver cancer [1-3]. The exact mechanisms that drive hepatocarcinogenic processes are not yet completely understood. Identification of genetic and epi-genetic changes involved in hepatocellular carcinoma development is of high interest for a better understand-ing of this aggressive malignancy.
Smad interacting protein-1 (SIP1, also known as ZEB2) is encoded byZFHX1B at chromosome 2q22 and is a two-handed zinc finger transcription factor that contains a central homeodomain as well as
CtBP-binding and Smad-interacting domains. SIP1 has been shown to act predominantly as transcriptional repressor but can also act as transcriptional activatorin vivo [4-8]. SIP1 was originally identified in a transforming growth factor-b/bone morphogenetic protein (TGF-b/BMP) sig-naling pathway by its binding to the MH2 domain of receptor-activated SMADs [9]. SIP1 has been thoroughly studied for its role in repressing E-cadherin expression, which is a central event in the epithelial-to-mesenchy-mal transition (EMT) [5-7,10,11]. Accordingly, an ele-vated SIP1/E-cadherin ratio was shown to correlate with invasive disease and poor prognosis in gastric, pancrea-tic, esophageal and ovarian carcinomas [12-15]. Overex-pressed SIP1 also caused resistance to DNA damage-induced apoptosis and correlated with poor survival in patients with bladder cancer [16]. In contrast, only a few studies exist with regard to the role of SIP1 in
* Correspondence: [email protected]; [email protected] 1
Bilkent University, Department of Molecular Biology and Genetics, 06800 Ankara, Turkey
Full list of author information is available at the end of the article
© 2011 Acun et al; licensee BioMed Central Ltd. This is an Open Access article distributed under the terms of the Creative Commons Attribution License (http://creativecommons.org/licenses/by/2.0), which permits unrestricted use, distribution, and reproduction in any medium, provided the original work is properly cited.
suppressing tumorigenesis. For instance, repression of human telomerase reverse transcriptase (hTERT) expres-sion in breast and liver cancer cells was shown to be partly mediated by SIP1 [17,18]. Also, by directly inhi-biting cyclin D1, SIP1 caused G1 arrest in squamous carcinoma cells [19].
SIP1 was strongly expressed in, and with another transcriptional repressor, SNAIL, increased invasion of HCC cells [20]. We recently reported an immunohisto-chemistry study on tissue arrays and described decreased SIP1 levels in a group of tumors, including HCC [21]. In mature hepatocytes in vitro, TGF-b induces EMT by downregulation of Claudin-1, which is also associated with upregulation of SIP1 and SNAIL and downregulation of E-cadherin [22]. Our recent observations also implicatedSIP1 as a candidate regula-tor of replicative senescence in HCC cells [18]. Taken together, these findings indicate that SIP1 may play a role in hepatocarcinogenesis.
Epigenetic regulation of SIP1 expression by miRNAs [23-26] and a natural antisense transcript (NAT) [27] were recently described. Studies on the promoter methylation of SIP1 were also reported. The SIP1 gene was found to be hypermethylated and silenced in a poorly metastatic breast cancer cell line [28]. In a more recent study,SIP1 downregulation in pancreatic cancer was shown to be mediated through promoter hyper-methylation [29]. However, genetic and epigenetic mechanisms regulatingSIP1 expression have never been studied in HCC.
In the present study, we investigated the expression of SIP1 at genetic, epigenetic and protein levels in a series of HCC cell lines and primary tumors. Downregulation of SIP1 in HCC cell lines and tumors was found to be mediated by aberrant promoter methylation. Therefore, epigenetic inactivation ofSIP1 may play a critical role in hepatocarcinogenesis.
Methods
Cell lines and patient samples
DNA samples from 39 pairs of HCCs and tumor-adja-cent normal tissues were used; these archival materials have previously been described [30]. HCC-derived SNU449, SNU475, Mahlavu, SNU423, SNU398, SK-Hep1, Focus, SNU387, SNU182, Hep40, Huh7, PLC/ PRF5, Hep3B and hepatoblastoma-derived HepG2 cell lines were studied.
TissueScan Liver Cancer Tissue qPCR Panel I was purchased from Origene Technologies (Rockville, MD). Each plate consisted of pre-normalized cDNAs derived from 48 liver samples covering eight tumor-adjacent normal, 23 HCC (grade I, II, IIIA, IV), three cholangio-carcinoma, one adenoma and 13 non-tumor lesions of the liver. (Additional file 1).
Fifteen formalin-fixed and paraffin-embedded liver tis-sues deriving from two normal, one HBV carrier, three chronic hepatitis B, three chronic hepatitis C, three cir-rhosis and three HCC cases were obtained from the Department of Pathology of Gulhane Military Medical Academy in Ankara, Turkey, upon the favourable deci-sion of ethics committee of Gulhane Military Medical Academy. An HCC tissue array consisting of 61 tumors and five normal cases was purchased from Biochain (Hayward, CA). A total cell lysate of a normal liver tis-sue was kindly provided by Dr KC Akcali.
Multiplex semi-quantitative RT-PCR
Total RNA was isolated from cell lines using NucleoS-pin RNA II (Macherey-Nagel, Germany) as indicated by the manufacturer. Reverse transcription was per-formed with Revert Aid First Strand cDNA Synthesis kit (Fermentas, Lithuania) according to the manufac-turer’s instructions. Multiplex semi-quantitative RT-PCR was performed by using SIP1-specific primers (SIP1-RTF and SIP1-RTR) and GAPDH-specific pri-mers (GAPDH-RTF and GAPDH-RTR). Primer sequences are given in the supplementary information section (Additional file 2).
Quantitative RT-PCR
Quantitative analysis ofSIP1 transcripts was performed by real-time RT-PCR on cDNAs from the TissueScan liver cancer tissue qPCR panel I (OriGene, Rockville, MD) according to the manufacturer’s instructions and as previously described [31]. Finnzymes DyNAmo™ HS SYBR Green qPCR kit (Finnzymes, Finland) was used and samples were run on a Stratagene MX3005P™ real-time PCR system (Stratagene, La Jolla, CA). The TBP gene was used as an internal control [32,33] and relative levels ofSIP1 transcripts were measured by a modified ΔΔCt formula [31,34]. Statistical analyses were per-formed by the Student’s t test.
Western blotting
Western blotting was performed as previously described [21]. Briefly, total cell lysates from SNU398, Huh7, Hep40 and SNU182 cell lines were prepared in NP-40 lysis buffer [50 mM Tris-HCl pH 8.0, 150 mM NaCl, 1% Non-idet P40 (v/v) and a cocktail of EDTA-free protease inhibitors (Roche Diagnostics, Mannheim, Germany)]. Protein content was measured with the Bradford assay. Equalized lysates were run on 8% SDS-PAGE and then transferred onto polyvinylidene fluor-ide (PVDF) membranes using a wet transfer apparatus (Bio-Rad, Hercules, CA). 6E5 hybridoma supernatant was used as the primary antibody. Horseradish peroxi-dase (HRP)-conjugated donkey anti-mouse IgG (sc-2318; Santa Cruz, CA) was used as the secondary
antibody at 1:2000 dilution. Protein bands were visua-lized using SuperSignal West Femto chemiluminescent substrate (Pierce, Rockford, IL).
Immunohistochemistry
Following a pathologist’s review, immunohistochemistry (IHC) was performed on human liver tissues to deter-mine the expression of SIP1, as previously described [21]. In brief, tissue sections were deparaffinized and treated with 10 mM citrate buffer for antigen retrieval. Then, samples were incubated first with a homemade SIP1 monoclonal antibody (clone 6E5), and after wash-ing, with a universal staining kit secondary reagent (Lab-Vision, Fremont, CA). An IgG2a isotype antibody was used as the control (R&D Systems, MN). Diaminobenzi-dine (DAB) was used as the chromogen, and the slides were counterstained using Mayer’s hematoxylin. Immu-noreactivity was registered semi-quantitatively, and the immunostaining in each section was assessed indepen-dently by two observers (EO and TY). The staining intensity was graded relatively as: no staining (0), weak (+), moderate (++) or strong (+++) [35].
Mutation screening
Except UTR, all exons of SIP1 were amplified in 14 HCC cell lines using 13 sets of primers (Additional file 2). PCR products were purified with the PCR96 Cleanup
Kit (Millipore, Billerica, MA) and directly sequenced by the sequencing service company Iontek (Istanbul, Tur-key). Mutation screening was performed using the Mutation Surveyor software package (v 3.10, SoftGe-netics, LLC, State College, PA).
5-azacytidine and trichostatin A treatment of HCC cell lines
5-azacytidine (5-AzaC) and Trichostatin A (TSA) treat-ments were performed as described previously [36-38]. Briefly, cells were seeded in six-well plates at a density of 3 × 10⁵ cells/well and treated after 24 h with 2.5μM 5-AzaC (Sigma-Aldrich, St. Louis, MO) for 96 h. In the last 24 h, they were treated with 300 nM or 1μM TSA (Sigma-Aldrich, St. Louis, MO) either alone or com-bined with 5-AzaC. The medium and 5-AzaC were refreshed every 24 h. Control cultures were left untreated or received a mock treatment with adequate volumes of DMSO (Sigma-Aldrich, St. Louis, MO) in the case of TSA treatment. At the end of the treatment, cells were harvested for DNA and RNA isolation.
CpG island search in SIP1 promoter
The sequence of the human SIP1 gene was retrieved from the NCBI gene database and putativeSIP1 promo-ters were predicted by Promoter2.0 software [39]. The genomic region containing theSIP1 gene, starting from
the third exon to 20 kb upstream of the first exon, was analyzed for CpG islands by MethPrimer software [40].
Sodium bisulfite treatment and combined bisulfite restriction analysis (COBRA)
Genomic DNA was extracted from the cell lines using the Qiagen DNeasy Tissue kit (Hilden, Germany) and bisulfite treated with the Epigentek Methylamp™ DNA Modification kit (Brooklyn, NY) according to the manu-facturers’ instructions. Nested primer pairs targeted to SIP1 CpG islands were used to amplify bisulfite-treated DNAs (the list of primers is given in Additional file 2) and PCR products were restriction digested by BstUI or TaqI (New England BioLabs, Ipswich, MA) to detect methylation status, as previously described [41].
Results
DifferentialSIP1 expression in HCC cell lines
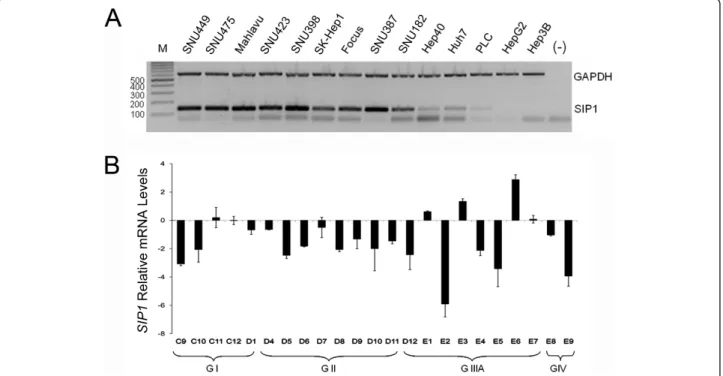
We first identified the mRNA expression of SIP1 in 14 HCC cell lines by multiplex semi-quantitative RT-PCR (Figure 1A). In our experimental settings, the SIP1 transcript was absent in the Hep3B and HepG2, very low in the PLC/PRF/5 and weak in the Hep40 and Huh7 cell lines. The other nine cell lines, SNU449, SNU475, Mahlavu, SNU423, SNU398, SK-Hep1, Focus, SNU387 and SNU182, displayed much stronger SIP1 mRNA expression. These results suggested a negative regulation ofSIP1 in some HCC cells by as yet uniden-tified mechanisms.
SIP1 expression is reduced in human HCCs
We expanded our analysis to clinical samples in order to detect the expression of SIP1 transcripts in a panel of human HCCs by quantitative real-time RT-PCR (Figure 1B). SIP1 expression was found to be significantly reduced in 17 of 23 (73.91%) HCC tumors, compared to eight normal liver tissues from the same panel (p = 0.01). Three of the remaining HCC samples displayed normal and the other three showed high SIP1 transcript levels. DecreasedSIP1 expression was also observed in the majority of the non-HCC liver lesions - the cholan-giocarcinomas and adenomas (data not shown).
SIP1 protein is missed or downregulated in HCCs
A previously described, an SIP1 monoclonal anti-body, clone 6E5, was used in the IHC experiments [21]. The specificity of the antibody was first assessed by Western blotting in HCC cell lines and a control liver tissue (Figure 2). Except for cells from the poorly differ-entiated SNU398 cell line and the normal liver, none of the HCC cells displayed SIP1 protein expression. Next, IHC was performed on liver tissue array and archival human liver tissue sections, including non-HCC (normal liver, chronic hepatitis, cirrhosis) and HCC samples
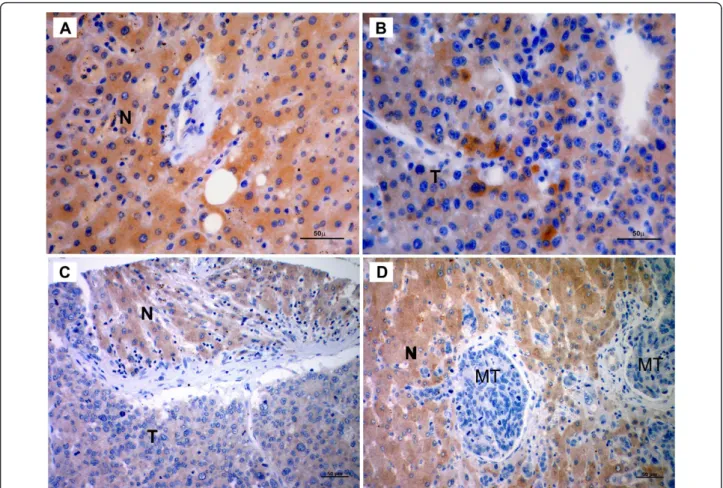
(Figure 3). We observed decreased expression of SIP1 in HCC cases compared to non-HCC tissues. Hepatocytes from all 17 non-HCC tissues showed moderate and strong SIP1 cytoplasmic expression. In sharp contrast, no SIP1 protein expression was found in 53 of 64
(82.8%) HCC cases. In addition, tumors in the remaining 11 cases (17.2%) displayed only weak immunoreactivity. The IHC results of the liver tissues are summarized in Table 1.
Absence ofSIP1 mutations in HCCs
To investigate whether SIP1 is inactivated by allelic deletions and/or somatic mutations, we performed direct sequence analysis using genomic DNA from 14 HCC cell lines. Genomic PCR was carried out using 13 sets of primers that amplify the entire coding region, including splice acceptor and donor sites (exons 2-10) of SIP1. No somatic mutations leading to amino acid substitutions or frameshifts were found, indicating that mutational alterations of SIP1 are not main genetic events in hepatocarcinogenesis (data not shown).
Restoration ofSIP1 mRNA expression by 5-AzaC and TSA treatments
The absence of SIP1 mutations in HCC cell lines prompted us to explore the role of DNA methylation and/or histone deacetylation as mechanisms that operate onSIP1 downregulation in HCC. To this end, we exam-ined rescued SIP1 expression in three cell lines with decreased SIP1 transcripts upon treatment with DNA
Figure 1 Expression ofSIP1 in HCC cell lines and tumors. (A) SIP1 expression is detected in 14 HCC cell lines by multiplex semi-quantitative RT-PCR. GAPDH is used as an internal control. Amplicons corresponding to SIP1 and GAPDH are 132 bp and 611 bp, respectively. A negative control without a DNA template is included. Bands lower than 100 bp in most of the cell lines and negative control sample are primer dimers. M: marker. (B) SIP1 mRNA expression in HCC tumors relative to tumor-adjacent and normal tissues is analyzed by quantitative RT-PCR. Relative mRNA levels of SIP1 normalized to TBP are represented. Patients are grouped depending on tumor stage (GI-GIV). Clinicopathological characteristics of patients (C9-E9) are given in Additional file 1. Standard deviations of two independent experiments are shown.
Figure 2 Endogenous expression of SIP1 protein in HCC cell lines and normal liver. The specificity of 6E5 monoclonal antibody is assessed by a Western blot experiment by using total cell lysates from HCC cell lines (SNU398, Huh7, Hep40, SNU182) and a normal liver. An SIP1 protein band at the expected size is observed only in SNU398 and normal liver cells.
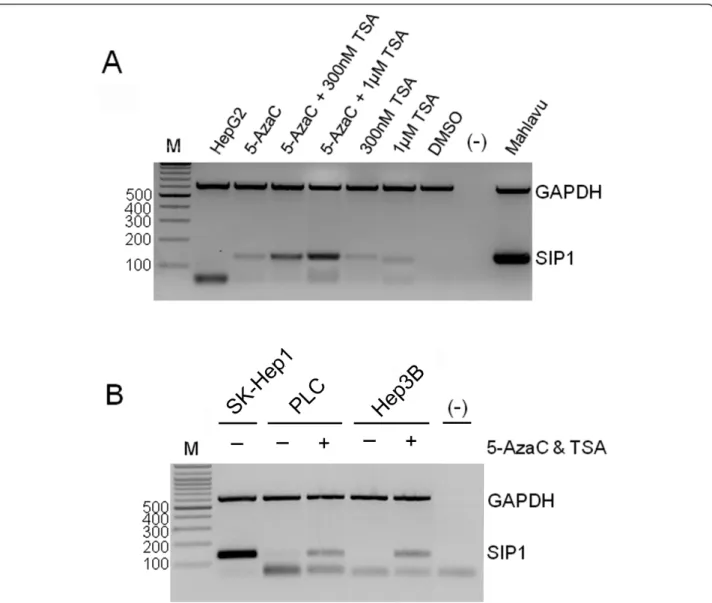
methyltransferase inhibitor 5-AzaC and histone deacety-lase inhibitor TSA, either alone or in combination. When treated with 5-AzaC and TSA alone,SIP1 expres-sion was found to be restored in the HepG2 cell line, and combined treatment substantially increased SIP1 transcript compared to cells treated with either agent alone (Figure 4A). Similar treatment conditions also
restored the expression of SIP1 in Hep3B and PLC cells (Figure 4B).
Frequent methylation ofSIP1 promoter in primary HCC samples
The restoration ofSIP1 expression with the demethylating agent 5-AzaC is an indicator of promoter hypermethyla-tion; we next aimed at analyzing the methylation status of the SIP1 promoter region. First, we sought out CpG islands by anin silico search in a ~100 kb region, from the third exon to 20 kb upstream of the first exon ofSIP1, by using MethPrimer software [40]. Found CpG islands that accumulate in three distinct zones of the analyzed 5’ site of theSIP1 gene are represented in Figure 5. Analysis of the same region by a promoter prediction program, Pro-moter 2.0 [39], revealed three previously described promo-ter candidates [42,43]. We noticed that putative promopromo-ters overlapped with some of the aforementioned CpG islands and we restricted our methylation analyses to these three gene regulatory regions (Figure 5).
Figure 3 SIP1 protein expression in human liver tissues. Photographs are representative of SIP1 immunohistochemistry in human liver tissues. (A) Normal tissue shows strong, diffuse cytoplasmic staining. (B) Heterogenous expression of SIP1 in HCC. Tumor section displays faint immunostaining, except for a few cells with strong immunoreactivity. (C) A tissue array sample includes both tumor and non-tumor cells that differentially express SIP1. (D) Adenocarcinoma metastasis to liver. While metastatic cells are negatively stained, hepatocytes strongly express SIP1. N: Normal hepatocytes; T: HCC cells; MT: Metastatic adenocarcinoma cells (Scale Bars: 50μm).
Table 1 Immunostaining of human liver tissues with SIP1 antibody
SIP1 Expression (staining intensity) Pathological Diagnosis No staining (+) (++/+++) HCC (n = 64) 53 (82.8%) 11 (17.2%) Normal Liver (n = 7) 7 (100%) Cirrhosis (n = 3) 3 (100%) HBV Carrier (n = 1) 1 (100%) Chronic Hepatitis HBV (n = 3) 3(100%) HCV (n = 3) 3 (100%)
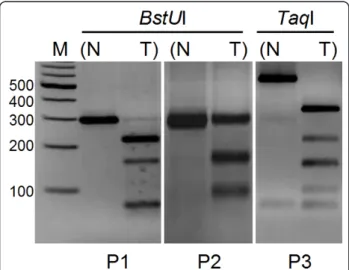
To determine the overall frequency of SIP1 methyla-tion in clinical HCC samples, we examined 39 tumor and paired normal liver tissues and performed COBRA analysis whenever an amplicon was obtained. Depending on the availability of restriction sites, PCR products of P1 and P2 were digested byBstUI, and amplicons deriv-ing from P3 were cut byTaqI enzymes (Additional file 3). A tumor-specific methylation pattern was observed in 48% (14/29) and 43% (10/23) of P1 and P3 sites, respectively. However, in our analysis of the P2 region, only 4% (1/26) of HCC samples were hypermethylated (Figure 6). COBRA analysis of the P1 and P3 regions also revealed partial methylation in both normal and tumor tissues in 52% (15/29) and 30% (7/23) of the
paired samples, respectively. Six out of 23 amplicons in the P3 region (26%) failed to be restriction digested. We also noticed that 65.6% (21/32) of the paired samples displayed tumor-specific methylation when all three regions were considered. COBRA results of all paired HCC samples are given in Additional file 4.
Discussion
SIP1 is a member of the ZEB family of transcription fac-tors and, along with other E-cadherin repressors, it was repeatedly shown to induce the EMT phenotype bothin vivo and in vitro and correlate with a poor prognosis in cancer patients [5,12,15,19]. On the other hand, SIP1 was also shown to be a negative regulator of hTERT
Figure 4 Treatment with 5-AzaC and TSA rescuesSIP1 expression in HCC cell lines. The restoration of SIP1 expression is analyzed by multiplex semi-quantitative RT-PCR. (A) Treatment of HepG2 cells with 5-AzaC (2.5μM) and TSA. Mahlavu cells are included as a positive control of SIP1 expression. DMSO is used as a control of TSA treatment and a DNA-free PCR mixture [(-)] is also tested. (B) PLC and Hep3B cell lines are treated with 2.5μM 5-AzaC and 1 μM TSA. The SkHep1 cell line was used as a positive control. [(-)]: DNA-free PCR mixture. M: marker (bp). In both (A) and (B), bands lower than 100 bp are primer dimers.
transcription in breast cancer cells [17]. Consistent with this, we have recently reported that SIP1 was partly responsible for inducing senescence in hepatocellular carcinoma-derived cells throughhTERT repression, and hypothesized that it may act as a tumor suppressor gene in HCC [18]. In support of this hypothesis, a recent microarray study showed downregulation of SIP1 in early and advanced HCC [44]. Also, induced expression of SIP1 has recently been shown to directly inhibit cyclin D1 in the A431 squamous carcinoma cell line, leading to the accumulation of cells in the G1 phase [19]. Other studies described posttranscriptional regula-tion mechanisms, such as those mediated by miR-200 family [24-26] and SIP1 NAT [27], in the downregula-tion of SIP1 in different pathophysological contexts.
Obviously, DNA methylation and alterations of chro-matin structure are predominant mechanisms that epi-genetically inactivate tumor suppressor genes in tumors [45]. For instance, SIP1 was found to be hypermethy-lated in poorly metastatic breast adenocarcinoma cells, but hypomethylated in a more aggressive variant of this cell line [28]. Yet more recently, silencing of SIP1 expression was shown to be mediated by promoter hypermethylation in a substantial proportion of pancrea-tic cancer cell lines and tissues [29].
Herein, we explored the expression of SIP1 in HCC at the transcriptional and protein levels and provided a mechanistic insight by demonstrating that promoter hypermethylation operates as one of the mechanisms in the epigenetic regulation and downregulation of SIP1 in the majority of HCC samples.
Our initial expression studies in HCC cell lines revealed two groups of cells that differentially express SIP1. Most fibroblastoid-like cells displayed strong SIP1 transcripts, while cell lines with an epitheloid appear-ance had no or low expression. Thisin vitro expression pattern ofSIP1 was in accordance with its role in indu-cing EMT, but was neither informative about a tumor versus normal comparison of SIP1 levels nor the beha-viour of SIP1 in a liver tissue context. We therefore pro-ceeded with normal liver and HCC tissues and found a significant decrease of SIP1 transcripts in 74% of tumors. By using a previously described anti-SIP1 monoclonal antibody, clone 6E5, an immunoblot was performed with the lysates of HCC cell lines [21]. This assay not only proved the specificity of this antibody, but confirmed our initial observation that SIP1 is down-regulated in tumors (Figure 2). Even a higher rate of SIP1 downregulation was observed in our IHC experi-ments. Compared to normal, 83% of HCC cases dis-played no immunoreactivity and the remaining tumor samples were stained with only a weak intensity. This small difference between transcript and protein levels
Figure 5In silico analysis of CpG-rich putative SIP1 promoters. The 100 Kb genomic region upstream of the third exon is analyzed by CpG island prediction (MethPrimer) and promoter prediction (Promoter2.0) programs. Localization of the CpG islands (gray zones) and three putative promoter (P1-P3) regions are represented. Boxes indicate the first and second exons and the translation start site of SIP1.
Figure 6 Methylation analysis of promoter regions by COBRA. Photographs are representative of tumor-specific methylation in three promoter regions. Amplicons of P1 and P2 are cut with BstUI (left and middle), and TaqI digestion is applied to the PCR products of the P3 region (right). N: normal; T: tumor; M: marker.
might be explained by the aforementioned posttran-scriptional regulatory mechanisms ofSIP1 expression. In fact, a miRNA profiling study that showed upregulation of miR-200c in HCCs but not in benign liver tumors could partly explain the downregulation of SIP1 in HCCs [46]. It would be interesting to analyze the expression levels of these regulators in HCCs.
Genetic screening of cell lines did not reveal any mutational alterations in theSIP1 gene, suggesting the implication of epigenetic regulatory mechanisms for the silencing of SIP1 in HCC. Upon our observation that SIP1 mRNA expression was restored after treatment of cells with 5-azaC and TSA, we decided to explore pro-moter hypermethylation as a possible mechanism of SIP1 downregulation in HCC.
In vitro activities of three alternative SIP1 promoter regions have been previously described in experiments with mouse tissue and the one located around the first exon (P2) exhibited the highest activity. The other alter-native promoter regions (P1 and P3) were of low, but detectable, activity [42]. Studies in human cancer cell lines revealed a similar pattern of promoter activation, but this time in an AKT-dependent manner [43]. In striking contrast to these findings, we detected only one methylated tumor sample among 26 paired tissues when we examined the P2 promoter region. However, nearly half of the HCC cases displayed tumor-specific hyper-methylation at both the P1 and P3 putative promoter sites. In fact, the number of CpG sites were more restricted in P2 than in the P1 and P3 regions. We also noticed only oneBstUI restriction site in P2 but two in the P1 region. P3 amplicons, which were devoid of BstUI sites, were digested with the TaqI enzyme. Hyper-methylation in the P3 alternative promoter region (43%) might inhibit SIP1 translation in a different context. The regulation ofSIP1 translation by a NAT has been pre-viously shown [27]. After the completion of EMT, a NAT is expressed and makes translation ofSIP1 mRNA possible. This NAT expression was shown to be con-trolled by elements placed at the 5’ site of the second exon, which corresponds to the P3 alternative promoter region [27]. Therefore, hypermethylation at the P3 site might inhibit the expression of the NAT, which in turn negatively affectsSIP1 translation. It would be interest-ing to study the expression of the NAT in HCC.
Downregulation of SIP1 in HCC is also in accordance with the dual role of TGF-b in tumorigenesis. The tumor suppressor role of TGF-b in the premalignant stage was shown to switch to an EMT-inducing role in the later stages of cancers, leading to metastasis [47]. This former failsafe mechanism might partly explain higher levels of SIP1 expression in normal liver com-pared to HCCs. Despite our previous description that SIP1 is partly responsible for replicative senescence in
liver cancer cells, its role in inducing apoptosis in dis-tinct pathophysiolocal contexts should also be thor-oughly investigated in HCC. Given the downregulation and possible tumor suppressor role of SIP1 in HCC, we also propose the assessment of this regulator as a prog-nostic factor for patients affected by this aggressive form of liver cancer.
Conclusions
The data presented here clearly demonstrate thatSIP1 is downregulated and undergoes epigenetic silencing in a considerable proportion of HCCs. Taken with our pre-vious findings that SIP1 represseshTERT and mediates senescence arrest in HCC-derived cells, our results sug-gest that SIP1 is regulated in and a potential tumor sup-pressor gene of hepatocarcinogenesis.
Additional material
Additional file 1: Clinicopathological characteristics of liver samples used in quantitative RT-PCR. Data about gender, age, diagnosis and tumor stage are given. A more detailed information on the samples can be found on the website below. http://www.origene.com/assets/ documents/TissueScan/LVRT-01.xls
Additional file 2: Primers used in the study. Name, sequence, Tm value and PCR product size are given.
Additional file 3: Sequence of the bisulfite-modifiedSIP1 putative promoter regions. Arrows underlie the position of COBRA primers. Boxes show the cutting sites of the restriction enzymes.
Additional file 4: COBRA results of three SIP1 putative promoter regions in paired HCC samples. Figure S1. BstUI restriction analysis of the P1 region amplified by SIPM1dF/SIPM1iyR1 and SIPM1iF/SIPM1iyR1 semi-nested primer pairs. Fourteen out of 29 HCC samples (48%) are methylated. Figure S2. BstUI restriction analysis of the P2 region amplified by SIPM2iyF1/SIPM2iR and SIPM2iyF1/SIPM2iyR2 semi-nested primer pairs. One out of 26 HCC samples (4%) is methylated. Figure S3. TaqI restriction analysis of the P3 region amplified by SIPM3dF/SIPM3dR and SIPM3iF/SIPM3iR nested primer pairs. Ten out of 23 HCC samples (43%) are methylated.
Acknowledgements
We thank Professor Mehmet Ozturk for kindly providing patient samples used in methylation analysis. This work was supported by Scientific and Technological Research Council of Turkey Grants 107S174 (to MC Yakicier) and 104S243 (to T Yagci).
Author details
1Bilkent University, Department of Molecular Biology and Genetics, 06800 Ankara, Turkey.2Department of Histology and Embryology, Gulhane Military Medical Academy (GMMA), 06018 Ankara, Turkey.3Gebze Institute of Technology, Department of Molecular Biology and Genetics, 41400 Cayirova, Kocaeli, Turkey.4Department of Medical Biology, Acibadem University, 34848 Istanbul, Turkey.
Authors’ contributions
TA processed all the experiments except the IHC study and participated in the design of the study and in drafting the manuscript and data
interpretation. EO performed the IHC study. TY participated in the IHC study and data interpretation and helped draft the manuscript. MCY designed and coordinated the study, participated in the data interpretation and in drafting the manuscript. All authors have read and approved the final manuscript.
Competing interests
The authors declare that they have no competing interests. Received: 10 November 2010 Accepted: 6 June 2011 Published: 6 June 2011
References
1. Ferlay J, Bray F, Pisani P, Parkin DMJ, eds: GLOBOCAN 2000: Cancer Incidence, Mortality and Prevalence Worldwide. Lyon: IARC Press; 2001, Version 1.0.
2. Parkin DM, Bray FI, Devesa SS: Cancer burden in the year 2000. The global picture. Eur J Cancer 2001, 37(Suppl 8):S4-66.
3. Anthony PP: Tumors and tumor-like lesions of the liver and biliary tract: etiology, epidemiology and pathology. In Pathology of the Liver.. 4 edition. Edited by: MacSween R, Burt A, Portmann B, Ishak K, Scheuer P, Anthony P. London, New York, Sydney, Toronto: Churchill Livingstone; 2002:711-775. 4. Postigo AA, Dean DC: Differential expression and function of members of
the zfh-1 family of zinc finger/homeodomain repressors. Proc Natl Acad Sci USA 2000, 97(12):6391-6396.
5. Comijn J, Berx G, Vermassen P, Verschueren K, van Grunsven L, Bruyneel E, Mareel M, Huylebroeck D, van Roy F: The two-handed E box binding zinc finger protein SIP1 downregulates E-cadherin and induces invasion. Mol Cell 2001, 7(6):1267-1278.
6. Van Grunsven LA, Michiels C, Van de Putte T, Nelles L, Wuytens G, Verschueren K, Huylebroeck D: Interaction between Smad-interacting protein-1 and the corepressor C-terminal binding protein is dispensable for transcriptional repression of E-cadherin. J Biol Chem 2003,
278(28):26135-26145.
7. Vandewalle C, Comijn J, De Craene B, Vermassen P, Bruyneel E, Andersen H, Tulchinsky E, Van Roy F, Berx G: SIP1/ZEB2 induces EMT by repressing genes of different epithelial cell-cell junctions. Nucleic Acids Res 2005, 33(20):6566-6578.
8. Yoshimoto A, Saigou Y, Higashi Y, Kondoh H: Regulation of ocular lens development by Smad-interacting protein 1 involving Foxe3 activation. Development 2005, 132(20):4437-4448.
9. Verschueren K, Remacle JE, Collart C, Kraft H, Baker BS, Tylzanowski P, Nelles L, Wuytens G, Su MT, Bodmer R, Smith JC, Huylebroeck D: SIP1, a novel zinc finger/homeodomain repressor, interacts with Smad proteins and binds to 5’-CACCT sequences in candidate target genes. J Biol Chem 1999, 274(29):20489-20498.
10. Thiery JP, Chopin D: Epithelial cell plasticity in development and tumor progression. Cancer Metastasis Rev 1999, 18(1):31-42.
11. Thiery JP: Epithelial-mesenchymal transitions in development and pathologies. Curr Opin Cell Biol 2003, 15(6):740-746.
12. Rosivatz E, Becker I, Specht K, Fricke E, Luber B, Busch R, Hofler H, Becker KF: Differential expression of the epithelial-mesenchymal transition regulators snail, SIP1, and twist in gastric cancer. Am J Pathol 2002, 161(5):1881-1891.
13. Imamichi Y, Konig A, Gress T, Menke A: Collagen type I-induced Smad-interacting protein 1 expression downregulates E-cadherin in pancreatic cancer. Oncogene 2007, 26(16):2381-2385.
14. Isohata N, Aoyagi K, Mabuchi T, Daiko H, Fukaya M, Ohta H, Ogawa K, Yoshida T, Sasaki H: Hedgehog and epithelial-mesenchymal transition signaling in normal and malignant epithelial cells of the esophagus. Int J Cancer 2009, 125(5):1212-1221.
15. Elloul S, Elstrand MB, Nesland JM, Trope CG, Kvalheim G, Goldberg I, Reich R, Davidson B: Snail, Slug, and Smad-interacting protein 1 as novel parameters of disease aggressiveness in metastatic ovarian and breast carcinoma. Cancer 2005, 103(8):1631-1643.
16. Sayan AE, Griffiths TR, Pal R, Browne GJ, Ruddick A, Yagci T, Edwards R, Mayer NJ, Qazi H, Goyal S, Fernandez S, Straatman K, Jones GD, Bowman KJ, Colquhoun A, Mellon JK, Kriajevska M, Tulchinsky E: SIP1 protein protects cells from DNA damage-induced apoptosis and has independent prognostic value in bladder cancer. Proc Natl Acad Sci USA 2009, 106(35):14884-14889.
17. Lin SY, Elledge SJ: Multiple tumor suppressor pathways negatively regulate telomerase. Cell 2003, 113(7):881-889.
18. Ozturk N, Erdal E, Mumcuoglu M, Akcali KC, Yalcin O, Senturk S, Arslan-Ergul A, Gur B, Yulug I, Cetin-Atalay R, Yakicier C, Yagci T, Tez M, Ozturk M: Reprogramming of replicative senescence in hepatocellular carcinoma-derived cells. Proc Natl Acad Sci USA 2006, 103(7):2178-2183.
19. Mejlvang J, Kriajevska M, Vandewalle C, Chernova T, Sayan AE, Berx G, Mellon JK, Tulchinsky E: Direct repression of cyclin D1 by SIP1 attenuates cell cycle progression in cells undergoing an epithelial mesenchymal transition. Mol Biol Cell 2007, 18(11):4615-4624.
20. Miyoshi A, Kitajima Y, Sumi K, Sato K, Hagiwara A, Koga Y, Miyazaki K: Snail and SIP1 increase cancer invasion by upregulating MMP family in hepatocellular carcinoma cells. Br J Cancer 2004, 90(6):1265-1273. 21. Oztas E, Avci ME, Ozcan A, Sayan AE, Tulchinsky E, Yagci T: Novel
monoclonal antibodies detect Smad-interacting protein 1 (SIP1) in the cytoplasm of human cells from multiple tumor tissue arrays. Exp Mol Pathol 2010, 89(2):182-189.
22. Kojima T, Takano K, Yamamoto T, Murata M, Son S, Imamura M, Yamaguchi H, Osanai M, Chiba H, Himi T, Sawada N: Transforming growth factor-beta induces epithelial to mesenchymal transition by down-regulation of claudin-1 expression and the fence function in adult rat hepatocytes. Liver Int 2008, 28(4):534-545.
23. Bracken CP, Gregory PA, Kolesnikoff N, Bert AG, Wang J, Shannon MF, Goodall GJ: A double-negative feedback loop between ZEB1-SIP1 and the microRNA-200 family regulates epithelial-mesenchymal transition. Cancer Res 2008, 68(19):7846-7854.
24. Christoffersen NR, Silahtaroglu A, Orom UA, Kauppinen S, Lund AH: miR-200b mediates post-transcriptional repression of ZFHX1B. RNA 2007, 13(8):1172-1178.
25. Park SM, Gaur AB, Lengyel E, Peter ME: The miR-200 family determines the epithelial phenotype of cancer cells by targeting the E-cadherin repressors ZEB1 and ZEB2. Genes Dev 2008, 22(7):894-907.
26. Gregory PA, Bert AG, Paterson EL, Barry SC, Tsykin A, Farshid G, Vadas MA, Khew-Goodall Y, Goodall GJ: The miR-200 family and miR-205 regulate epithelial to mesenchymal transition by targeting ZEB1 and SIP1. Nat Cell Biol 2008, 10(5):593-601.
27. Beltran M, Puig I, Pena C, Garcia JM, Alvarez AB, Pena R, Bonilla F, de Herreros AG: A natural antisense transcript regulates Zeb2/Sip1 gene expression during Snail1-induced epithelial-mesenchymal transition. Genes Dev 2008, 22(6):756-769.
28. Rodenhiser DI, Andrews J, Kennette W, Sadikovic B, Mendlowitz A, Tuck AB, Chambers AF: Epigenetic mapping and functional analysis in a breast cancer metastasis model using whole-genome promoter tiling microarrays. Breast Cancer Res 2008, 10(4):R62.
29. Li A, Omura N, Hong SM, Vincent A, Walter K, Griffith M, Borges M, Goggins M: Pancreatic cancers epigenetically silence SIP1 and hypomethylate and overexpress miR-200a/200b in association with elevated circulating miR-200a and miR-200b levels. Cancer Res 2010, 70(13):5226-5237.
30. Ozturk M: p53 mutation in hepatocellular carcinoma after aflatoxin exposure. Lancet 1991, 338(8779):1356-9.
31. Avci ME, Konu O, Yagci T: Quantification of SLIT-ROBO transcripts in hepatocellular carcinoma reveals two groups of genes with coordinate expression. BMC Cancer 2008, 8:392.
32. Fu LY, Jia HL, Dong QZ, Wu JC, Zhao Y, Zhou HJ, Ren N, Ye QH, Qin LX: Suitable reference genes for real-time PCR in human HBV-related hepatocellular carcinoma with different clinical prognoses. BMC Cancer 2009, 9:49.
33. Gur-Dedeoglu B, Konu O, Bozkurt B, Ergul G, Seckin S, Yulug IG: Identification of endogenous reference genes for qRT-PCR analysis in normal matched breast tumor tissues. Oncol Res 2009,
17(8):353-365.
34. Pfaffl MW: A new mathematical model for relative quantification in real-time RT-PCR. Nucleic Acids Res 2001, 29(9):e45.
35. Chen CL, Hsieh FC, Lin J: Systemic evaluation of total Stat3 and Stat3 tyrosine phosphorylation in normal human tissues. Exp Mol Pathol 2006, 80:295-305.
36. Datta J, Kutay H, Nasser MW, Nuovo GJ, Wang B, Majumder S, Liu CG, Volinia S, Croce CM, Schmittgen TD, Ghoshal K, Jacob ST: Methylation mediated silencing of MicroRNA-1 gene and its role in hepatocellular carcinogenesis. Cancer Res 2008, 68(13):5049-5058.
37. Huang J, Zhang YL, Teng XM, Lin Y, Zheng DL, Yang PY, Han ZG: Down-regulation of SFRP1 as a putative tumor suppressor gene can contribute to human hepatocellular carcinoma. BMC Cancer 2007, 7:126.
38. Mazieres J, Tovar D, He B, Nieto-Acosta J, Marty-Detraves C, Clanet C, Pradines A, Jablons D, Favre G: Epigenetic regulation of RhoB loss of expression in lung cancer. BMC Cancer 2007, 7:220.
39. Knudsen S: Promoter2.0: for the recognition of PolII promoter sequences. Bioinformatics 1999, 15(5):356-361.
40. Li LC, Dahiya R: MethPrimer: designing primers for methylation PCRs. Bioinformatics 2002, 18(11):1427-1431.
41. Xiong Z, Laird PW: COBRA: a sensitive and quantitative DNA methylation assay. Nucleic Acids Res 1997, 25(12):2532-2534.
42. Nelles L, Van de Putte T, van Grunsven L, Huylebroeck D, Verschueren K: Organization of the mouse Zfhx1b gene encoding the two-handed zinc finger repressor Smad-interacting protein-1. Genomics 2003,
82(4):460-469.
43. Julien S, Puig I, Caretti E, Bonaventure J, Nelles L, van Roy F, Dargemont C, Garcia AHerreros, Bellacosa A, Larue L: Activation of NF-κB by Akt upregulates Snail expression and induces epithelium mesenchyme transition. Oncogene 2007, 26:7445-7456.
44. Wurmbach E, Chen YB, Khitrov G, Zhang W, Roayaie S, Schwartz M, Fiel I, Thung S, Mazzaferro V, Bruix J, Bottinger E, Friedman S, Waxman S, Llovet JM: Genome-wide molecular profiles of HCV-induced dysplasia and hepatocellular carcinoma. Hepatology 2007, 45(4):938-947. 45. Esteller M: Cancer epigenomics: DNA methylomes and
histone-modification maps. Nat Rev Genet 2007, 8(4):286-298.
46. Ladeiro Y, Couchy G, Balabaud C, Bioulac-Sage P, Pelletier L, Rebouissou S, Zucman-Rossi J: MicroRNA profiling in hepatocellular tumors is associated with clinical features and oncogene/tumor suppressor gene mutations. Hepatology 2008, 47(6):1955-1963.
47. Roberts AB, Wakefield LM: The two faces of transforming growth factor beta in carcinogenesis. Proc Natl Acad Sci USA 2003, 100(15):8621-8623. Pre-publication history
The pre-publication history for this paper can be accessed here: http://www.biomedcentral.com/1471-2407/11/223/prepub
doi:10.1186/1471-2407-11-223
Cite this article as: Acun et al.: SIP1 is downregulated in hepatocellular carcinoma by promoter hypermethylation. BMC Cancer 2011 11:223.
Submit your next manuscript to BioMed Central and take full advantage of:
• Convenient online submission
• Thorough peer review
• No space constraints or color figure charges
• Immediate publication on acceptance
• Inclusion in PubMed, CAS, Scopus and Google Scholar
• Research which is freely available for redistribution
Submit your manuscript at www.biomedcentral.com/submit