FUNCTIONAL ANALYSIS OF ERBIN GENE IN
BREAST CANCER DRUG RESISTANCE
A THESIS SUBMITTED TO
THE GRADUATE SCHOOL OF ENGINEERING AND SCIENCE
OF BILKENT UNIVERSITY
IN PARTIAL FULFILLMENT OF THE REQUIREMENTS FOR THE DEGREE OF
MASTER OF SCIENCE IN
MOLECULAR BIOLOGY AND GENETICS
By Gizem Sunar February 2021
FUNCTIONAL ANALYSIS OF ERBIN GENE IN BREAST CANCER DRUG RESISTANCE
By Gizem S unar February, 2021
We ce11ify that we have read this thesis and that in our opinion it is fully adequate, in scope and in quality, as a thesis for the degree of Master of Science.
ijk
Yulug-(Advisor)
Onur <;izmecioglu
Bala Gtir Dedeoglu
Approved for the Graduate School of Engineering and Science:
-
---Ezhan Kara~an
ii
ABSTRACT
FUNCTIONAL ANALYSIS OF ERBIN GENE IN BREAST CANCER DRUG
RESISTANCE
Gizem Sunar
M.S. in Molecular Biology and Genetics
Advisor: Işık Yuluğ February, 2021
Erbin is an ERBB2 interacting protein with roles in many signaling pathways. Breast cancer is one of the types of cancer that is affected by Erbin regulation. However, it is unclear how Erbin regulates the biological behavior and drug resistance of breast cancer cells. Some studies have claimed that Erbin promotes tumorigenesis and demonstrates oncogenic features in breast cancer, whereas others have indicated that it inhibits breast cancer development. The main aim of this study was to explore the role of the Erbin gene in breast cancer drug resistance. Bioinformatic analyses of breast cancer patient datasets have shown that a high level of Erbin expression predicts better survival in breast cancer patients treated with chemotherapy or targeted therapies while the Erbin level does not change the survival rates of untreated breast cancer patients. These analyses lead us to hypothesize that the Erbin expression level could alter the effect of the drug treatment and a reduced level of Erbin expression could promote resistance against doxorubicin and tamoxifen. In vitro studies have demonstrated that the protein expressions were apparently lower in MDA-MB-231 doxorubicin resistant (DoxR) and MCF-7 tamoxifen resistant (TamR) cells compared to non-resistant cell line counterparts. When the expression level of Erbin was downregulated by si-RNA transfection, it was observed that the protein level of the anti-apoptotic markers increased whereas apoptotic markers decreased in MDA-MB-231 cells. Proteins that promote cell survival and proliferation increased in Erbin downregulated MDA-MB-231 and MCF-7 cells. Besides, when Erbin was
iii
reduced, the viability of the MDA-MB-231 cells against doxorubicin increased but there was no significant change for tamoxifen in MCF-7 cells. Lastly, breast cancer patients with high Erbin expression that were treated with tamoxifen, chemotherapy or trastuzumab have higher levels of DNA damage, apoptosis and cell cycle arrest-related genes. On the contrary, patients with low Erbin expression have higher levels of cyclins, CDKs and anti-apoptotic genes. In conclusion, Erbin could play an important role in the drug resistance of breast cancer cells since the reduction in Erbin expression can promote drug resistance in these cells.
iv
ÖZET
ERBİN GENİNİN MEME KANSERİ İLAÇ DİRENCİNDE FONKSİYONEL ANALİZİ
Gizem Sunar
Moleküler Biyoloji ve Genetik, Yüksek Lisans Tez Danışmanı: Işık Yuluğ
Şubat, 2021
Erbin, birçok sinyal yolağında rol alan ERBB2 etkileşimli bir proteindir. Erbin geninin hücre içindeki düzenlemelerinden etkilenen kanser türlerinden biri de meme kanseridir. Ancak, Erbin geninin meme kanseri hücrelerinin biyolojik davranışını ve ilaç direncini nasıl düzenlediği belirsizdir. Bazı araştırmalar, Erbin'in meme kanserinde tümör oluşumunu desteklediğini ve onkojenik özellik gösterdiğini iddia ederken, diğerleri ise meme kanseri gelişimini engellediğini belirtmiştir. Bu çalışmanın temel amacı, Erbin geninin meme kanseri ilaç direncindeki rolünü araştırmaktır. Meme kanseri hasta verilerinin biyoinformatik analizlerinde, yüksek seviyeli Erbin gen ifadesi, kemoterapi veya hormonel terapi ile tedavi edilen meme kanseri hastalarında ölüm oranlarının daha düşük olduğu gösterilmiştir. Bunun yanında eğer hastalar tedavi edilmediyse Erbin seviyesinin meme kanseri hastalarının hayatta kalma oranlarını değiştirmediğini gösterilmiştir. Bu analizler bizi Erbin ifade seviyesinin ilaç tedavisinin etkisini değiştirebileceğini ve Erbin ifade seviyesi azaldığında doksorubisin ve tamoksifene karşı direncin artabileceği varsayımına ulaşılmıştır. İn vitro çalışmalar, Erbin protein ifadesinin MDA-MB-231 doksorubisin dirençli (DoxR) ve MCF-7 tamoksifen dirençli (TamR) hücrelerde, dirençli olmayan hücre hatlarına kıyasla daha düşük olduğunu göstermiştir. Erbin seviyesi si-RNA transfeksiyonu ile baskılandığında, MDA-MB-231 hücrelerinde anti-apoptotik belirteçlerin protein seviyesinin arttığı, anti-apoptotik belirteçlerin ise azaldığı görülmüştür. Erbin seviyesi düşürülmüş MDA-MB-231 ve MCF-7 hücrelerinde hücre canlılığını ve çoğalmasını destekleyen proteinler artmıştır. Ayrıca, Erbin seviyesi azaldığında, MDA-MB-231 hücrelerinin doksorubisine karşı ölüm oranları azalmış, ancak MCF-7
v
hücrelerinde tamoksifen tedavisi ile önemli bir değişiklik olmamıştır. Son olarak, yüksek Erbin ifadesine sahip ve tamoksifen, kemoterapi veya trastuzumab ile tedavi edilen meme kanseri hastaları, daha yüksek seviyelerde DNA hasarı ve apoptoz ile ilgili genlere sahiptir. Öte yandan, düşük Erbin ifadesi olan hastalar daha yüksek seviyelerde siklin CDK'larına ve anti-apoptotik genlere sahiptir. Sonuç olarak Erbin, meme kanseri hücrelerinin ilaç direncinde önemli bir rol oynayabilir ve Erbin seviyesinin azalması meme kanseri hücrelerinde ilaç direncini artırabilir.
vi
vii
ACKNOWLEDGEMENTS
I would first like to express my gratitude to my supervisor Assoc. Prof. Dr. Işık Yuluğ for her supervision. I know her since my undergraduate years and she was the most helpful and kindest instructor. I started working at her lab as an undergraduate student and continued as a master student. I am so lucky to be a member of her lab for almost four years. She was always very supportive and encouraging to me from the first day of my studies. I also thank her for allowing me study independently and creating a comfortable working environment during this time.
I am very grateful to Assoc. Prof. Dr. Özgür Şahin to share their drug resistant cell lines, antibodies and their bioinformatics analyses for my thesis experiments. I also thank his lab members, they always helped me and patiently answered my questions about their experiments.
I would like to thank Assist. Prof. Onur Çizmecioğlu and Assoc. Prof. Dr. Bala Gür Dedeoğlu for giving their precious time to evaluate my thesis and being my jury member. I am also very grateful to Assist. Prof. Onur Çizmecioğlu for his guidance during my assistantship to his course and his great support for my undergraduate and graduate studies.
I am very thankful to Assoc. Prof. Dr. Özlen Konu to support me in my undergraduate and graduate studies and to share their antibodies for my thesis experiments. She was always kind to me.
I would like to express my special thanks to the past and present members of Yuluğ Group. Dr. Eda Süer was like a mentor to me. I am so grateful for her precious support, invaluable advices and her friendship. She always shared her intellectual experiences. I would like to thank Sedef Köseer for her help and friendship. I am very thankful to Nazlı Değer. She taught me everything about the lab and shared her work experiences. Also, she was a genuine friend for me both in the lab and outside. We shared great memories. Last but not least, I am so grateful to Zeynep Ilgım Özerk. We started and finished together our masters. She is like a sister to me. We shared both good memories but also difficulties and painful times during our master studies. We laughed and cried together. I hope our great friendship will continue for a long time.
viii
I also would like to thank Melike Demir, Sena Atıcı, Damla Güneş, Büşra Korkmaz and Kübra Yılmaz for their endless support and friendship. I feel so happy to meet them. We had great memories together in the lab and outside.
I am specially thanks to Ali Osman Çetin for his support, positive energy and patience for my undergraduate and graduate studies. He always listened and helped me through all my challenges and exhaustions.
Lastly but most importantly, I am so grateful to my mother and father for their unconditional and invaluable support, patience and love. They always trusted me. Without their help, I couldn’t achieve what I did so far in my life. I am so glad to have them.
ix
TABLE OF CONTENTS
ABSTRACT ... ii ÖZET ... iv ACKNOWLEDGEMENTS ... vii TABLE OF CONTENTS ... ix LIST OF FIGURES ... xiLIST OF TABLES ... xii
ABBREVIATIONS ... xiii
CHAPTER 1. INTRODUCTION ... 1
1.1. CANCER ... 1
1.2. BREAST CANCER ... 2
1.2.1. Molecular Classification of Breast Cancer ... 2
1.2.2. Treatment of Breast Cancer ... 3
1.3. DRUG RESISTANCE IN CANCER ... 3
1.3.1. Chemotherapeutic Drugs: Doxorubicin ... 4
1.3.2. Endocrine Therapy: Tamoxifen ... 5
1.4. APOPTOSIS AND CANCER ... 7
1.4.1. Intrinsic (Mitochondrial) Pathway ... 8
1.5. ERBIN ... 9
1.5.1. Role of ERBIN in Different Signaling Pathways ... 9
1.5.2. ERBIN and Cancer ... 11
The Role of Erbin in Breast Cancer ... 11
1.6. AIM OF THE STUDY ... 12
1.7. EXPERIMENTAL DESIGN ... 13
CHAPTER 2. MATERIAL AND METHODS ... 14
2.1. MATERIALS ... 14
2.1.1. General Laboratory Materials ... 14
2.1.1.1. Chemicals and Reagents ... 14
2.1.1.2. Solutions ... 15
2.1.1.3. Kits ... 16
2.1.1.4. Primers ... 16
2.1.1.5. Antibodies... 17
2.1.1.6. Equipment... 18
2.1.2. Cell Culture Materials ... 18
2.1.2.1. Cell Culture Reagents ... 18
2.1.2.2. Cell Lines and Mediums ... 19
2.1.2.3. Nucleic Acids ... 20
x
2.2.1. Cell Culture Based Techniques ... 21
2.2.1.1. Cell Culture Maintenance and Culture Conditions ... 21
2.2.1.2. Transient Transfection ... 21
2.2.1.3. SRB Assay ... 22
2.2.1.4. Crystal Violet Assay ... 23
2.2.2. Laboratory Techniques ... 23
2.2.2.1. Total Protein Isolation from Cell Pellets ... 23
2.2.2.2. Protein Quantification with BCA Protein Assay ... 24
2.2.2.3. SDS-PAGE ... 24
2.2.2.4. Western Blot ... 25
CHAPTER 3. RESULTS ... 26
3.1. HIGH ERBIN EXPRESSION PREDICTS BETTER SURVIVAL IN TREATED BREAST CANCER PATIENTS ... 26
3.2. PROTEIN LEVEL OF ERBIN IN DRUG SENSITIVE AND RESISTANT BREAST CANCER CELL LINES ... 27
3.3. DOSE RESPONSES OF RESISTANT AND WT CELLS AGAINST ANTI-CANCER DRUGS ... 28
3.3.1. Dose Response of MDA-MB-231 WT and DoxR Cells Against Doxorubicin ... 29
3.3.2. Dose Response of MCF-7 WT and TamR Cells Against Tamoxifen ... 30
3.4. MOLECULAR CHARACTERIZATION OF DOXORUBICIN AND TAMOXIFEN RESISTANCE ... 32
3.4.1. Molecular Alterations in Doxorubicin Resistant MDA-MB-231 Cells ... 33
3.4.2. Molecular Alterations in Tamoxifen Resistant MCF-7 Cells ... 34
3.5. DOWNREGULATION OF ERBIN CHANGES REGULATION OF DIFFERENT PATHWAYS ... 37
3.5.1. Erbin Silencing and Doxorubicin Resistance in MDA-MB-231 Cells ... 37
3.5.2. Erbin Downregulation and Tamoxifen Resistance in MCF-7 Cells ... 41
3.6. REDUCED LEVEL OF ERBIN AFFECTS CELL VIABILITY AGAINST DRUG TREATMENT ... 45
3.6.2. Downregulation of Erbin Does Not Affect Cell Viability Against Tamoxifen ... 47
3.7. IN SILICO ANALYSES OF DIFFERENTIALLY EXPRESSED GENES BASED ON LOW AND HIGH ERBIN EXPRESSION ... 48
3.8. OVEREXPRESSION OF ERBIN IN DRUG RESISTANT CELL LINES ... 50
CHAPTER 4. DISCUSSION ... 51
4.1. ERBIN AND DOXORUBICIN RESISTANCE ... 52
4.2. ERBIN AND TAMOXIFEN RESISTANCE ... 55
CHAPTER 5. FURTHER PERSPECTIVES ... 58
REFERENCES ... 59
xi
LIST OF FIGURES
Figure 1.1. Estimated Number of New Cancer Cases and Deaths Worldwide in 2020………..….. 1
Figure 1.2. Scheme of Doxorubicin Mechanism of Action………...…… 5
Figure 1.3. Mechanism of Tamoxifen and Tamoxifen Resistance………...…..…... 6
Figure 1.4. Intrinsic Apoptosis Pathway……….………....……... 8
Figure 1.5. The Role of Erbin in Different Signaling Pathways………...………..…...….. 10
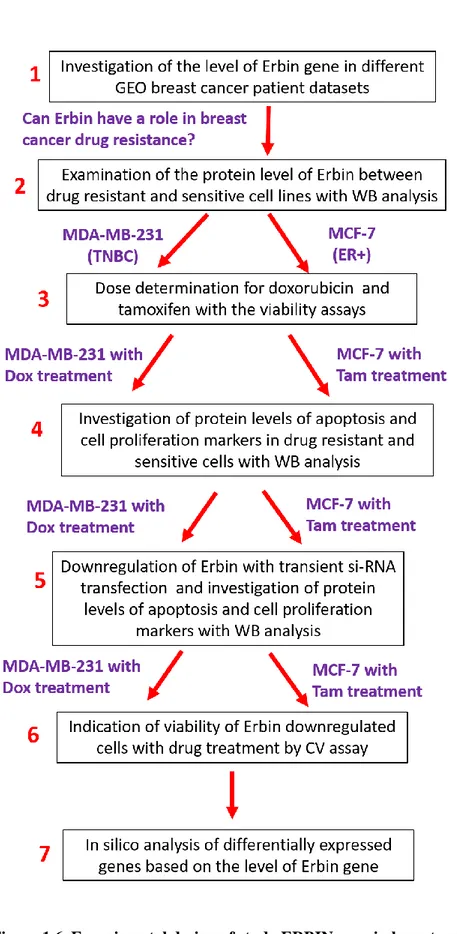
Figure 1.6. Experimental design of study ERBIN gene in breast cancer drug resistance…..….... 13
Figure 3.1. High Erbin expression predicts better survival in breast cancer patients treated with chemotherapy or targeted therapies………...………….. 26
Figure 3.2. Western Blot results of different WT and resistant cell lines for Erbin expression ………...……….. 28
Figure 3.3. Dose response results of doxorubicin resistant MDA-MB-231 cells and its sensitive counterpart………...………..…………. 29
Figure 3.4. Crystal violet results of doxorubicin treated WT and DoxR cells………...………... 30
Figure 3.5. Dose response results of tamoxifen resistant and sensitive MCF-7 cells……….. 31
Figure 3.6. Crystal violet results of tamoxifen treated WT and TamR cells……… 32
Figure 3.7. Western Blot results of doxorubicin treated WT and DoxR cells with characteristic changes in apoptosis and cell cycle proteins……… 33
Figure 3.8. Western Blot results of tamoxifen treated WT and TamR cells with characteristic changes in different pathways………. 35
Figure 3.9. Silencing of the Erbin gene affects the intrinsic apoptotic pathway as a result of doxorubicin treatment………. 38
Figure 3.10. Silencing of the Erbin gene affects the downstream proteins of cell cycle and DNA damage response pathways as a result of doxorubicin treatment……….. 40
Figure 3.11. Silencing of the Erbin gene affects PI3K pathway……… 41
Figure 3.12. Downregulation of the Erbin gene affects the intrinsic apoptotic pathway as a result of tamoxifen treatment……… 42
Figure 3.13. Downregulation of the Erbin gene affects the downstream proteins of cell cycle and DNA damage response pathways as a result of tamoxifen treatment……… 44
Figure 3.14. Downregulation of the Erbin affects ER expression and PI3K pathway…………... 45
Figure 3.15. Crystal violet results of Erbin silenced and doxorubicin treated cells………. 46
Figure 3.16. Crystal violet results of Erbin downregulated and tamoxifen treated cells…………. 47
Figure 3.17. Differential expression analyses of GSE16446 dataset……….. 49
xii
LIST OF TABLES
Table. 2.1. The list of chemicals, reagents and enzymes used for general laboratory processes… 14
Table. 2.2. The list of routinely used solutions/ buffers………... 15
Table 2. 3. The list of Kits utilized in the experiments………...….……… 16
Table 2. 4. The list of primers used in the study………..………... 16
Table 2. 5. The list of antibodies used in the western blots……….. 17
Table 2. 6. Antibodies kindly provided by Assoc. Prof. Dr. Özlen Konu and Assoc. Prof. Dr. Özgür Şahin………..…. 17
Table 2. 7. The list of equipment used in the experiments………..… 18
Table 2.8. The list of chemicals, reagents and kits used in cell culture experiments………... 18
Table 2. 9. Cell lines and their growth mediums used for our experiment are……...………. 19
Table 2.10. The list of nucleic acids that were used in transfection………. 20
xiii
ABBREVIATIONS
AKT V-akt murine thymoma viral oncogene homolog APS Ammonium peroxodisulfate
BAX BCL2-associated X protein BCA Bicinchoninic acid
Bcl-2 B-cell lymphoma 2 protein Bcl-xL B-cell lymphoma-extra large BSA Bovine Serum Albumin CASP Caspase
CDK Cyclin-dependent kinases ddH2O Double distilled H2O
DMEM Dulbecco’s Modified Eagle Medium DoxR Doxorubicin resistant
ECL Enhanced chemiluminescence EGFR Epidermal growth factor receptor 1 ER Estrogen receptor
ERBB2 Proto-oncogene erb-b2 receptor tyrosine kinase 2 ERK Extracellular signal-regulated kinase
EMT Epithelial-mesenchymal-transition FBS Fetal bovine serum
GEO Gene Expression Omnibus
HER2 Human epidermal growth factor receptor 2 kDA Kilo Dalton
xiv p21 Cyclin-dependent kinase inhibitor 1 PBS Phosphate buffered saline
PI3K Phosphoinositide 3-kinase PVDF Polyvinylidene difluoride RB Retinoblastoma protein
RIPA Radioimmunoprecipitation assay RT Room temperature
SDS-PAGE Sodium dodecyl sulfate polyacrylamide gel electrophoresis Ser Serine
siRNA Small interfering RNA TamR Tamoxifen resistant
TBS-T Tris buffer saline Tween20 TGF-β Transforming growth factor beta Thr Threonine
1
CHAPTER 1. INTRODUCTION
1.1. CANCER
Cancer is a disease that begins with aberrant proliferation of the cells and it can occur in any place in the body. There are numerous kinds of cancer types. Although these cancer types have different features and treatments [1], they have some common abilities in their development. These capabilities comprise resistance to cell death, sustainment of proliferative signaling, avoidance of growth suppressors, activating invasion and metastasis, enabled replicative immortality and inducement of angiogenesis [2,3].
Cancer causes millions of deaths every year. According to the World Health Organization, an
estimated 19.3 million new cancer cases and 10 million deaths were reported worldwide in 2018. Breast, lung, colorectum and prostate cancer are the most common types of cancer in the world [4].
Figure 1.1. Estimated Number of New Cancer Cases and Deaths Worldwide in 2020 (Taken from
2
1.2. BREAST CANCER
Breast cancer is the most prevalent and mortal cancer observed among females. In 2020, 2.3 million women were diagnosed with breast cancer and 0.7 million people died due to breast cancer [3,4].
Breast cancer is initiated from mammary gland lobules. It is a heterogeneous disease [6]. For this reason, it needs to be classified efficiently for accurate diagnosis of subtypes and determination of therapeutic treatments [7]. There are three types of receptors that take a part in the development of breast cancer tumor cells. Estrogen receptor alpha (ERα), progesterone receptor (PR) and human epidermal growth factor receptor 2 (HER2) mainly have a role in the proliferation and maintenance of breast tumors [8].
1.2.1. Molecular Classification of Breast Cancer
Breast cancer is classified into at least five groups according to its receptor status. These subtypes are luminal A, luminal B, HER2, basal and normal. These subtypes are divided mainly based on the presence of the estrogen receptor. Luminal A and luminal B are ER-positive, whereas HER2, basal and normal-like breast cancers are ER-negative [8, 9]. Each class has a different diagnosis, and characteristics, and histological features controlled by distinct biological processes and responses to the therapy [10, 11].
Luminal A and luminal B-like tumors are ER-positive but they are different from each other at the level of gene expression of HER2. Luminal A subtypes do not express HER2, whereas luminal B subtypes are HER2 positive tumors. In addition, luminal A cancers have a higher level of ER-activated genes and a lower proliferation rate than luminal B cancer. Accordingly, the luminal A type has a better prognosis [12-14].
HER2 breast cancers have overexpressed HER2 and do not express ER and PR. They grow faster. HER2 breast cancers have a worse prognosis and are more aggressive than luminal type [15, 16].
Basal-like type contains triple negative breast cancers (TNBC) that lack any of the indicated three receptors. They are mostly affected by mutations of tumor suppressor genes such as p53
3
and BRCA1. TNBCs are larger in size, more aggressive and have higher histological grade compared to other subtypes of breast cancer, which indicates proliferative properties with high metastatic ability. Patients having TNBC have the poorest prognosis and the shortest survival times [17-19].
1.2.2. Treatment of Breast Cancer
Treatment of the different types of breast cancers varies depending on their molecular subgroups. Luminal and HER2 breast cancers enable targeted hormone therapy. Because luminal breast cancers are ER-positive, targeting ER and utilizing estrogen antagonists such as tamoxifen results in promising treatment. Similarly, HER2 breast cancers are treated with trastuzumab that is a monoclonal antibody inhibiting HER2 activity. Trastuzumab is mostly combined with chemotherapeutic drugs [12-16].
The main treatment for TNBC is chemotherapy because women having TNBC cannot take endocrine therapy or trastuzumab due to the lack of receptors. There are still no targeted therapies for TNBC. Although researchers have developed some therapeutic approaches for TNBC such as platinum salts, PARP inhibitors, anti-VEGF-A and anti-EGFR therapies, specific therapies are not available for medical treatments. Clinical trials do not show such significant results for these different approaches [17-20].
Targeted hormone therapy and chemotherapy are important for the treatment of breast cancer. Patients can develop resistance to the treatment. The understanding of the resistance mechanism is required for the benefit of the patients.
1.3. DRUG RESISTANCE IN CANCER
Cancers have been able to develop resistance to drugs and this is commonly observed against both chemotherapy and targeted therapies. Drug resistance can be de novo or acquired. Intrinsic or de novo resistance stems from some genetic mutations in the genome before any treatment, whereas acquired resistance is gained after treatment [21, 22].
Anticancer drug resistance occurs by several molecular mechanisms. Drug efflux or influx is one of the reasons that result in drug resistance. It hampers the transportation of the drug into
4
targeted cancer cells. Drug target alteration or inactivation also decreases the effectiveness of the drug and leads to resistance. There can be some mutations that change apoptosis and DNA damage repair pathways in cancer cells. Cancer cells can increase their ability to repair DNA damage and their evasion of the apoptosis mechanism, and inhibit cell death due to these mutations, despite anticancer drugs. [21-24]. Besides, epithelial-mesenchymal-transition (EMT) and some epigenetic alterations in cancer cells are mechanisms that cause drug resistance [22].
1.3.1. Chemotherapeutic Drugs: Doxorubicin
Triple negative breast cancer is an infrequent (15%) breast cancer type but it has a very poor prognosis due to its lack of specific targets, aggressiveness and metastatic nature. Conventional chemotherapy is the major treatment for TNBC patients. Anthracyclines that are generally combinations of doxorubicin and taxanes are the most commonly utilized drugs for chemotherapy [25].
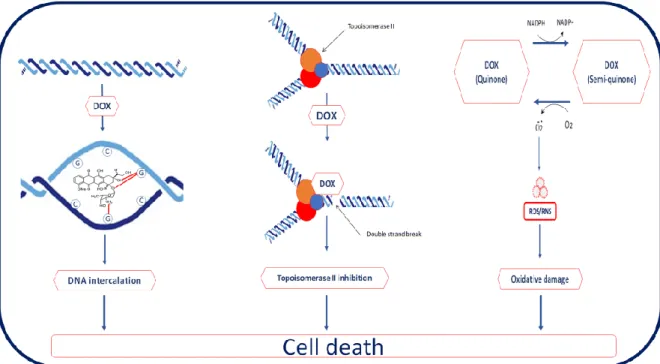
Doxorubicin that is isolated from Streptomyces peucetius species is an anthracycline drug. It is used for the treatment of many cancer such as leukemia, breast, lung, soft tissue sarcoma and Hodgkin’s lymphoma [26]. Doxorubicin inhibits the proliferation of cancer cells by three distinct mechanisms. First, it binds to and intercalates DNA, and it then stops DNA synthesis by inhibiting DNA polymerase. Also, doxorubicin inhibits RNA synthesis and transcription. Second, doxorubicin prevents topoisomerase II that is an enzyme relaxing the supercoils in DNA and enabling DNA replication. Both mechanisms of doxorubicin result in double breaks in DNA and trigger apoptosis. Another mechanism of doxorubicin is the production of reactive free radicals. It leads to oxidative damage and cleavage of DNA [27, 28].
Doxorubicin enables cell death by inducing apoptosis, autophagy, necrosis and early senescence [30]. Doxorubicin casuses apoptosis by initiating AMP-activated kinase (AMPK) that activates p53. The p53 protein downregulates the anti-apoptotic protein Bcl-2 and upregulates the pro-apoptotic protein Bax. This regulation initiates apoptosis in cancer cells. Upregulation of p53 also triggers cell arrest and the senescence mechanisms. Doxorubicin can also cause autophagy by oxidative stress that results in the production of ROS in the mitochondria [27].
5
Figure 1.2. Scheme of Doxorubicin Mechanism of Action. Doxorubicin causes cell death in three
ways; (I) intercalation of DNA, (II) Topoisomerase II inhibition, (III) free radical related damage. (Taken from El-Agamy et al., 2019 [29])
Similar to other drugs, doxorubicin resistance is commonly seen in TNBC patients. As explained above; drug efflux, and mutations in apoptotic and DNA damage repair pathways resulting in inhibition of cell death can promote resistance [31]. When the level of topoisomerase II changes, it can also affect doxorubicin resistance [22]. The exact reason for the chemoresistance to doxorubicin is unknown. Further studies are required to explain the mechanism causing the development of doxorubicin resistance in cancer cells [33].
1.3.2. Endocrine Therapy: Tamoxifen
Most of the breast cancer patients are ER-positive. They are treated with endocrine therapy to inhibit ER signaling [34]. ER signaling is activated by its ligand estrogen or in an estrogen-independent manner via other transcription factors. In the classical pathway, estrogen enters the cell and binds to ER in the nucleus. After binding of the estrogen, the ER undergoes conformational alteration. It is dimerized and becomes phosphorylated. Then, the ER binds to the estrogen response element (ERE) that is upstream of estrogen dependent genes [35]. Alternatively, activation of the ER can occur outside of the nucleus. Growth factor signaling pathways can also activate the ER. The TORC1 effector p70S6K, ERK and effector AKT can
6
enable phosphorylation of the ER and estrogen dependent or independent ER transcriptional activity [36].
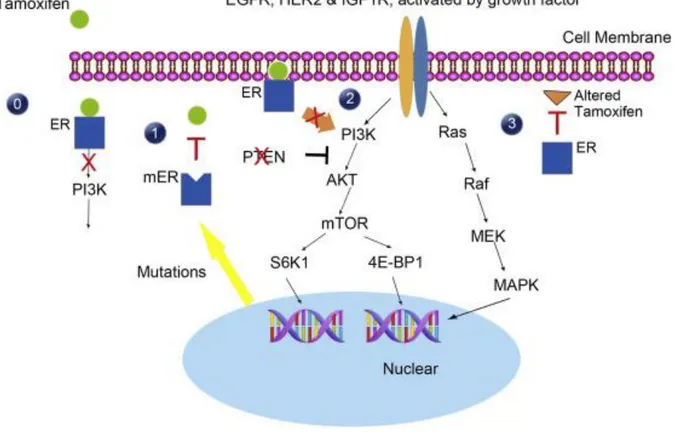
The activation of the ER pathway is blocked by multiple anti-estrogen mechanisms for the treatment of ER-positive breast cancer patients. Selective ER modulators (SERMs) prevent the activity of ER. Tamoxifen is a SERM that is commonly used in endocrine therapy. Another mechanism is that selective ER down-regulators (SERDs) such as fulvestrant which destabilize and degrade ER. Lastly, aromatase inhibitors (AIs) provide the decrease of the production of estrogen by blockage of the enzyme aromatase [37].
Figure 1.3. Mechanism of Tamoxifen and Tamoxifen Resistance. (0) Tamoxifen blocks ER signaling
by binding to ER. (1) Mutations in the ESR1 gene, (2) bypassing inhibition of ER signaling by using alternative pathways or blockage of tumor suppressor PTEN and (3) reducing active drug concentration by altering tamoxifen can cause resistance (Taken from Yuan et al., 2016 [38])
7
Although tamoxifen is the most prevalent treatment for ER-positive patients, tamoxifen resistance is developed in many breast cancers. The status of ER and its crosstalk with other growth factor pathways can promote the resistance of tamoxifen. First, mutations in the ER gene can occur and it alters phenotype the ER-positive phenotype to negative without loss of ER. Lack of ER expression promotes tamoxifen resistance [35, 38]. Second, cancer cells activate ER pathway by downregulation of tumor suppressor genes such as PTEN or upregulation of drug resistance drivers such as AKT even if there is estrogen blockage by tamoxifen [18]. Oncogenic signaling pathways including growth factor receptor tyrosine kinases (HER2 and EGFR), PI3K/AKT/mTOR pathway and Rb phosphorylation are associated with tamoxifen resistance [36, 39]. Third, tamoxifen resistance stems from the decrease of the concentration of active tamoxifen. Tamoxifen metabolism can change and it affects the efficiency of the drug [38].
Because ER signal transduction is very complex, resistance against tamoxifen is caused by many molecular mechanisms. Reasons for the resistance should be understood very well and alternative strategies should be found.
1.4. APOPTOSIS AND CANCER
Apoptosis is a mechanism that results in programmed cell death [40]. When this programmed cell death is inactivated, it can cause developmental abnormalities, tumorigenesis and other serious health problems [41]. Escape from apoptosis or resistance to cell death is one of the hallmarks of cancer. The growth control systems that manage tissue homeostasis and cell proliferation are associated with apoptosis. For this reason, the resistance of cancer cells to apoptosis is an important feature of cancer development [42].
There are two different apoptosis pathways, intrinsic and extrinsic pathways. The intrinsic or mitochondrial pathway is initiated by intracellular stress, whereas the extrinsic or death receptor pathway is activated by extracellular ligands. Though these two apoptotic pathways result in the activation of common caspases, their mechanisms differ from each other [41-44].
8
1.4.1. Intrinsic (Mitochondrial) Pathway
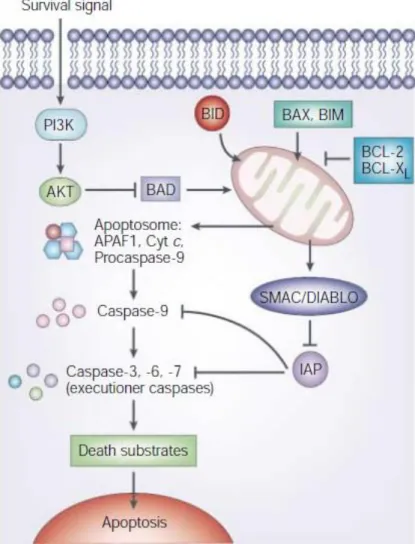
Commonly used anticancer therapies kill the cancer cells by the intrinsic apoptosis pathway [24]. The mitochondrial pathway is initiated by Bax or Bak entry into the mitochondrial membrane. It leads to the release of cytochrome c molecules from mitochondria to the cytosol. BH3-only proteins Bid and Bim help the pro-apoptotic action of Bax and Bak. Released cytochrome c binds to Apaf-1. They form a complex that is named “apoptosome” in the presence of ATP. Then, pro-caspase-9 binds to the apoptosome complex and gets activated. Activated initiator caspase which is caspase-9 cleaves executioner caspases such as caspase-3 and caspase 7. Cleavage of caspase-3 and caspase-7 provides their activation. Eventually, active executioner caspases cleave cellular substrates and it starts apoptosis [41, 45].
Figure 1.4. Intrinsic Apoptosis Pathway. Apoptosis through mitochondria is initiated by pro-apoptotic proteins that promote the release of cytochrome c. Activation of initiator and executioner caspases provide apoptosis. It can be prevented by anti-apoptotic proteins. (Taken from Igney et al., 2002 [42])
Release of cytochrome c is prevented by anti-apoptotic Bcl-2 family members such as Bcl-2 and Bcl-XL. Bcl-2 and Bcl-XL bind to Bax and Bak proteins and hinder their action [42]. Apoptosis can be blocked by inhibitors of apoptosis proteins (IAPs) that inactivate caspases.
9
IAPs are regulated by the Smac/DIABLO protein [46]. Another way of avoidance from apoptosis is activation of the PI3K pathway by growth factors and cytokines. The AKT protein that is activated by PI3K phosphorylates the pro-apoptotic Bad protein and inactivates it [47, 48].
Cancer treatment by chemotherapy induces apoptosis in cancer cells. Defects or mutations in the apoptotic pathway directly affect the therapy and make cancer cells resistant to anti-cancer drugs. Cancer cells can gain resistance to apoptosis and therapeutic drugs by overexpression of anti-apoptotic proteins or downregulation of pro-apoptotic proteins [48]. Some studies have demonstrated that cancers expressing a high level of the Bcl-2 and Bcl-XL anti-apoptotic proteins have resistance to chemotherapeutic drugs [49-51]. Besides, some signaling pathway kinases such as ERK, mTOR, RAS, RAF and growth factor receptors including EGFR and HER2 are linked to the apoptotic pathways. Tumor cells are dependent on these pathways. Mutations in these pathways can also inhibit apoptosis and causes resistance [48].
1.5. ERBIN
Erbin is a novel protein that is a LAP family member. Erbin has 16 leucine-rich repeats (LRR) and a single PDZ domain in its C terminus [52, 53]. It interacts specifically with ERBB2 (HER2) receptor by its PDZ domain and plays a role in the localization of ERBB2 to the basolateral domain in epithelia [52-54]. Previously, Erbin was known as an ERBB2 interacting protein. Erbin has been extensively studied for its biological function. Recently, new researches indicate its new binding partners and Erbin has become a novel type of adaptor protein. Numerous proteins have been found to be ligands of the Erbin PDZ domain [55]. It contributes to many cell signaling mechanisms such as MAPK, TGF-β and other pathways [56, 57].
1.5.1. Role of ERBIN in Different Signaling Pathways
The MAPK signaling pathway has a crucial role in cell proliferation, differentiation and migration in the cell. This pathway relies on the activation of receptor tyrosine kinase (RTK) by phosphorylation and the pathway continues by initiating a protein kinase cascade [58]. Erbin is a negative regulator of the MAPK signaling pathway. It inhibits MAPK activation by disturbing the interaction between Ras and Raf kinases. Erbin interacts with the active Ras
10
protein and they form a complex. As a result, the formation of this complex prevents the interaction of Raf with Ras and it becomes unable to activate Raf [59, 60].
Figure 1.5. The Role of Erbin in Different Signaling Pathways (Taken from Jang et al., 2020 [57])
TGF- β signaling has a part in cell growth, development, cell differentiation and apoptosis. Smad2 and Smad3 proteins that are intracellular mediators for TGF- β signaling are phosphorylated and oligomerize with Smad-4. This complex regulates the transcription of TGF- β upstream genes [61]. It is concluded that Erbin is a novel negative regulator of TGF- β signaling pathway. It binds to the Smad2/3 complex and inhibits the association of this β complex with Smad4. [62-64]. Therefore, Erbin has tumor suppressor properties in many cancer types by regulating the TGF-β signaling pathway. In addition, it prevents TGF-β-induced EMT by regulating the MAPK signaling pathway. Studies have demonstrated that deficiency of Erbin expression leads to the differentiation of epithelial cells into mesenchymal cells [65, 66].
11
1.5.2. ERBIN and Cancer
Erbin has different roles in different cancer types and diseases. It takes a part in various pathways in the cell. Studies indicate that Erbin behaves as both an oncogenic and a tumor suppressor protein. Erbin promotes tumorigenesis in hepatocellular carcinoma, gastric cancer, colon cancer and skin cancer [67-71].
In contrast, Erbin inhibits STAT3 activation in cervical cancer. The deficiency of Erbin enhances proliferation and migration of the cells, and leads to resistance of cervical cells to anoikis [72]. Another study has shown that Erbin is a negative regulator of Akt-Skp-p27 pathway. The depletion of Erbin increases S-phase entry by downregulation of p21 and p27 proteins [73]. In colorectal cancer, it also prevents migration and invasion of cancer cells. Knockdown of Erbin promotes EMT [74]. Moreover, overexpression of Erbin decreases cell proliferation and differentiation in AML cells [75].
The Role of Erbin in Breast Cancer
There are different results for the function of Erbin in breast cancer. According to Liu et al., Erbin has tumor suppressor properties in breast cancer. The expression of Erbin is downregulated and protein levels are low in Erbb2 overexpressing breast cancer cells. Loss of Erbin provides the migration in these cells. It is proved that Erbin inhibits heregulin-induced AKT phosphorylation in Erbb2 overexpressing breast cancer cells. Besides, knockdown of Erbin results in trastuzumab resistance in breast cancer cells [76].
On the other hand, some studies have defended that Erbin acts as an oncogene. They show that Erbin increases the Erbb2 dependent cell proliferation and tumorigenesis in breast cancer. Erbin knockdown promotes Erbb2 degradation. It inhibits Erbb2 signaling, and decreases tumor formation. As a result, Erbb2 tumorigenesis is prevented by loss of Erbin in vivo in mice. These results indicate that Erbin is a positive regulator of Erbb2 dependent breast tumor formation and development. [77, 78]
The role of Erbin in human breast cancer is controversial. Neither the potential function that Erbin plays role in tumorigenesis nor the regulating mechanism is unclear. Further experiments are needed to understand the complete role of Erbin in breast cancer.
12
1.6. AIM OF THE STUDY
Erbin is an ERBB2 interacting protein with roles in many signaling pathways. Breast cancer is one of the types of cancer that is affected by Erbin regulation. However, it is unclear how Erbin regulates the biological behavior and drug resistance of breast cancer cells. Some studies have claimed that Erbin promotes tumorigenesis and demonstrates oncogenic features in breast cancer, whereas others have indicated that it inhibits breast cancer development. The main aim of our study was to explore the role of the Erbin gene against doxorubicin and tamoxifen resistance in breast cancer.
Bioinformatics analysis of GEO datasets has shown that a high level of ERBIN expression predicts better survival in breast cancer patients treated with chemotherapy or targeted therapies while the Erbin level does not change the survival rates of untreated breast cancer patients. We hypothesized that the Erbin expression level can alter the effect of the drug treatment and a reduced level of Erbin promotes resistance against doxorubicin and tamoxifen. First, we evaluated whether there was any difference at the protein level of Erbin between the drug resistant and sensitive cell lines. The MDA-MB-231 TNBC cell line was used for doxorubicin resistance and the MCF-7 ER+ luminal cell line was used for tamoxifen resistance. Apoptotic markers were checked in drug resistant and sensitive cells, because drug resistance can be associated with apoptotic pathways. Next, Erbin expression was downregulated by the si-RNA technology in naive MDA-MB-231 and MCF-7 cells. In this way, we evaluated whether a decreasing level of Erbin promotes resistance behavior of drug sensitive cancer cells. The genes affected by the downregulation of Erbin were also evaluated. Thus, we tried to review how Erbin regulates the doxorubicin and tamoxifen resistance.
13
1.7. EXPERIMENTAL DESIGN
14
CHAPTER 2. MATERIAL AND METHODS
2.1. MATERIALS2.1.1. General Laboratory Materials
General laboratory materials include routinely used substances that are chemicals, solutions, kits, equipment. Table 2.1 lists information including the catalog numbers and the companies of these materials.
2.1.1.1. Chemicals and Reagents
Table. 2.1. The list of chemicals, reagents and enzymes used for general laboratory processes.
Name Catalog Company (Country)
2-mercaptoethanol M3148 Sigma Aldrich (USA)
Agarose BHE500 Prona (Spain)
Ampicillin A0839 Applichem (Germany)
Agar 05039 Sigma Aldrich (USA)
Acrylamide A9099 Sigma Aldrich (USA)
Ammonium persulfate A3678 Sigma Aldrich (USA)
Bis-acrylamide M7279 Sigma Aldrich (USA)
Bovine Serum Albumin Fraction V (BSA) 10735078001 Roche (USA)
Bromophenol blue B5525 Sigma Aldrich (USA)
Crystal Violet V5265 Sigma Aldrich (USA)
DEPC A0881 Applichem (Germany)
Ethidium Bromide 17898 Thermo Scientific (USA)
EDTA A3562 Applichem (Germany)
ECL Prime System RPN2232 Life Sciences (USA)
Gene Ruler DNA Ladder (1 kb) SM0311 Thermo Scientific (USA)
Gene Ruler DNA Ladder (50 bp) SM373 Thermo Scientific (USA)
Glycine G8898 Sigma Aldrich (USA)
KCl 12636 Sigma Aldrich (USA)
15
NaCl 31434 Sigma Aldrich (USA)
Proteinase K P2308 Sigma Aldrich (USA)
Proteinase inhibitor (PI) cocktail P8340 Sigma Aldrich (USA)
PageRuler Prestained Protein Ladder, (170kDa) 26616 Thermo Scientific (USA)
PageRuler Prestained Protein Ladder, (250kDa) 26619 Thermo Scientific (USA)
Rnase A R6513 Sigma Aldrich (USA)
Roche PVDF Membranes (0.2uM) 3010040001 Roche (USA)
SDS 71725 Sigma Aldrich (USA)
Sulforhodamine B (SRB) 230162 Sigma Aldrich (USA)
Taq DNA Polymerase EP0402 Sigma Aldrich (USA)
TEMED 1610801 Biorad (USA)
Tris T1503 Sigma Aldrich (USA)
Tween-20 822184 Merck (Germany)
Trichloroacetic acid (TCA) 33731 Sigma Aldrich (USA)
Yeast extract 1702 Conda (Spain)
2.1.1.2. Solutions
Table. 2.2. The list of routinely used solutions/ buffers.
Solution/Buffer Recipe
RIPA buffer (1 ml) 1 μl 1 M Tris-HCL (pH=8.0); 20 μl EDTA; 300 μl 5M
NaCl ; 100 μl NP-40; 40 μl 25X protease inhibitor 4x Protein Loading Buffer (5 ml) 0.02 g Bromophenol blue; 2 ml 20% SDS; 200 mM
Tris-HCL (pH=6.8); 30% glycerol. 5% β-mercaptoethanol is added before loading.
5X Running Buffer (1 L) 15 g Trisma Base; 72 g Glycine; 5 g SDS in dH2O
Wet Transfer Buffer ( 1 L) 6 g Trisma Base ; 28.8 g Glycine; 20 % methanol in dH2O
10X TBS (1 L) 12.19 g Tris base; 87.79 g NaCl in dH2O (pH = 8.0)
TBS-T (0.2%) (500ml) 1ml Tween-20 in 50 ml 10X TBS in ddH2O
Blocking solution (10 ml) (3%) 0.3 milk powder in 10 ml 1X TBS-T
Ponceau S staining solution 1g Ponceau S; 50 ml acetic acid in ddH2O
Mild stripping buffer (10 ml) 1.5 g glycine; 1g SDS; 1 ml Tween-20 in dH2O (pH =
16
10X PBS (1 L) 80.0 g NaCl; 2 g KCl; 14.4 g Na2HPO4.2H2O; 2.4 g
KH2PO4 in ddH2O (pH=7.4)
SRB solution (0.4%) (100 ml) 400 mg SRB; 1% acetic acid in dH2O.
Fixation Solution 10% acetic acid; 10% ethanol in dH2O
Crystal Violet Solution 0.4% crystal violet; 20% ethanol in dH2O
Destaining Solution 10% acetic acid; 90% dH2O
LB (100 ml) 1 g Tryptone; 1 g NaCl; 0.5 g yeast extract
50X TAE (100 ml) 24.2 g Tris-base; 5.71 ml glacial acetic acid; 10 mL 0.5M
EDTA (pH=8.0)
2.1.1.3. Kits
Table 2. 3. The list of Kits utilized in the experiments
Name of the Kit Catalog # Company Name (Country)
Nucleospin RNA extraction kit 740955 Macherey Nagel (Germany)
RevertAid First Strand cDNA Synthesis Kit K1622 Thermo Scientific (USA)
DyNAmo HS SYBR Green qPCR Kit F-410L Thermo Scientific (USA)
PureLink Quick Plasmid Miniprep Kit K210011 Thermo Scientific (USA)
Qiaquick Gel Extraction Kit 28706 Qiagen (USA)
Pierce™ BCA Protein Assay Kit 23225 Thermo Scientific (USA)
2.1.1.4. Primers
Primers that are utilized for qRT-PCR are listed in Table 2.4. All primers were purchased from and synthesized by Iontek (Istanbul). All primers were solved in nuclease-free water and their final concentration was 100 μM.
Table 2. 4. The list of primers used in the study
Primer PCR Primer Sequence (5’ to 3’) Tm (°C) Size (bp)
GAPDH F GAPDH R RT GGCTGAGAACGGGAAGCTTGTCAT CAGCCTTCTCCATGGTGGTGAAGA 60 140 ERBIN F ERBIN R RT CTAATCAGATTGAAGAGCTTCC AACTCCTGTATTCCATTCTTGC 60 122
17
2.1.1.5. Antibodies
The listed antibodies were used in western blot experiments. Their working concentrations were optimized under the guidance of their manufacturers.
Table 2. 5. The list of antibodies used in the western blots
Name of the antibody Catalog# Company
Rabbit anti-ERBIN Antibody * NA NA
Mouse anti-Actin Antibody A5441 Sigma-Aldrich
Rabbit anti-Calnexin Antibody C4731 Sigma Aldrich
Mouse anti-Bcl-2 (C-2) Antibody sc-7382 Santa Cruz Biotechnology
Mouse anti-Bcl-xL Antibody (H-5) sc-8392 Santa Cruz Biotechnology
Rabbit anti-Caspase-9 Antibody 9502 Cell signaling
Mouse anti- ERα Antibody (F-10) sc-8002 Santa Cruz Biotechnology
Anti-rabbit IgG-HRP A6154 Sigma-Aldrich
Anti-mouse IgG-HRP A0168 Sigma-Aldrich
* ERBIN antibody was a gift from Dr. Jean-Paul Borg (INSERM, Marseille, France). It was produced in his lab.
Table 2. 6. Antibodies kindly provided by Assoc. Prof. Dr. Özlen Konu and Assoc. Prof. Dr. Özgür Şahin
Name of the antibody Catalog# Company
Rabbit anti-Bax Antibody 5023P Cell signaling
Rabbit anti- p-
γ
H2AX Antibody sc-517348 Santa Cruz BiotechnologyRabbit anti-Cdk-2 Antibody C5223 Sigma Aldrich
Rabbit anti-p-RB Antibody 8516 Cell signaling
Mouse anti-p21 Antibody NA NA
Rabbit anti-AKT Antibody 9272 Cell signaling
Rabbit anti- p-AKT (Ser-473) Antibody 9275 Cell signaling
Rabbit anti- p-AKT (Thr-308) Antibody 9271 Cell signaling
Anti-rabbit cleaved Caspase-3 9664 Cell signaling
18
2.1.1.6. Equipment
Table 2. 7. The list of equipment used in the experiments
Name of the instrument Company
PCR Thermal cycler Applied Biosystems (USA)
AutoFlow NU-8500 Water Jacket CO2 Incubator NuAire (USA)
Centrifuges 5810 and 5810 R Eppendorf (Germany)
Amersham Imager 600 Dharmacon (USA)
NanoDrop ONE Thermo Scientific (USA)
BD Accuri™ C6 Cytometer BD Biosciences (USA)
Cell Culture Hood NuAire (USA)
2.1.2. Cell Culture Materials
Cell culture reagents, cell lines and their mediums that were used in the cell culture room were provided. Experiments were performed in aseptic conditions under the laminar flow hood.
2.1.2.1. Cell Culture Reagents
Table 2.8. The list of chemicals, reagents and kits used in cell culture experiments
Name Catalog # Company (Country)
DMEM Low Glucose w/o L-Glutamine w/ Sodium Pyruvate
L0064-500 Biowest (USA)
DMEM, low glucose, pyruvate, no glutamine, no phenol red
11880-028 Thermo-Fischer Scientific (USA)
Fetal Bovine Serum (FBS) CH30160 GE Healthcare (UK)
PBS L0615-500 Biowest (USA)
Trypsin/EDTA (0.25%) SV30031 GE Healthcare (UK)
Trypsin/EDTA (10X) Solution X0930-100 T Biowest (USA)
Non-Essential Amino Acids 11140035 Thermo-Fischer Scientific (USA)
Sodium Pyruvate (100mM) 11360 Thermo-Fischer Scientific (USA)
Penicillin/Streptomycin SV30010 GE Healthcare (UK)
19
Dimethyl sulfoxide (DMSO) A1584 Applichem (Germany)
Opti-MEM I 11058021 Thermo-Fischer Scientific (USA)
Lipofectamine RNAiMAX transfection reagent
13778075 Thermo-Fischer Scientific (USA)
4-Hydroxytamoxifen T176 Sigma Aldrich (USA)
Doxorubicin (Adriamycin)* NA NA
*Doxorubicin was bought by the pharmacy.
2.1.2.2. Cell Lines and Mediums
Table 2. 9. Cell lines and their growth mediums used for our experiment
Cell Line Medium
MDA-MB-231 WT DMEM/ Low Glucose; 10%FBS; 1%
Penicillin/Streptomycin; 1% nonessential amino acids
MDA-MB-231 DOXR DMEM/ Low Glucose; 10%FBS; 1%
Penicillin/Streptomycin; 1% nonessential amino acids
MCF-7 WT DMEM w/o phenol red; 10%FBS; 1%
Penicillin/Streptomycin; 1% nonessential amino acids ; 0.1% insulin
MCF-7 TAMR DMEM w/o phenol red; 10%FBS; 1%
Penicillin/Streptomycin; 1% nonessential amino acids; 0.1% insulin
BT-474 WT DMEM/ Low Glucose; 10%FBS; 1%
Penicillin/Streptomycin; 1% nonessential amino acids; 0.1% insulin
BT-474 TMABR DMEM/ Low Glucose; 10%FBS; 1%
Penicillin/Streptomycin; 1% nonessential amino acids; 0.1% insulin
SKBR-3 WT DMEM/ Low Glucose; 10%FBS; 1%
Penicillin/Streptomycin; 1% nonessential amino acids
SKBR-3 TMABR DMEM/ Low Glucose; 10%FBS; 1%
20
T47D WT DMEM w/o phenol red; 10%FBS; 1%
Penicillin/Streptomycin; 1% nonessential amino acids; 1% sodium pyruvate
T47D TAMR DMEM w/o phenol red; 10%FBS; 1%
Penicillin/Streptomycin; 1% nonessential amino acids; 1% sodium pyruvate
2.1.2.3. Nucleic Acids
Table 2.10. The list of nucleic acids that were used in transfection
Name Catalog # Company Target sequence
siGENOME Non-Targeting siRNA #2 D-001210-02-20 Thermo Scientific (USA) UAAGGCUAUGAAGAGAUAC Hs_ERBB2IP_7 FlexiTube siRNA SI00122766 Qiagen (USA) TTGGGCAGCTTACTAACTTAA Hs_ERBB2IP_12 FlexiTube siRNA SI03063704 Qiagen (USA) CAGACTCTATAGGAGGGTTAA
21
2.2. METHODS
2.2.1. Cell Culture Based Techniques
2.2.1.1. Cell Culture Maintenance and Culture Conditions
All cell lines were grown under sterile conditions at 37 °C with 5% CO2 and 95% humidity in
the incubator. Frozen cells were stored in liquid nitrogen. Cells were taken from the nitrogen and thawed in order to grow them. Growth medium was added into thawed cells and they were centrifuged to remove DMSO. After centrifuge, cell pellets were dissolved into the growth medium and moved into the T-25 flasks. When cells become 80%-90% confluent, they were passaged into T-75 flasks. Cell passage was repeated in 1:2-1:4 ratio when cells reached enough confluency. Passage time changed depending on the cell line. Generally, passage time for WT cells 3-4 days, whereas it is 5-7 days for resistant cell lines.
For cell passage, the growth medium was sucked with aspirator and cells were washed with PBS. Then, trypsin was added into cells and waited for 5 min in the incubator for detachment of the cells. Detached cells were centrifuged, the cell pellet was dissolved into a fresh growth medium. Cells were split and added into new T-75 flasks with fresh medium.
For storage of the cells, freezing medium that contains 90% FBS and 10% DMSO were prepared. After detachment of the cells from the flask, the cell pellet was dissolved into 1 ml of freezing medium and added into sterile cryo-vials. First, cells were stored at -20°C fridge for 1-2 hours. Then, they were transferred into a -80°C fridge. Cells were stored in liquid nitrogen for longer periods.
2.2.1.2. Transient Transfection
MDA-MB-231 and MCF-7 WT cells were transfected in order to silence the expression of Erbin gene. Cells were transfected with Hs_ERBB2IP_7 FlexiTube siRNA (si7-Erbin), Hs_ERBB2IP_12 FlexiTube siRNA (si12-Erbin) and siGENOME Non-Targeting siRNA #2 (scr-RNA). It was confirmed that there is no target for scr-RNA in the Erbin genome.
For the transfection, 200.000 cells/well for MDA-MB-231 cells and 250.000 cells/well for MCF-7 cells were seeded into 6-well plates. Next day, transfection procedure was performed.
22
First, 2.5 μl of si7-Erbin, si12-Erbin and scr-RNA were diluted in 250 μl of Opti-MEM in different tubes. Then, each diluted RNA was added into 250 μl of Opti-MEM containing 5 μl of Lipofectamine RNAiMAX transfection reagent. RNA-transfection reagent complexes in 500 μl of Opti-MEM were incubated for 20 mins at room temperature. After incubation, these complexes were added onto cells with 1.5 ml of fresh medium. After 72 hours incubation, cell pellets were collected for western blot analysis.
Also, cells were transfected for crystal violet assay. For the transfection, 50.000 cells/well for MDA-MB-231 cells and 750.000 cells/well for MCF-7 cells were seeded into 12-well plates. Next day, transfection procedure was performed. First, 1.25 μl of si7-Erbin, si12-Erbin and scr-RNA were diluted in 125 μl of Opti-MEM in different tubes. Then, each diluted scr-RNA was added into 125 μl of Opti-MEM containing 2.5 μl of Lipofectamine RNAiMAX transfection reagent. RNA-transfection reagent complexes in 250 μl of Opti-MEM were incubated for 20 mins at room temperature. After incubation, these complexes were added onto cells with 1 ml of fresh medium. After 72 hours incubation, crystal violet assay was started.
2.2.1.3. SRB Assay
SRB assay were performed with MDA-MB-231 WT& DOXR cells and MCF-7 WT&TAMR in order to find viability of the cells with doxorubicin and tamoxifen treatment. MDA-MB-231 cells were treated with different doses of doxorubicin (0.1 uM, 0.25 uM, 0.5 uM, 0.75 uM, 1 uM and 5 uM) and MCF-7 cells were treated with various doses of tamoxifen (2.5 uM, 5 uM, 7.5 uM, 10 uM, 15 uM and 20 uM). For the SRB assay, 4000 cells/well were seeded into 96-well plates. Next day, doxorubicin and tamoxifen were mixed with growth medium and were added into each well. There were 4 replicas for each treatment. Cells were treated with drugs for 72 hours.
After 3 days, SRB assay was done. First, cells were fixed with TCA solution at +4°C for 1 hour
in dark. After fixation, they were washed with ddH2O five times and SRB solution was added
into each well. SRB solution was incubated for 30 minutes in dark at room temperature. Then, cells were washed with 1% acetic acid five times and waited until drying. Lastly, 150 ul of 10 mM Tris base solution was added into each well and plate was read at 564 nm in a spectrophotometer.
23
2.2.1.4. Crystal Violet Assay
Crystal violet assay was performed with MDA-MB-231 WT& DOXR cells and MCF-7 WT&TAMR. MDA-MB-231 cells were treated with different doses of doxorubicin (0.1 uM, 0.5 uM and 1 uM) and MCF-7 cells were treated with different doses of tamoxifen (5 uM, 7.5 uM and 10 uM). For the crystal violet assay, 50.000 cells/well for MDA-MB-231 cells and 750.000 cells/well for MCF-7 cells were seeded into 12-well plates. Next day, doxorubicin and tamoxifen were mixed with growth medium and were added into each well or first, transfection was examined then, drugs were added in the third day. There were 3 replicas for each treatment. Cells were treated with drugs for 72 hours.
After 3 days, crystal violet assay was started. First, cells were rinsed with PBS and fixed with fixation solution overnight at room temperature. Next day, they were rinsed with PBS again and crystal violet solution was added into each well. Cells were incubated with crystal violet solution for 1 hour at room temperature in dark. After removal of crystal violet solution, cells were washed with tap water and waited until they were dried. Then, photos of the plates were taken. Destaining solution was added to each well to measure the concentration of crystal violet dye. Plates were incubated for 1 hour and plates were read at 595 nm in a spectrophotometer.
The viability of the cells was analyzed with GraphPad Prism program statistically. 2way ANOVA was performed to compare the viability of the cells. Tukey’s and Sidak’s multiple comparison tests were done.
2.2.2. Laboratory Techniques
2.2.2.1. Total Protein Isolation from Cell Pellets
For the protein isolation, cell pellets were collected with ice-cold PBS and centrifuged at +4°C. RIPA buffer (Table 2.2) was added into cell pellets and mixed. The amount of the RIPA buffer (30-100 ul) changed according to the size of the cell pellet. The mixtures were incubated on a shaker at +4°C for 30 minutes. Then, they were centrifuged at 13.000 rpm at +4°C for 30 minutes. After centrifugation, supernatants that contain total proteins were collected and proteins were stored at -80°C for further experiments.
24
2.2.2.2. Protein Quantification with BCA Protein Assay
For Western Blot, the concentration of proteins loading SDS-PAGE should be equal. For this reason, protein quantification was done with Pierce™ BCA Protein Assay Kit. The kit contained 2 mg/ml BSA standard, BCA Reagent A and BCA Reagent B. BSA standard was
diluted with sterile autoclaved ddH2O with 1:20 ratio in order to convert it to working
concentration. First, different amounts of BSA standard (0, 10, 20, 30, 40, 50, 70, 100 ul) were
added into 96 well plate to prepare the standard curve and wells were filled with ddH2O to make
total amount 100 ul for each well. Then, 100 ul of ddH2O and 1 ul of different proteins were
added to other wells. Last, 100 ul of BCA working solution (with 50:1 of reagent A:B ratio) was added into each well and the plate was incubated for 30 minutes at 37°C in dark. Last, the absorbance value of each well was measured at 562 nm in a spectrophotometer. According to absorbance values, a standard curve was plotted, and this was used to find protein concentrations with known absorbance values so that the concentrations of the proteins were calculated.
2.2.2.3. SDS-PAGE
Proteins were mixed with protein loading buffer (Table 2.2) according to calculated protein concentrations and the mixtures were boiled at 95°C for 5 minutes on heater block. SDS-polyacrylamide resolving and stacking gels were prepared. 8% or 10% of resolving gel (Table 2.11) was used for the proteins depending on their molecular weight.
Table 2.11. Constituents of SDS-Polyacrylamide Gel.
Resolving Gel (10 ml) Stacking Gel (5 ml)
Constituent 8% 12 % Constituent 5% ddH20 4.7 ml 4.1 ml ddH20 3.4 ml 30% Acrylamide-bisacrylamide Mix 2.7 ml 3.3 ml 30% Acrylamide-bisacrylamide Mix 850 ul 1M Tris HCl (pH 8.8) 2.5 ml 2.5 ml 1M Tris HCl (pH 6.8) 625 ul 10% SDS 100 ul 100 ul 10% SDS 50 ul 10% APS 100 ul 100 ul 10% APS 50 ul TEMED 8 ul 4 ul TEMED 5 ul
25
SDS-PAGE was run in 1X running buffer (Table 2.2) at 80 V until proteins passed the stacking gel and voltage was increased to 120 V until the loading dye reached at the end of the gel.
2.2.2.4. Western Blot
After the proteins were run in SDS-PAGE, they were transferred to PVDF membrane by using a wet transfer system. First, the membrane was activated with methanol. The materials for the wet transfer (sponge, Wattman paper, membrane) were soaked with transfer buffer (Table 2.2). Proteins were transferred at 250 mA for 2.5 hours. After the transfer, it was checked whether proteins were successfully transferred to the membrane with Ponceau S staining solution (Table 2.2). Afterward, the membrane was incubated in blocking solution on shaker slowly for 1 hour at room temperature. After blocking, the membrane was incubated with primary antibody
solutions containing 3% BSA and primary antibody in TBS-T overnight at +4oC on the shaker
slowly Next day, the membrane was washed three times with TBS-T solution in on shaker fast. After the wash, the membrane was incubated in secondary antibody solution containing 3% milk powder and rabbit or mouse secondary antibody (1:5000 ratio) in TBS-T on shaker slowly for 1 hour at room temperature. After the secondary antibody incubation was finished, the membrane was washed again three times with TBS-T. Finally, the membrane was developed using ECL prime system and, visualization was done in Amersham Imager 600.
Images that demonstrated protein levels were quantified with ImageJ program. Actin protein was confirmed as a housekeeping protein and other proteins were normalized according to the protein level of Actin.
26
CHAPTER 3. RESULTS
3.1. HIGH ERBIN EXPRESSION PREDICTS BETTER SURVIVAL IN TREATED BREAST CANCER PATIENTS
Since the function of Erbin in breast cancer is controversial, the level of the Erbin was investigated in different breast cancer datasets. Kaplan-Meier survival analyses displayed that high level of Erbin expression predicts better overall or relapse free survival in breast cancer patients treated with chemotherapy or targeted therapies while the Erbin level does not change the survival rates of untreated breast cancer patients (Figure 3.1).
G S E 2 5 0 6 6 t r e a t e d p a t ie n t s o f a ll s u b t y p e s T i m e ( y e a r s ) % D is ta n t r e la p s e f r e e s u r v iv a l 0 2 4 6 8 0 5 0 1 0 0 L o w E R B IN H ig h E R B IN p = 0 .0 0 9 8 n = 5 0 7 G S E 2 2 2 2 6 t r e a t e d p a t ie n t s o f a ll s u b t y p e s T i m e ( y e a r s ) % R e la p s e f r e e s u r v iv a l 0 2 4 6 8 0 5 0 1 0 0 L o w E R B IN H ig h E R B IN p = 0 .0 3 7 5 n = 1 2 9 G S E 5 8 6 4 4 t r e a t e d p a t ie n t s o f a ll s u b t y p e s T i m e ( y e a r s ) D is ta n t M e ta s ta s is F r e e S u r v iv a l 0 5 1 0 1 5 0 5 0 1 0 0 L o w E R B IN H ig h E R B IN p = 0 .0 0 2 9 n = 3 1 1 G S E 1 6 4 4 6 C h e m o - t r e a t e d b a s a l p a t i e n t s T i m e ( y e a r s ) % D is ta n t m e ta s ta s is f r e e s u r v iv a l 0 2 4 6 0 5 0 1 0 0 L o w E R B IN H ig h E R B IN p = 0 .0 1 4 5 n = 8 0 G S E 1 6 4 4 6 C h e m o - t r e a t e d b a s a l p a t i e n t s T i m e ( y e a r s ) % O v e r a ll s u r v iv a l 0 2 4 6 0 5 0 1 0 0 L o w E R B IN H ig h E R B IN p = 0 .0 1 4 1 n = 8 0 G S E 7 3 9 0 u n t r e a t e d p a t i e n t s o f a l l s u b t y p e s T im e ( y e a r s ) % D is ta n t m e ta s ta s is f r e e s u r v iv a l 0 5 1 0 1 5 2 0 2 5 0 5 0 1 0 0 L o w E R B IN H ig h E R B IN n .s . n = 1 9 8 G S E 1 1 1 2 1 u n t r e a t e d p a t i e n t s o f a l l s u b t y p e s T i m e ( y e a r s ) P e r c e n t s u r v iv a l 0 5 1 0 1 5 2 0 0 5 0 1 0 0 L o w E R B IN H ig h E R B IN n .s . n = 2 0 0 G S E 2 0 3 4 u n t r e a t e d p a t i e n t s o f a l l s u b t y p e s T i m e ( y e a r s ) % R e la p s e f r e e s u r v iv a l 0 5 1 0 1 5 0 5 0 1 0 0 L o w E R B IN H ig h E R B IN n .s . n = 2 8 6 A. B. C.
27
Figure 3.1. High Erbin expression predicts better survival in breast cancer patients treated with chemotherapy or targeted therapies. (A) Patients having all subtypes of breast cancer were treated
with neoadjuvant taxane and anthracycline chemotherapy, tamoxifen, trastuzumab, or combined therapy. (B) Basal type breast cancer patients were treated with anthracyclines that is epirubicin (C) Breast cancer patients having all subtypes did not receive anthracycline or taxane or targeted therapy. (This analysis was done by Özge Saatçi from Özgür Şahin’s group)
GSE25066, GSE22226 and GSE58644 datasets contain treated breast patients having basal, luminal and HER2 subtype of breast cancer. According to the GSE25066 dataset, 507 breast cancer patients received neoadjuvant chemotherapy with an anthracycline and taxane. ER-positive patients were also treated with endocrine therapy [79, 80]. GSE22226 patients (n=129) were treated with neoadjuvant chemotherapy containing doxorubicin, taxane or trastuzumab [81]. GSE58644 (n=311) patients were also treated with tamoxifen, chemotherapy, trastuzumab, or combined therapy [82]. GSE16446 (n= 80) dataset includes the basal type of breast cancer patients that had anthracycline chemotherapy that is epirubicin. Epirubicin blocks topoisomerase II and intercalates DNA [83, 84]. GSE7390, GSE11121 and GSE2034 datasets contain all subtypes of breast cancer patients and these patients did not treat with chemotherapy or targeted therapy [85-88].
The survival analyses of breast cancer patients based on the expression level of Erbin showed that Erbin can have an important role in breast cancer drug resistance and further investigation is essential.
3.2. PROTEIN LEVEL OF ERBIN IN DRUG SENSITIVE AND RESISTANT BREAST CANCER CELL LINES
After we decided that Erbin could have a role in drug resistance, Erbin levels were examined between different drug resistant and sensitive breast cancer cell lines. Cell lines were obtained from Özgür Şahin’s group. Protein expression of doxorubicin resistant (DoxR) MDA-MB-231, tamoxifen resistant (TamR) MCF-7 and T47D, trastuzumab resistant (TmabR) BT-474 and SKBR-3 cells was investigated by Western Blot analysis. The protein expressions were lower in MDA-MB-231 DoxR and MCF-7 TamR cells apparently compared to the WT cells. In contrast, there was not a significant difference between T47D, BT-474 and SKBR-3 WT & resistant cells. (Figure 3.2). MDA-MB-231 cells are TNBC cells and MCF-7 cells were
28
Luminal A type breast cancer cells [9]. According to Western Blot results, we decided to continue our study with MDA-MB-231 and MCF-7 cells.
Figure 3.2. Western Blot results of different WT and resistant cell lines for Erbin expression.
Protein expression of Erbin was shown in (A) MDA-MB-231 WT & DoxR (B) MCF-7 and T47D WT & TamR (C) BT-474 and SKBR-3 WT & TmabR cells. Western Blot quantifications were normalized based on Actin levels by ImageJ.
3.3. DOSE RESPONSES OF RESISTANT AND WT CELLS AGAINST ANTI-CANCER DRUGS
In order to confirm the resistance of the MDA-MB-231 DoxR and MCF-7 TamR cells, we carried out cell viability assays between WT and resistant cell lines. In addition, drug doses that result in the most different viability between WT and resistant cells were selected to use these doses for further drug treatment experiments. First, SRB assays were performed, and then results were supported with crystal violet assays.
29
3.3.1. Dose Response of MDA-MB-231 WT and DoxR Cells Against Doxorubicin
MDA-MB-231 doxorubicin resistant and sensitive cells were treated with increasing doses of doxorubicin in 3 days. After 3 days, SRB assay was performed. Figure 3.3 shows SRB results of WT and DoxR cells. According to the results, DoxR cells evidently proliferated more than WT cells. The difference of the viability between WT and DoxR cells with all concentrations of doxorubicin was significant (p<0.01). This result demonstrates that MDA-MB-231 DoxR cell line has acquired doxorubicin resistance.
Figure 3.3. Dose response results of doxorubicin resistant MDA-MB-231 cells and its sensitive counterpart. MDA-MB-231 WT and DoxR cells were treated with increasing doses of doxorubicin in
quadruples with 96 well plates. SRB assay was performed after 3 days treatment. (A) Doxorubicin response was shown by the viability graph. IC50 value of MDA-MB-231 WT cells was 0.17 uM, whereas IC50 value of DoxR cells was 0.66 uM. The analysis was done by Sidak's multiple comparisons test (****p<0.0001, **p<0.01) (B) Viability of the cells with different dose treatments was displayed as viability percentage of the cells by the table.
After SRB assay, crystal violet assay was examined to confirm and find out doxorubicin doses that lead to different effect on DoxR and WT cells. For crystal violet assay, 0.1 uM, 0.5 uM and 1 uM of doxorubicin concentrations were selected to enable the difference of viability between wells observable. The images of crystal violet staining displayed that the number of DoxR cells was higher than WT cells with all concentrations of doxorubicin treatment (Figure 3.4A). For 0.1 uM and 0.5 uM doxorubicin, the distinction between DoxR and WT cells was significant (p<0.01) (Figure 3.4B).
![Figure 1.1. Estimated Number of New Cancer Cases and Deaths Worldwide in 2020 (Taken from Ferlay et al., 2020 [5])](https://thumb-eu.123doks.com/thumbv2/9libnet/5760236.116509/16.892.72.834.670.935/figure-estimated-number-cancer-cases-deaths-worldwide-ferlay.webp)
![Figure 1.5. The Role of Erbin in Different Signaling Pathways (Taken from Jang et al., 2020 [57])](https://thumb-eu.123doks.com/thumbv2/9libnet/5760236.116509/25.892.121.776.231.1123/figure-role-erbin-different-signaling-pathways-taken-jang.webp)