Inter- and Intra-Subject Variations in Activity Recognition
Using Inertial Sensors and Magnetometers
Aras Yurtman
Billur Barshan
[email protected]
[email protected]
Department of Electrical and Electronics Engineering, Bilkent University, Ankara, Turkey
Introduction
• human activity recognition through the use of sensor units containing
accelerometers, gyros, and magnetometers • investigate the effect of inter- and
intra-personal differences on classification performance
• the acquired data varies nonlinearly from subject to subject in terms of amplitude & speed
• hard to classify activities of a person using another person’s data
• lower classification performance in subject-based leave-one-out (L1O)
Identifying the “Best” Subjects
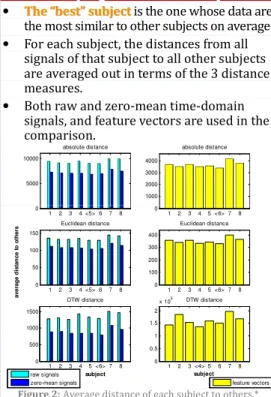
• TThhee““bbeesstt””ssuubbjjeecct is the one whose data are tthe most similar to other subjects on average • For each subject, the distances from all
signals of that subject to all other subjects are averaged out in terms of the 3 distance measures.
• Both raw and zero-mean time-domain signals, and feature vectors are used in the comparison.
Inter-Activity Distances per Subject
Figure 4: Average inter-activity distance per subject.*
5000 10000 absolute distance 1000 2000 3000 4000 absolute distance 1 2 3 4 5 6 7 8 0 1 2x 10 4 absolute distance 1 2 3 4 5 6 7 8 0 200 400 a v e ra g e m e a n & s td . o f in te r-a c ti v it y d is ta n c e s Euclidean distance 1 2 3 4 5 6 7 8 0 5000 10000 subject DTW distance
subject-based leave-one-out (L1O) compared to P-fold cross validation
Dataset
The dataset for activity recognition [1] is used: • 8 subjects performing 19 activities,
5 min each
• 5 sensor units containing uncalibrated tri-axial accelerometers, gyros, and magnetometers (9 axes/unit) sampled at 25 Hz
Segmentation and Feature
Extraction
• Data is segmented into 5-sec segments:
60 segments per activity of a subject • A 1,170-element feature
vector is calculated from each segment
(corresponding to all sensors and units) [1]. • Each signal is made
zero-mean.
• Both raw and zero-mean signals, as well as the feature vectors, are used comparatively.
Figure 2: Average distance of each subject to others.*
Average Intra-Subject Distance
per Activity
• For each activity, the amount of variation in the data with respect to subjects is calculated. • Distances between all distinct subject pairs
are calculated and averaged out.
• The 3 distance measures are applied to both raw and zero-mean time-domain signals.
Figure 4: Average inter-activity distance per subject.*
Inter-Activity Distances per Unit Location
Figure 5: Average inter-activity distance per unit.*
Inter-Activity Distances per Sensor Type
1 2 3 4 <5> 6 7 8 0 1 2 3 4 <5> 6 7 8 0 50 100 150 a v e ra g e d is ta n c e t o o th e rs Euclidean distance 1 2 3 4 5 <6> 7 8 0 500 1000 1500 subject DTW distance raw signals zero-mean signals 1 2 3 4 5 <6> 7 8 0 1 2 3 4 5 <6> 7 8 0 100 200 300 400 Euclidean distance 1 2 3 <4> 5 6 7 8 0 0.5 1 1.5 2 x 10⁵ subject DTW distance feature vectors 1 2 3 4 5 6 7 8 9 10 11 12 13 14 15 16 17 18 19 0 1 2 x 10⁴ absolute distance LA RA RL T LL 0 1 2x 10 4 absolute distance LA RA RL T LL 0 200 400 a v e ra g e m e a n & s td . o f in te r-a c ti v it y d is ta n c e s Euclidean distance LA RA RL T LL 0 5000 units DTW distance
accelerometer sensors gyroscope sensors magnetometer sensors
x y z 0 2 4 x 10⁴ absolutedistance x y z 0 5000 10000 absolute distance x y z 0 1000 2000 absolute distance x y z 0 500 1000 a v e ra g e m e a n & s td . o f in te r -a c ti v it y d is ta n c e s Euclidean distance x y z 0 100 200 Euclidean distance x y z 0 20 40 Euclidean distance x 104 DTW DTW distance DTW distance Figure 1: XBus
Master and its units.
the feature vectors, are used comparatively.
Distance Measures
3 different distance measures are used to
compare the signals and (1 ≤ ≤ ):
• aabbssoolluutteeddiissttaannccee: : abs , = | − | =1 • EEuucclliiddeeaannddiissttaannccee: : Eucl , = − 2 =1 • DDyynnaammiiccTTiimmee--WWaarrppiinngg((DDTTWW))ddiissttaannccee:: DTW ,
Effect of Bias Error
If = + with being the bias error,
if = !"" and # = ". "!
abs , = = !
Eucl , = √ = ". !
DTW , ≤ ≤ !
Figure 3: Average intra-subject distance per activity.*
Average Mean and Std. of
Inter-Activity Distances
• Distances between time-domain signals (ofall the subjects, units, and sensors) belonging to one activity and time-domain signals (of the corresponding subjects, units, and sensors) belonging to another activity are calculated and averaged out for each subject, unit, and sensor separately. • Only zero-mean signals are used.
Figure 6: Average inter-activity distance per sensor.*
Conclusion
• The “best” subject may not always be the one performing activities the best. • Removing mean values highly affects the
results due to bias errors.
• Comparison based on time-domain signals can be misleading in “random” activities.
Acknowledgments
This work is supported by The Scientific and Technological Research Council of Turkey (TÜBİTAK) under grant number EEEAG-109E059 that participates in MOVE (COST Action IC0903) and Erciyes University FBA-11-3579 project..
References
[1] K. Altun, B. Barshan, and O. Tunçel, “Comparative study on classifying human activities with miniature and inertial sensors,” Pattern Recognition, 43(10):3605–3620, Oct. 2010. * Only 5% of the data is used in the DTW case to speed up the
computations. To reduce the data used, all time-domain signals are cropped from the end and only the first 3 feature vectors are used.
1 2 3 4 5 6 7 8 9 10 11 12 13 14 15 16 17 18 19 0 100 200 300 a v e ra g e i n te r-s u b je c t d is ta n c e Euclidean distance 1 2 3 4 5 6 7 8 9 10 11 12 13 14 15 16 17 18 19 0 2000 4000 activity DTW distance raw signals zero-mean signals a v e ra g e m e a n & s td . o f in te r -a c ti v it y d is ta n c e s x y z 0 1 2 x 10 distance x y z 0 500 1000 DTW distance x y z 0 20 40 DTW distance
ACTIVITIES: sitting (A1), standing (A2), lying down on back and on right side (A3 and A4), ascending and descending stairs (A5 and A6), standing in an elevator still (A7) and moving around in an elevator (A8),
walking in a parking lot (A9), walking on a treadmill with a speed of 4 km/hr (in flat and 15º inclined positions) (A10 and A11), running on a treadmill with a speed of 8 km/hr (A12), exercising on a stepper (A13), exercising on a cross trainer (A14), cycling on an exercise bike in horizontal and vertical positions (A15 and A16), rowing (A17), jumping (A18), and playing basketball (A19). POSTER DESIGN BY © ARAS YURTMAN