Journal of Statisticians: Statistics and Actuarial Sciences IDIA 11, 2018, 1, 1-12
Geliş/Received:24.11.2017, Kabul/Accepted: 14.06.2018
www.istatistikciler.org
Araştırma Makalesi / Research Article
An analysis of cause of loss in comprehensive
insurance under competing risks regression model
Murat Kırkağaç
Dumlupınar Univesity, School of Applied Sciences,Department of Insurance and Risk Management, 43000-Kütahya, Turkey. [email protected] 0000-0002-2703-8768
Durdu Karasoy
Hacettepe Univesity, Faculty of Science, Department of Statistics, 06800- Ankara, Turkey. [email protected] 0000-0002-2258-4479 AbstractThe purpose underlying the main aim of the present study is to apply the competing risks of survival analysis upon the comprehensive insurance practices, which -in itself- is a non-life insurance type. To serve for the purpose, a detailed insurance data set comprising seven explanatory variables that encompass 98,667 observations was taken into consideration. This data set stemmed from 2014 and was obtained from a private non-life insurance company. Factors that determine unsuccessfulness were measured by means of competing risk regression model. For each probable cause, estimates of cumulative incidence function were obtained separately. Moreover, by employing competing risks, the comparative effectiveness of causes had been investigated which would result in creating appropriate damages.
Keywords: Survival analysis; Competing risks regression model; Cumulative incidence function; Comprehensive insurance.
Öz
Kasko sigortasında hasar nedenlerinin yarışan riskler regresyon modeli ile analizi Bu çalışmanın altında yatan temel amaç; yaşam çözümlemesinde yarışan riskleri, aslında bir hayat dışı sigorta türü olan kasko sigortasına uygulamaktır. Bu amaca hizmet etmek için, 98.667 tane gözlemi kapsayan yedi tane açıklayıcı değişkeni içeren kapsamlı bir sigorta veri seti göz önünde bulundurulmuştur. Bu veri seti 2014 yılından gelmiş olup, özel bir hayat dışı sigorta şirketinden alınmıştır. Başarısızlığı etkileyen faktörler yarışan riskler regresyon modeli aracılığıyla ölçülmüştür. Birikimli etki fonksiyonunun tahminleri, her olası neden için ayrı ayrı elde edilmiştir. Buna ek olarak, nedenlerin karşılaştırmalı etkinliği uygun hasarların oluşmasıyla sonuçlanacak şekilde,yarışan riskler kullanılarak incelenmiştir.
Anahtar Kelimeler: Yaşam çözümlemesi; Yarışan riskler regresyon modeli; Birikimli etki fonksiyonu; Kasko sigortası.
1. Introduction
Comprehensive insurance is a coverage on your car insurance policy that covers damage from an accident, burning, theft and so on. Comprehensive insurance may help protecting cars against many types of risk. Survival analysis is the analysis in which the time until the event (failure) is of interest [1]. Although in general, a single cause of failure is investigated in survival analysis, failure may occur due to more than one reasons for individuals. These possible reasons are called as competing risks. Competing risks arise when an individual experience more than one cause of failure and cause of failure may affect the other causes [2]. Competing risks have a wide range of fields. So it can be used in insurance and actuary. While competing risks in survival analysis is widely used in life part in actuary and insurance fields, there aren’t so many applications in non-life part. The objective of this study is to apply competing risks on comprehensive insurance which is non-life part of the actuarial studies.
There are a great number of studies about survival analysis. Also, a few studies are found about competing risks used in insurance and actuary.
The paper of Moeschberger and David [3] is one of the earliest studies on competing risks theory. And it is known as a pioneering work on this subject.
Carriere [4] offered notable conclusions in the theory of dependent competing risks that are fundamental in extending multiple decrement theory towards a dependent decrement theory. He also found out that a competing risks model is identifiable only when the class of potential models is greatly restricted.
Macdonald [5] examined complete lifetime approaches adding the Kaplan-Meier and Nelson-Aalen estimates. Regression models specially the Cox model and partial likelihood estimation for lifetime were discussed.
Frees and Valdez [6] introduced actuaries to the concept of copulas clarifying relationships among multivariate outcomes. They reviewed empirical applications of copulas in analysing survival of multiple lives and competing risks.
Keiding et al. [7] specified the possible applications of survival analysis -especially Cox regression models- to non-life insurance, especially occurrence of claims and rating.
Grunkemeier et al. [8] clarified the difference between the actuarial estimates which is the utilization of the Kaplan-Meier method for competing risks events and criticized the use of the cumulative incidence estimates. They also demonstrated why the Kaplan-Meier method is not suitable ordinarily.
Kaishev et al. [9] considered modelling the joint distribution of survival times in a competing risks using copula functions. They also examined how different choices of the copula function affect the resulting joint distribution of survival times and the actuarial functions mostly.
Dignam et al. [10] investigated the use and interpretation of competing risks regression models. They examined simulation studies to show covariate effects. The simulation results showed that depending on the relationship of a covariate to both the failure type of principal interest and the competing failure type, various models may have dramatically different results.
Planchet and Tomas [11] focused on uncertainty issues on disabled lives survival probabilities of Long Term Care insurance policyholders and its results on solvency capital requirement. They investigated the consequences of an error of appreciation on the disabled lives survival probabilities in terms of level of reserves.
Competing risks regression models haven’t been studied enough in actuary, especially in non-life part. Moreover, there is no such an article that studies with comprehensive insurance data. So in this study, we show that competing risks regression models can be used in non-life insurance.
This paper is organized as follows: competing risks and their usage areas in survival analysis are explained in Section 2. The data used in this paper and the application study along with its results are given in Section 3 and concluding remarks are provided in Section 4.
2. Competing Risks
In competing risks problem, the data contain T≥0 failure time and if T is censored unknown J, (J={1,2,...,m}) failure type. Also, x=(x1,...,xp) explanatory variable vector which is used in determining the
causes affecting failure plays a part in the study [1].
In competing risks, it is necessary to focus on cause-specific hazards rather than standard hazards. Using Cox regression model is appropriate for cause-specific hazards [12]. Moreover, it is necessary to focus on the cumulative incidence function (CIF) rather than the survival function in competing risks. Kaplan-Meier curves are not appropriate when competing events are treated as censored [13].
Competing risks regression models allow to analyse different causes at the same time. The main regression models in the presence of competing risks are hazard-based regression model, mixture models, vertical modelling and competing risks regression based on pseudo-observations [14].
Let T denote the random variable for the time to an event, considered as continuous. The overall hazard rate is defined as usual:
λ (1)
A cause-specific hazard rate will also be defined, representing the instantaneous risk of dying of cause j:
(2)
The overall hazard rate can be obtained as follows:
(3)
The overall survival function can be written as:
(4)
where is the cumulative risk obtained by integrating the overall hazard:
= (5)
Also, it is possible to define cause-specific survival function as:
exp{- (6)
= (7) According to Cox regression model with x=(x1,...,xp) explanatory variable vector, hazard function for one
unit is as follows:
(8)
If J is determined as the cause of death, hazard function gives cause-specific hazard function of m possible causes:
(9)
Therefore, cause-specific hazard function can be defined as:
(10) CIF, or probability of failure from the event of interest j before time t in the presence of all other possible causes, is a function of the cause-specific hazards for all causes of failure [1]:
(11)
3. Application 3.1. The Data
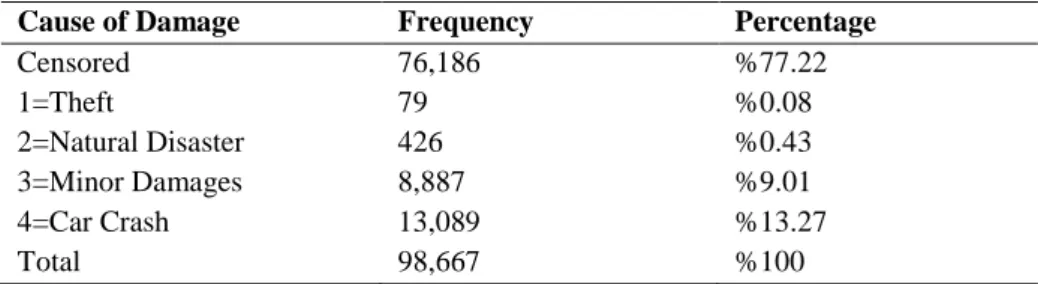
A comprehensible number of data from 98,667 observations are used in this study. They are comprehensive insurance data belonging to a private non-life insurance company operating in Turkey from the year 2014 on. The observation period for this data is between 01.01.2014 and 31.12.2015. Damage causes a total number of 26 are grouped under four main reasons. These four reasons are taken as competing risks. In Table 1, the frequencies of damage causes are demonstrated. If the damage has not occurred, the observations are taken as censored data.
Table 1. Frequencies of Causes
Cause of Damage Frequency Percentage
Censored 76,186 %77.22 1=Theft 79 %0.08 2=Natural Disaster 426 %0.43 3=Minor Damages 8,887 %9.01 4=Car Crash 13,089 %13.27 Total 98,667 %100
As it can be seen from Table 1, while the cause about car crash has the highest frequency among all causes, which is about %13, the cause about theft has the lowest frequency among all causes, which is about %0.08.
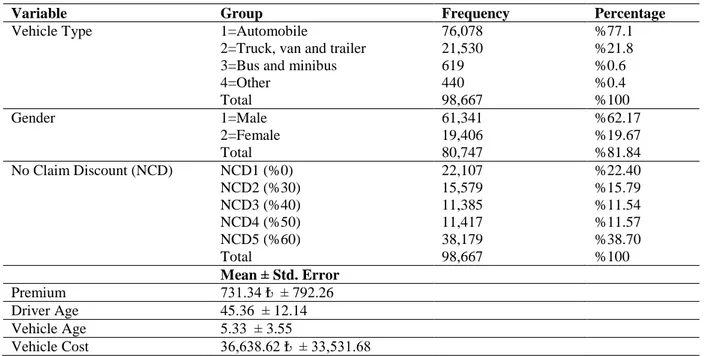
The data consist of seven explanatory variables from 98,667 observations. The explanatory variables are listed in Table 2.
Table 2. Explanatory Variables of Data
Variable Group Frequency Percentage
Vehicle Type 1=Automobile 76,078 %77.1
2=Truck, van and trailer 21,530 %21.8
3=Bus and minibus 619 %0.6
4=Other 440 %0.4 Total 98,667 %100 Gender 1=Male 61,341 %62.17 2=Female 19,406 %19.67 Total 80,747 %81.84 No Claim Discount (NCD) NCD1 (%0) 22,107 %22.40 NCD2 (%30) 15,579 %15.79 NCD3 (%40) 11,385 %11.54 NCD4 (%50) 11,417 %11.57 NCD5 (%60) 38,179 %38.70 Total 98,667 %100 Mean ± Std. Error Premium 731.34 ₺ ± 792.26 Driver Age 45.36 ± 12.14 Vehicle Age 5.33 ± 3.55 Vehicle Cost 36,638.62 ₺ ± 33,531.68
Vehicle types are categorized into four main groups. As it can be seen from Table 2, while the automobile has the highest frequency which is about %77, other cars group has the lowest frequency which is about %0.4 among all.
Beside males and females, there is 17,920 (%18.16) corporate entity in the 98,667 observations.
There are five steps for the discount. No-claim-discount 1, holding the lowest discount which is equal to %0, is the riskiest. NCD2, NCD3 and NCD4 follow NCD1 about riskiness respectively. In addition, NCD5, holding the highest discount which is equal to %60, is the least risky for the cause of minor damages.
The average values and standard errors for premium, driver age, vehicle age and vehicle cost are also listed in Table 2.
3.2. Results
Table 3. Cox Regression Model for All Causes
Coefficient Std. Er. Sig. HR 95% CI for
HR(lower) 95% CI for HR(higher) Premium 0.0003 0.0001 0.000* 1.0003 1.0002 1.0004 Driver Age -0.0014 0.0007 0.035* 0.9986 0.9973 0.9999 Vehicle Age -0.0197 0.0299 0.000* 0.9805 0.97478 0.9863 Vehicle Cost -0.0000 0.0000 0.000* 0.9999 0.9999 0.9999 Vehicle Type-2 -0.0028 0.0206 0.928 0.9981 0.9585 1.0393 Vehicle Type-3 -0.1632 0.1512 0.281 0.8495 0.6316 1.1425 Vehicle Type-4 -0.6186 0.2891 0.032* 0.5388 0.3057 0.9493 Gender -0.0121 0.0180 0.502 0.9880 0.9537 1.0235 NCD-2 -0.0883 0.0251 0.000* 0.9155 0.8716 0.9617 NCD-3 -0.0986 0.0280 0.000* 0.9061 0.8577 0.9572 NCD-4 -0.1240 0.0291 0.000* 0.8835 0.8345 0.9352 NCD-5 -0.2166 0.0246 0.000* 0.8053 0.7673 0.8451 *p<0.05
Primarily, Cox regression model is obtained when all damage causes are considered. In Table 3, factors affecting failure for all causes are presented.
In Table 3, HR demonstrates the hazard ratio, and CI stands for its confidence interval. As it can be seen, premium, driver age, vehicle age, vehicle cost, vehicle type-4 and NCD variables are significant factors affecting failure for all causes.
While the positive values of coefficients indicate that the risk of failure increases, the negative values of coefficients indicate that the risk of failure decreases. According to this information, as premium increases, the risk of failure for all causes increases, as well. On the other hand, as driver age, vehicle age and vehicle cost increase, the risk of failure for all causes decreases.
Vehicle type-4 is less risky at the rate of 0.5388 than vehicle type-1 for all causes. In other words, failure risk for all causes of vehicle type-1 is 1,8559 (=1/0.5388) times greater than vehicle type-4.
Moreover, in Table 3, it is concluded that 1 is the riskiest. 2, 3 and 4 follow NCD-1 about riskiness respectively. Also, NCD-5 is the least risky for all causes. That is a rational result because of the fact that while the driver has very few or no accidents in the past in NCD-1 step, the driver has great numbers of accidents in the past in NCD-5.
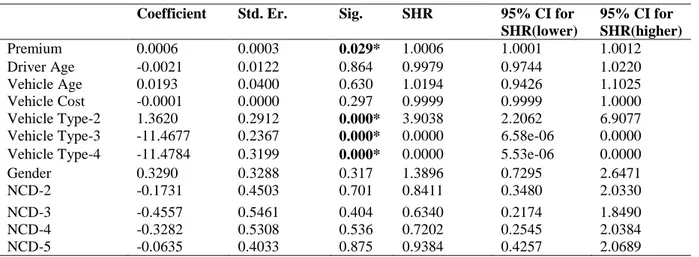
Hereby it is aimed to determine factors affecting failure for all four causes separately. For this purpose, competing risks regression models are utilized. In Table 4, it could be seen that competing risks regression model for theft is the first cause when the other causes are considered as competing risks.
Table 4. Competing Risks Regression Model for Cause 1
Coefficient Std. Er. Sig. SHR 95% CI for
SHR(lower) 95% CI for SHR(higher) Premium 0.0006 0.0003 0.029* 1.0006 1.0001 1.0012 Driver Age -0.0021 0.0122 0.864 0.9979 0.9744 1.0220 Vehicle Age 0.0193 0.0400 0.630 1.0194 0.9426 1.1025 Vehicle Cost -0.0001 0.0000 0.297 0.9999 0.9999 1.0000 Vehicle Type-2 1.3620 0.2912 0.000* 3.9038 2.2062 6.9077
Vehicle Type-3 -11.4677 0.2367 0.000* 0.0000 6.58e-06 0.0000 Vehicle Type-4 -11.4784 0.3199 0.000* 0.0000 5.53e-06 0.0000
Gender 0.3290 0.3288 0.317 1.3896 0.7295 2.6471 NCD-2 -0.1731 0.4503 0.701 0.8411 0.3480 2.0330 NCD-3 -0.4557 0.5461 0.404 0.6340 0.2174 1.8490 NCD-4 -0.3282 0.5308 0.536 0.7202 0.2545 2.0384 NCD-5 -0.0635 0.4033 0.875 0.9384 0.4257 2.0689 *p<0.05
In Table 4; SHR demonstrates the cause-specific hazard ratio. When the other causes are considered as competing risks, the factors affecting failure as a result of theft which is the first cause are premium and vehicle type variables.
As premium increases, the risk of failure due to theft increases, as well.
Failure risk due to theft of truck, van and trailer which is vehicle type-2 is 3.9 times greater than the automobile which is vehicle type-1. When comparing the automobile to group of the bus and minibus and another group which are vehicle type-3 and 4, failure risk due to theft of the automobile is greater than the group of bus and minibus and another group.
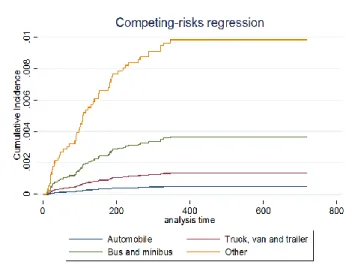
These results can also be seen in Figure 1.
Figure 1. CIF Values For Vehicle Type (Cause 1)
As is seen from Figure 1 while automobile has the smallest CIF values, other cars group has the biggest CIF values for the cause of theft. It means that automobile is the least risky group. Truck, van and trailer group follows the automobile. Bus and minibus group follows truck, van and trailer. Other cars group is the riskiest group for the cause of theft.
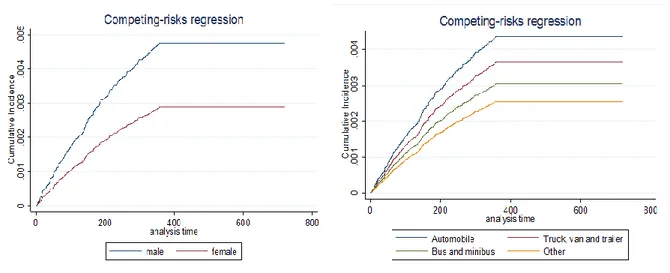
In Table 5, when the other causes are considered as competing risks, the factors affecting failure as a result of a natural disaster which is the second cause are premium, vehicle type and gender variables. Table 5. Competing Risks Regression Model for Cause 2
Coefficient Std. Er. Sig. SHR 95% CI for SHR (lower) 95% CI for SHR (upper) Premium 0.0005 0.0001696 0.003* 1.0005 1.0002 1.0008 Driver Age 0.0057 0.0042624 0.184 1.0057 0.9973 1.0141 Vehicle Age -0.0185 0.0208324 0.376 0.9817 0.9424 1.0226 Vehicle Cost -0.0000 0.0000 0.054 1 1 1 Vehicle Type-2 -0.1696 0.1500505 0.258 0.8440 0.6290 1.1326 Vehicle Type-3 -0.1139 1.008823 0.910 0.8924 0.1235 6.4455 Vehicle Type-4 -11.9375 .1747678 0.000* 0.0000 0.0000 0.0000 Gender -0.5022 0.1455009 0.001* 0.6052 0.4551 0.8049 NCD-2 -0.1355 0.1882062 0.472 0.8733 0.6039 1.2629 NCD-3 0.0604 0.1904791 0.751 1.0622 0.7313 1.5429 NCD-4 0.0531 0.2010903 0.792 1.0546 0.7111 1.5640 NCD-5 -0.0658 0.1761772 0.709 0.9363 0.6629 1.3224 *p<0.05
According to Table 5, as the premium increases, the risk of failure due to the natural disaster increases too, as in the first cause. Failure risk due to the natural disaster of the automobile is greater than another group. When the gender variable is investigated. it is precipitated that failure risk of males is 1.65 times greater than failure risk of females for the causes related the natural disaster.
These results can also be seen in Figure 2 and Figure 3.
Figure 2 CIF Values For Gender (Cause 2) Figure 3 CIF Values For Vehicle Type (Cause 2) As it is seen from Figure 2, males have bigger CIF values than females. Therefore, it is concluded that failure risk of males is greater than failure risk of females for the cause of the natural disaster. Besides, according to Figure 3, it can be inferred that while the automobile is the riskiest group. other cars group is the least risky for the cause of natural disaster, which is the inverse of the first cause.
In Table 6, when the other causes are considered as competing risks, it could be seen that all variables are significant for the cause 3 which is minor damages.
Table 6. Competing Risks Regression Model for Cause 3
Coefficient Std. Er. Sig. SHR 95% CI for
SHR (lower) 95% CI for SHR (upper) Premium 0.0003 0.0000 0.000* 1.0003 1.0002 1.0004 Driver Age -0.0040 0.0010 0.000* 0.9960 0.9939 0.9980 Vehicle Age -0.0143 0.0045 0.002* 0.9858 0.9771 0.9946 Vehicle Cost -0.0000 0.0000 0.000* 0.9999 0.9999 0.9999 Vehicle Type-2 0.3615 0.0291 0.000* 1.4355 1.3559 1.5198 Vehicle Type-3 0.4628 0.1782 0.009* 1.5885 1.1201 2.2526 Vehicle Type-4 -1.4301 0.7130 0.045* 0.2393 0.0592 0.9679 Gender -0.1216 0.0297 0.000* 0.8855 0.8354 0.9385 NCD-2 -0.1494 0.0396 0.000* 0.8613 0.7969 0.9308 NCD-3 -0.1904 0.0454 0.000* 0.8266 0.7562 0.9036 NCD-4 -0.1707 0.0466 0.000* 0.8430 0.7695 0.9236 NCD-5 -0.2501 0.0400 0.000* 0.7787 0.7180 0.8423 *p<0.05
According to Table 6, as premium increases, the risk of failure due to a natural disaster increases as well (as in the second cause). On the contrary, as driver age, vehicle age and vehicle cost increase, the risk of failure due to a natural disaster decreases.
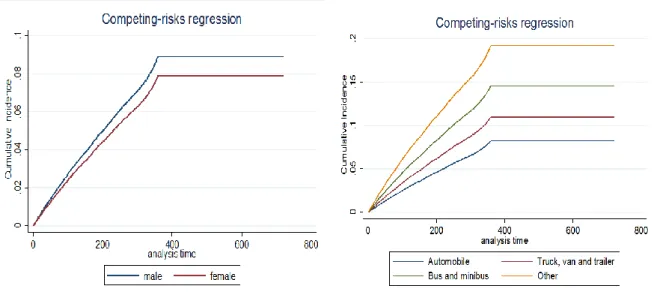
The results for categorical variable can also be seen in Figure 4,5 and 6. According to Figure 4, as in the second cause, failure risk of males is greater than failure risk of females for the cause of minor damages. When Figure 5 is analysed, it can be observed that while other cars group is the riskiest group, the automobile is the least risky for the cause of minor damages, which is the inverse of the second cause. Moreover, in Figure 6, it is concluded that while NCD1 is the riskiest group, NCD5 is least risky for the cause of minor damages.
Figure 4 CIF Values For Gender (Cause 3) Figure 5 CIF Values For Vehicle Type (Cause 3)
Figure 6 CIF Values For NCD (Cause 3)
In Table 7, the factors affecting failure as a result of the car crash which is the fourth cause are premium, vehicle age, vehicle cost, vehicle type, gender and no claim discount-5 variables.
Table 7. Competing Risks Regression Model for Cause 4
Coefficient Std. Er. Sig. SHR %95 CI for SHR (lower) %95 CI for SHR (upper) Premium 0.0003 0.0000 0.000* 1.0003 1.0003 1.0004 Driver Age 0.0005 0.0009 0.579 1.0005 0.9988 1.0021 Vehicle Age -0.0235 0.0039 0.000* 0.9767 0.9693 0.9843 Vehicle Cost -0.0000 0.0000 0.000* 0.9999 0.9999 0.9999 Vehicle-Type-2 -0.3277 0.0303 0.000* 0.7206 0.6792 0.7646 Vehicle Type-3 -0.9114 0.2891 0.002* 0.4020 0.2281 0.7083 Vehicle Type-4 -0.2627 0.3181 0.409 0.7690 0.4123 1.4344 Gender 0.0728 0.0231 0.002* 1.0755 1.0278 1.1254 NCD-2 -0.0178 0.0337 0.597 0.9823 0.9195 1.0494 NCD-3 -0.0077 0.0378 0.839 0.9923 0.9214 1.0687 NCD-4 -0.0635 0.0394 0.107 0.9385 0.8688 1.0138 NCD-5 -0.1506 0.0342 0.000* 0.8602 0.8044 0.9198 *p<0.05
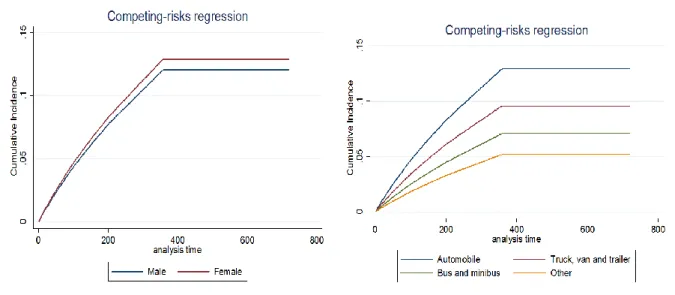
According to Table 7, as premium increases, the risk of failure due to car crash increases, as well. Also as vehicle age and vehicle cost increase, the risk of failure due to car crash decreases as in the third cause. As it can be seen from Figure 7, the failure risk of females is greater than that of males for the causes related to the car crash which is the inverse of the third cause. In Figure 8, it can be said that while the automobile is the riskiest group, other cars group is the least risky for the cause of the natural disaster, which is the inverse of the third cause. Moreover, the same results are obtained from Figure 9 with the third cause.
Figure 7 CIF Values For Gender (Cause 4) Figure 8 CIF Values For Vehicle Type (Cause 4)
Figure 9 CIF Values For NCD (Cause 4)
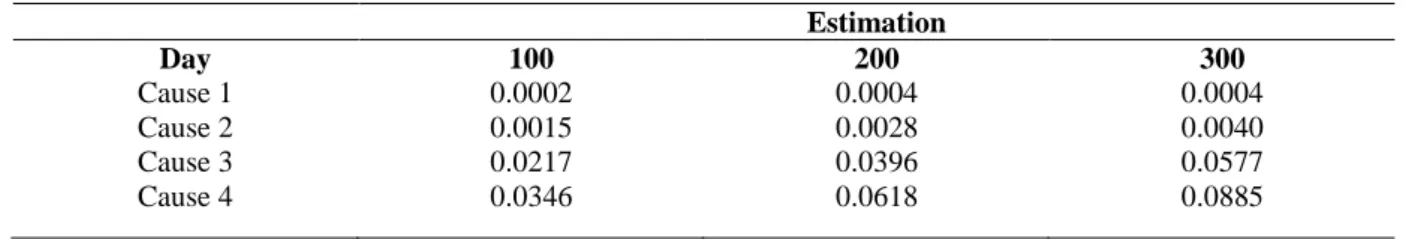
In this study, which reason is more effective in terms of damage by using competing risks is also analysed. As the probability of damage estimation increases, the effectiveness of the cause increases. Depending on this information, as seen from Table 8, the cause which has the highest probability values, in other words, the most efficient cause is the car crash which is the fourth cause. The cause which has the lowest probability value, in other words the least efficient cause is theft which is the first cause.
Table 8. Probabilities of damage estimation for all causes Estimation Day Cause 1 Cause 2 Cause 3 Cause 4 100 0.0002 0.0015 0.0217 0.0346 200 0.0004 0.0028 0.0396 0.0618 300 0.0004 0.0040 0.0577 0.0885 4. Conclusion
In this study, motor own damage insurance data with 7 explanatory variables and 98.667 observations belonging to a private non-life insurance company operating in Turkey from the year 2014 on are used. According to the Cox regression model for all causes, premium, driver age, vehicle age, vehicle cost, vehicle type-4 and no claim discount variables are significant. As premium increases, the risk of damage increases; besides, as driver age, vehicle age and vehicle cost increase, the risk of damages decreases. In this study, factors affecting failure for all four causes are separately identified. For this purpose, competing risks regression models are utilized instead of the Cox regression model.
According to competing risks analysis, the premium is a significant variable for all causes. Also as premium increases, the risk of failure increases as well for all causes.
Driver age is a significant variable only for the cause of minor damages. For the cause of minor damages, as driver age increases, the risk of failure decreases.
Vehicle age and vehicle cost are significant variables for the cause of minor damages and car crash. For these causes, as vehicle age increase, the risk of failure decreases.
Gender is a significant variable for the cause of the natural disasters, minor damages and car crash. While failure risk of males is greater than failure risk of females for the cause of the natural disaster and minor damages, the failure risk of females is greater than failure risk of males for the causes related car crash. Vehicle type and no claim discount variables are also analysed in detail. It is concluded that vehicle type is a significant variable for all causes, no claim discount is also a significant variable for cause three and four.
Competing risks regression analysis is also applied to determine which reason is more effective in terms of damage. According to the probabilities of damage estimations, causes related to car crash are the most efficient cause. Minor damages and causes-related the natural disaster are the following causes, and the least efficient cause is theft.
References
[1] D. Karasoy, N. A. Tutkun, 2016, Yaşam Çzöümlemesi, Ankara: Nobel Press.
[2] M. Pintilie, 2006, Competing risks: a practical perspective (Vol. 58), John Wiley & Sons.
[3] M. L. Moeschberger, H. A. David, 1971, Life tests under competing causes of failure and the theory of competing risks, Biometrics 4, 909-933.
[4] J. F. Carriere, 1994, Dependent decrement theory, Transactions of the Society of Actuaries, 46, 45-74. [5] A.S. MacDonald, 1997, An Actuarial Survey of Statistical Models for Decrement and Transition Data II:
Competing Risks, Non-Parametric and Regression Models. Insurance Mathematics and Economics, 2(20), 142.
[6] E.W. Frees, E. A. Valdez, 1998, Understanding relationships using copulas, North American Actuarial Journal 2, 1-25.
[7] N. Keiding, C. Andersen, P. Fledelius, 1998, The Cox Regression Model for Claims Data m Non-Life Insurance. Astin Bulletin 28, 95-118.
[8] G. L. Grunkemeier, R. Jin, M. J. Eijkemans, J. J. Takkenberg, 2007, Actual and actuarial probabilities of competing risks: apples and lemons, The Annals of Thoracic Surgery, 83, 1586-1592.
[9] V. K. Kaishev, D. S. Dimitrova, S. Haberman, 2007, Modelling the joint distribution of competing risks survival times using copula functions, Insurance: Mathematics and Economics, 41, 339-361.
[10] J. J. Dignam, Q. Zhang, M.N. Kocherginsky, 2012, The use and interpretation of competing risks regression models. Clinical Cancer Research, clincanres-2097.
[11] F. Planchet, J. Tomas, 2016, Uncertainty on survival probabilities and solvency capital requirement: application to long-term care insurance. Scandinavian Actuarial Journal, 2016, 279-292.
[12] M. Pintilie, 2011, An introduction to competing risks analysis, Revista Española de Cardiología (English Edition), 64, 599-605.
[13] R.G. Gutierrez, 2010, Competing-risks regression, Stata Conference, Boston.
[14] B. Haller, G. Schmidt, K. Ulm, 2013, Applying competing risks regression models: an overview. Lifetime data analysis, 19(1), 33-58.