Contents lists available atScienceDirect
Results in Physics
journal homepage:www.elsevier.com/locate/rinp
Simulation of shielding parameters for TeO
2
-WO
3
-GeO
2
glasses using FLUKA
code
Amandeep Sharma
a,⁎, M.I. Sayyed
b, O. Agar
c, H.O. Tekin
d,e aDepartment of Physics, Akal University Talwandi Sabo, Bathinda 151302, IndiabDepartment of Physics, Faculty of Science, University of Tabuk, Tabuk, Saudi Arabia cKaramanoğlu Mehmetbey University, Department of Physics, 70100 Karaman, Turkey
dUskudar University, Vocational School of Health Services, Radiotherapy Department, Istanbul 34672, Turkey
eUskudar University, Vocational School of Health Services, Department of Nuclear Technology and Radiation Protection, Istanbul, Turkey
A R T I C L E I N F O Keywords: Gamma photons Attenuation FLUKA simulations Radiation shielding A B S T R A C T
This paper aimed to report the results on the investigation of photon attenuation parameters for TeO2-WO3-GeO2
glasses using FLUKA Monte Carlo code. In order to test the validity of the present code, the computational values of mass attenuation coefficients have been in confirmation with those of both previously published experimental data (MoO3-B2O3-Bi2O3) and XCOM database at various energies between 356 and 1330 keV. The relative
de-viation between FLUKA and experimental data is below 5.19% while the difference between the present code and XCOM database is found to be almost 2%. Therefore, the estimated results are in good agreement to each other and exhibited that FLUKA simulation is an alternative technique in determining the shielding performance of the present glass system. Additionally, mean free path and half-value layer results were calculated and it was concluded that among the selected glasses, TeWGe5 sample has superior shielding effectiveness.
Introduction
High energetic gamma ray photons from any radioisotopes have been commonly used in various purposes namely irradiation responses of some capacitors[1,2], multi elemental analysis[3,4], food irradia-tion[5,6], scientific researches and so on. Due to their high penetrating power, these kinds of radiations have huge threat for human and en-vironmental health as well as electronic laboratory equipments[7]. As well-known, the design of any radiation shielding material is one of the most effective techniques to protect against their dangerous effects of neutral radiation. Thereby, determination of various quantities con-cerned on the passage of high energetic photons through any shielding absorber is of urgent interest.
Since the addition of lead (Pb) to any materials makes it toxic in nature[8], the use of Pb is increasingly restricted. On the other hand, various concrete materials, which are cheaper and available widely, have been utilized extensively for gamma ray shielding materials[9]. However, these traditional materials have two main drawbacks: (i) the opaque nature of concrete to visible light, (ii) difficulty of transporta-tion from one place to another[10]. Glass matrices have an increasing attention as innovative and alternative shielding materials. In recent years, there are numerous works on the investigations of both radiation
shielding performances as well as mechanical, structural and physical features of different glass systems[11–17].
Although experimental studies are the final decision-making stage for scientific research, yet the frequency of applications of helpful nu-merical methods capable of solving the different physical problems is increasing day-by-day. The term of Monte Carlo simulation exemplarily simulates the experimental environment considering the physical and geometrical features of the used equipment, radiation source with certain type and energy, cross-section values as well as different data-bases that are taken from experimental studies. Further, Monte Carlo simulations can provide significant contributions during the investiga-tion of best radiainvestiga-tion protecinvestiga-tion properties among the studied chemical combinations by minimizing the amount of time, cost and radiation exposure. Therefore, one of the well-known Monte Carlo codes in the literature namely FLUKA has been employed here for the investigation of various shielding parameters of different materials[18,19].
FLUKA (FLUktuirende KAskade) refers to a general purpose Monte Carlo code that records the simulation of the transportation of about sixty particles/rays, such as, electrons, neutrino, neutrons, photons, heavy-ions, and muons[20–23], in matter that is developed with col-laboration between INFN (Istituto Nazionale di Fisica Nucleare) and CERN (European Council for Nuclear Research). It has dual capability: it
https://doi.org/10.1016/j.rinp.2019.102199
Received 18 February 2019; Received in revised form 11 March 2019; Accepted 12 March 2019
⁎Corresponding author.
E-mail address:[email protected](A. Sharma).
Available online 15 March 2019
2211-3797/ © 2019 The Authors. Published by Elsevier B.V. This is an open access article under the CC BY-NC-ND license (http://creativecommons.org/licenses/BY-NC-ND/4.0/).
can be used in a biased mode as well as a fully analogue mode. This feature is not available in any other Monte Carlo codes.
Some authors[24,25] have reported the mass attenuation coeffi-cients of soil samples and concretes using FLUKA Monte Carlo code, but to best of our knowledge, none have extended the use of FLUKA to investigate various shielding parameters of composite glasses. Bazo et al.[26]have recently reported the results of the testing of FLUKA on neutron activation of the elements Si and Ge with the help of gamma spectroscopy. The main advantage of simulation approach is to create theoretical data for flexible geometry of the experiment and for a number of primary radiations to check the feasibility of specific perimental measurements. The main aim of the present work is to ex-amine the validity of FLUKA code to estimate the shielding parameters for TeO2-WO3-GeO2glass system.
Materials& methods
Theoretical basis
In this work, various shielding parameters such as mass attenuation coefficient, mean free path (MFP), half-value layer (HVL) of TeO2-WO3
-GeO2glass systems have been determined. The investigations have been
reported for the commonly used gamma sources with energies 356 (133Ba), 662 (137Cs), 1173 (60Co) and 1330 (60Co) keV using the FLUKA
(version FLUKA2011.2c.5) Monte Carlo simulation program. To in-vestigate the effect of TeO2on the radiation shielding features of TeO2
-WO3-GeO2 glass system, the compositions namely 75TeO2-5WO3
-20GeO2, 85TeO2-5WO3-10GeO2, 90TeO2-5WO3-5.0GeO2, 94TeO2
-5WO3-1.0GeO2 and 95TeO2-5WO3 have been considered for the
in-vestigations.
The intensity of the incident radiation degrades when a parallel beam of gamma-ray traverses through a material. This is due to various interaction processes like photoelectric absorption, Compton scattering and pair production in the intermediate energy range. This decrease in intensity is given by Lambert-Beer's law as follows[27,28]:
=
I I exp( µx)o (1)
where ‘μ’ is called the linear attenuation coefficient of the absorber material. Ioand I are incident and transmitted intensities respectively
and ‘x’ is thickness (cm) of the sample. The parameter ‘mass attenuation coefficient’ is of more fundamental importance rather than ‘linear at-tenuation coefficient’ because all mass atat-tenuation coefficients are in-dependent of the physical state (gas, liquid or solid) and the density of the absorber material. Thus, the mass attenuation coefficient (μm) is
obtained from the Eq.(1)as[29]:
= µ 1 xln I Io m (2)
where ρ is the density (g/cm3) of material. By plotting ln(I
o/I) versus
sample thickness, the slope is determined to obtain µm.
Another shielding related parameter, mean free path (MFP) is de-fined as the average distance between the two successive interactions of photons in which the intensity of incident photon beam is attenuated by the factor of 1/e. The mean free path (cm) can be calculated from the value of linear attenuation coefficient (μ) as[30]:
= xexp ( µx)dx = exp( µx)dx 1 µ 0 o (3)
In addition, Half-value layer (HVL), which is defined as the at-tenuating sample thickness required in reducing the intensity by 1/2 of original intensity respectively, is expressed as[31]:
=
HVL ln 2
µ (4)
The values of MFP and HVL are very useful in estimating rapid and approximate shielding calculations.
FLUKA simulation code
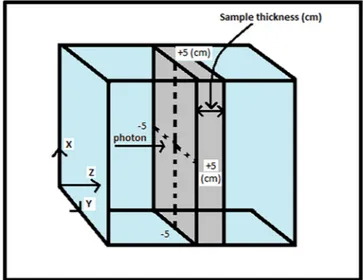
FLUKA Monte Carlo code provides a BEAM input file by which it is possible to choose the particle kind, its energy, its direction and starting position. For more complex situations, generally a devoted ‘user rou-tine’ is preferred. FLUKA input files consist of a number of data com-mands, each consisting of one or more lines in the file[32,33]. Input data for FLUKA were arranged in a particular sequential order as per code specifications. A simple rectangular geometry with the axis along the z-direction was described in the input file. A beam of 1x10⁵gamma
photons was directed towards the samples under investigation in z-di-rection and attenuated in rectangular parallelepiped (RPP) glass sam-ples. An RPP has its edges parallel to the coordinate axes and is defined by six numbers (minimum and maximum coordinates which bound the parallelepiped) in the following order: Xmin, Xmax, Ymin, Ymax, Zmin, Zmax. In the present simulation geometry, Xmin (Ymin) and Xmax (Ymax) were selected as −5 cm and +5 cm respectively as sketched in Fig. 1. This results in 10 cm length and breadth of the target material with different thicknesses defined by Zmin and Zmax. A glass material has been defined by a MATERIAL card plus as many COMPOUND cards as required to describe glass composition. The MATERIAL card used to define a compound composition carries the compound name, density and material number (if input is explicitly number based) etc. The transmission values have been obtained using USRBDX score card, after the code run for 5 cycles, with different sample thicknesses. USRBDX is the command used to define a detector for the boundary-crossing es-timator. It calculates fluence, mono or bidirectional, differential in energy and angle on any boundary between two selected regions[32]. The uncertainty in transmission data values for all the computations was less than 1%. Photon transmission results of simulations have been taken from output files using Flair which is, FLUKA Advanced Interface, a data analysis interface compatible with FLUKA[34].
Results and discussion
Validation
Since no previous studies used the FLUKA code to investigate the mass attenuation coefficient (µm) of a glassy material, it is important to
simulate the µmfor a certain glass system measured previously in the
laboratory and then to calculate the µmfor this glass system using the
FLUKA code, at the same energies, to validate the FLUKA input file. For this purpose, we selected MoO3-B2O3-Bi2O3glass system[15]for which
the authors measured the µmvalues at four energies and calculated the
µm for this system theoretically using XCOM program. We used the
simulated target geometry sketched inFig. 1(along with Flair screen-shot inFig. 2) and evaluated the µmfor MoO3-B2O3-Bi2O3glasses at the
same energies and enlisted the simulated values in Table 1(a) and plotted the results in Fig. 3. Moreover, the percentage difference be-tween the FLUKA and experimental values were calculated according to the next relation[35]:
= ×
Percentage difference µ µ
µ 100
m,FLUKA m,Exp
m,Exp (5)
The results obtained from the above relation are summarized in Table 1(b). The data presented inTable 1(a)–(b) andFig. 3shows that the simulated µm values by FLUKA code are very close with those
measured in the lab. Moreover, the percentage difference between the two methods is in the range of 0–3.6% (for MoBiB1), 0.17–3.91% (for MoBiB2), 0.17–5.19% (MoBiB3) and 0.18–4.1% (for MoBiB4) respec-tively. This small percentage difference for all the samples and the
selected energy range implies that the values of µmcan be predicted for
the MoO3-B2O3-Bi2O3 glasses as well as for the other glass systems
utilizing the FLUKA simulated geometry.
For the 20MoO3-30Bi2O3-50B2O3glass sample, we plotted the
si-mulated (FLUKA) and measured (Expt.) results of µm and used the
correlation theory for confirmation of the linearity of the FLUKA and experimental results (Fig. 4). The coefficient of correlation (r = 0.9999) demonstrates that the linear regression represents a good adjustment for the data obtained through FLUKA simulations.
Attenuation properties of TeO2-WO3-GeO2glass system
The second part in this work is to use the FLUKA code in calculating the µmvalues for TeO2-WO3-GeO2system and to investigate the effect
of TeO2on the radiation shielding features of this glass system. The
composition of the glass system, density and weight fraction of each Fig. 2. Screenshot of Flair interface for top view of target geometry.
Table 1
Comparison of mass attenuation coefficients (cm2/g) of the MoO
3-B2O3-Bi2O3glass system obtained using FLUKA simulation, experimental and XCOM results.
(a)
Glass Sample 356 keV 662 keV 1173 keV 1330 keV
FLUKA Expt. XCOM FLUKA Expt. XCOM FLUKA Expt. XCOM FLUKA Expt. XCOM
MoBiB1 0.2213 0.2136 0.2221 0.0977 0.0977 0.0984 0.0603 0.0594 0.0604 0.0553 0.0549 0.0556
MoBiB2 0.2287 0.2201 0.2297 0.0992 0.0986 0.0998 0.0604 0.0603 0.0606 0.0555 0.0554 0.0557
MoBiB3 0.2350 0.2234 0.2360 0.1005 0.0996 0.1010 0.0604 0.0605 0.0608 0.0556 0.0555 0.0558
MoBiB4 0.2397 0.2302 0.2414 0.1015 0.1011 0.1021 0.0605 0.0610 0.0610 0.0555 0.0556 0.0559
(b)
Glass Sample Percentage difference between FLUKA and Experimental results
356 keV 662 keV 1173 keV 1330 keV
MoBiB1 3.60 0 1.52 0.73
MoBiB2 3.91 0.61 0.17 0.18
MoBiB3 5.19 0.90 0.17 0.18
Fig. 3. The mass attenuation coefficients results (cm2/g) of the MoO
3-B2O3-Bi2O3glass system obtained using FLUKA simulation, experimental and XCOM data.
0.08 0.12 0.16 0.20 0.08 0.12 0.16 0.20 & r = 0.9999y = 1.05x - 0.003 Best-fit straight line having equation Data points 20MoO3- 30Bi2O3- 50B2O3 FLUKA = Expe rimental
Experimental mass attenuation coefficient (cm2/gm)
1.330 MeV 1.132 MeV 0.662 MeV 0.356 MeV FLUKA ma ss a ttenua tion c oe ffi ci en t (c m 2/g m )
Fig. 4. Comparison between the mass attenuation coefficients for 20MoO3
-30Bi2O3-50B2O3sample measured experimentally and simulated by FLUKA
code. Table 2
The glass composition and the density of the TeO2-WO3-GeO2glass system.
Glass Sample Glass composition Density (gm/cm3)
TeWGe1 75TeO2-5WO3-20GeO2 4.42
TeWGe2 85TeO2-5WO3-10GeO2 4.45
TeWGe3 90TeO2-5WO3-5.0GeO2 4.50
TeWGe4 94TeO2-5WO3-1.0GeO2 4.53
TeWGe5 95TeO2-5WO3 4.56
Table 3
The weight fraction of each element in the investigated TeO2-WO3-GeO2glass
system.
Elements Weight Fraction of Elements
TeWGe1 TeWGe2 TeWGe3 TeWGe4 TeWGe5
O 0.215479 0.207966 0.204402 0.201638 0.200959 Ge 0.095406 0.04604 0.022625 0.004464 0 Te 0.628723 0.687708 0.715684 0.737385 0.742718 W 0.060392 0.058287 0.057288 0.056513 0.056323 0.5 1.0 1.5 2.0 2.5 3.0 3.5 4.0 4.5 5.0 5.5 6.0 6.5 -1.6 -1.4 -1.2 -1.0 -0.8 -0.6 -0.4 -0.2 TeWGe1 1.330 MeV 1.173 MeV 0.662 MeV 0.356 MeV y = -0.2255 x + 0.0264 y = -0.2359 + 9.16e10-4 y = -0.3359x + 3.09e10-4 y = -0.5668 x - 0.0022 ln (I/Io ) Sample thickness (cm)
Fig. 5a. Graphical representation of decrease in intensity of gamma photons due to absorption in 75TeO2-5WO3-20GeO2.
element is shown inTables 2 and 3 [36]. These details have been fed to FLUKA input file using USRBDX score card to obtain transmission va-lues through the sample of desired thickness. The plots of the fractional transmission (in log scale) versus the thickness (linear scale) of glass samples at different energies have been shown inFigs. 5(a) and 5(b). The equations representing straight line fits through these data points have also been shown in these figures. From the Eq.(1)of
Lambert-Beer's law, it can be easily seen that slope of these equations (obtained after plotting ln(I/Io) versus thickness) represents ‘linear attenuation coefficient’. The negative sign of slope merely indicates that the transmission decreases with the increase of sample thickness. The ‘mass attenuation coefficient’ is obtained by normalizing the ‘linear attenua-tion coefficient’ with density of material to overcome the dependency of the material on density. For example, inFig. 5(a), for 75TeO2-5WO3
-20GeO2 at 356 keV, the straight line best fit equation is 0.5 1.0 1.5 2.0 2.5 3.0 3.5 4.0 4.5 5.0 5.5 6.0 6.5 -1.6 -1.4 -1.2 -1.0 -0.8 -0.6 -0.4 -0.2 y = -0.2220x + 7.22e10-4 y = -0.2367x - 0.0020 y = -0.3392 + 2.05e10-4 y = -0.5793x - 0.0016 TeWGe2 1.330 MeV 1.173 MeV 0.662 MeV 0.356 MeV ln (I/Io ) Sample thickness (cm) 0.5 1.0 1.5 2.0 2.5 3.0 3.5 4.0 4.5 5.0 5.5 6.0 6.5 -1.6 -1.4 -1.2 -1.0 -0.8 -0.6 -0.4 -0.2 y = -0.2237x + 3.2e10-4 y = -0.2388x - 0.0039 y = -0.3418x - 0.0024 y = -0.5896x -0.0011 TeWGe3 1.330 MeV1.173 MeV 0.662 MeV 0.356 MeV ln (I/Io ) Sample thickness (cm) 0.5 1.0 1.5 2.0 2.5 3.0 3.5 4.0 4.5 5.0 5.5 6.0 6.5 -1.6 -1.4 -1.2 -1.0 -0.8 -0.6 -0.4 -0.2 y = -0.2255x + 0.0020 y = -0.2406x -0.0017 y = -0.3448x - 5.84e10-4 y = -0.5950x -0.0012 TeWGe4 1.330 MeV1.173 MeV 0.662 MeV 0.356 MeV ln (I/Io) Sample thickness (cm) 0.5 1.0 1.5 2.0 2.5 3.0 3.5 4.0 4.5 5.0 5.5 6.0 6.5 -1.6 -1.4 -1.2 -1.0 -0.8 -0.6 -0.4 -0.2 y = -0.2265x + 0.0026 y = -0.2426x -0.0072 y = -0.3480x + 0.0024 y = -0.6007x -2.2e10-4 TeWGe5 1.330 MeV 1.173 MeV 0.662 MeV 0.356 MeV ln (I/Io) Sample thickness (cm)
Fig. 5b. Graphical representation of decrease in intensity of gamma photons due to absorption in 85TeO2-5WO3-10GeO2, 90TeO2-5WO3-5.0GeO2, 94TeO2-5WO3
-1.0GeO2and 95TeO2-5WO3.
Table 4
Mass attenuation values calculated with FLUKA and comparison to XCOM da-tabase.
(a)
Glass Samples 356 keV 662 keV 1173 keV 1330 keV
FLUKA XCOM FLUKA XCOM FLUKA XCOM FLUKA XCOM
TeWGe1 0.1282 0.1291 0.0760 0.0762 0.0534 0.0536 0.0510 0.0500 TeWGe2 0.1302 0.1308 0.0762 0.0763 0.0532 0.0535 0.0499 0.0499 TeWGe3 0.1310 0.1316 0.0760 0.0763 0.0531 0.0534 0.0497 0.0498 TeWGe4 0.1314 0.1322 0.0761 0.0764 0.0531 0.0534 0.0498 0.0498 TeWGe5 0.1317 0.1323 0.0763 0.0764 0.0532 0.0533 0.0497 0.0498 (b)
Glass Samples Percentage difference between FLUKA and XCOM results
356 keV 662 keV 1173 keV 1330 keV
TeWGe1 0.70 0.26 0.37 2.00 TeWGe2 0.46 0.13 0.56 0 TeWGe3 0.46 0.39 0.56 0.20 TeWGe4 0.61 0.39 0.56 0 TeWGe5 0.45 0.13 0.19 0.20 400 600 800 1000 1200 1400 0.04 0.06 0.08 0.10 0.12 0.14 TeWGe1 y = 0.0485 + 0.2742 exp(-x/288.1) Mass attenuation coefficient (cm 2 /gm) Energy (KeV) FLUKA XCOM
Fig. 6a. Variation of mass attenuation coefficient of 75TeO2-5WO3
y = −0.5668 × −0.0022, where the slope value 0.5668 represents linear attenuation coefficient (cm−1) of sample. By dividing this value
of linear attenuation coefficient by density of sample (4.42 gm/cm3),
the value of mass attenuation coefficient comes out to be 0.1282 gm/ cm2. Similarly, the mass attenuation coefficients can be obtained from
all other linear fit equations inFigs. 5(a) and (b).
The results obtained with FLUKA code are also compared with XCOM standard reference database. The data presented in Table 4(a)–(b) indicates that the simulated µmvalues by FLUKA code
are very close with those of obtained from XCOM database. Ad-ditionally, the present data has been confirmed by Kaky et al.[37]and Akman et al.[38], which prove that the largest differences occur in μm
values for glasses and ceramics in low energy range, while the re-searchers observed that at intermediate energies, the B2O3–TeO2–ZnO–Al2O3–Li2O–MgO glass system and various ceramic
samples, including calcium silicide, magnesium silicide, magnesium boride, calcium hexaboride, aluminum oxide, and titanium dioxide, have nearly stationary μmvalues. The percentage of difference between
the FLUKA and XCOM were calculated according to the following re-lation: = × Percentage difference µ µ µ 100 m,FLUKA m,XCOM m,XCOM (6)
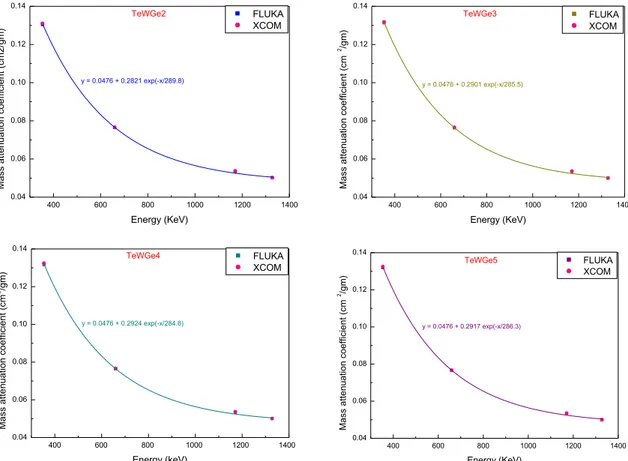
The results obtained from the above relation are summarized in Table 4(b). The difference between the FLUKA results and XCOM da-tabase is found to be less than 2%. Moreover, the obtained values of mass attenuation coefficients for different glasses as a function of en-ergy (356, 662, 1173 and 1330 keV) have been shown inFigs. 6(a) and (b). The best lines of fit in equation form for various glass samples have been shown in these figures andTable 5. From the figures and table, it is clear that the trend of mass attenuation coefficients versus photon energy follows first order exponential decay. It is observed that these equations could reproduce the mass attenuation coefficient values of present glass system at any desired energy within the range of 356–1330 keV. For example, some useful energy values 427.9 (125Sb),
795.8 (134Cs), 834.8 (54Mn), 1112.1 (152Eu) and 1274.6 (22Na) have
been chosen to estimate values of mass attenuation coefficients from the best fitted equations. For the validity of these equations, a com-parison has also been made with FLUKA values in the same table and it has been found that the results obtained from fitted equations are in good agreement with FLUKA based values. It is observed that these
400 600 800 1000 1200 1400 0.04 0.06 0.08 0.10 0.12 0.14 TeWGe2 y = 0.0476 + 0.2821 exp(-x/289.8) Mass attenuation coefficient (cm2/gm) Energy (KeV) FLUKA XCOM 400 600 800 1000 1200 1400 0.04 0.06 0.08 0.10 0.12 0.14 TeWGe3 y = 0.0476 + 0.2901 exp(-x/285.5) Mass attenuation coefficient (cm 2/gm) Energy (KeV) FLUKA XCOM 400 600 800 1000 1200 1400 0.04 0.06 0.08 0.10 0.12 0.14 TeWGe4 y = 0.0476 + 0.2924 exp(-x/284.6) Mass attenuation coefficient (cm 2 /gm) Energy (keV) FLUKA XCOM 400 600 800 1000 1200 1400 0.04 0.06 0.08 0.10 0.12 0.14 TeWGe5 y = 0.0476 + 0.2917 exp(-x/286.3) Mass attenuation coefficient (cm 2/gm) Energy (KeV) FLUKA XCOM
Fig. 6b. Variation of mass attenuation coefficient of 85TeO2-5WO3-10GeO2, 90TeO2-5WO3-5.0GeO2, 94TeO2-5WO3-1.0GeO2and 95TeO2-5WO3glass system as a
function of gamma photon energy. Table 5
Equations for estimation of mass attenuation and comparison to FLUKA results.
Glass sample Best Fitted Equation Energy (KeV) Mass attenuation coefficient (cm2/gm) Percentage Difference
Fitted Equation FLUKA
TeWGe1 y = 0.0485 + 0.2742 exp(−x/288.1) 427.9 (125Sb) 0.1106 0.1070 3.4
TeWGe2 y = 0.0476 + 0.2821 exp(−x/289.8) 795.8 (134Cs) 0.0657 0.0673 2.4
TeWGe3 y = 0.0476 + 0.2901 exp(−x/285.5) 834.8 (54Mn) 0.0632 0.0652 3.1
TeWGe4 y = 0.0476 + 0.2924 exp(−x/284.6) 1112.1 (152Eu) 0.0535 0.0549 2.5
equations are simple and handy formulas for the rapid estimation of attenuation coefficients of TeO2-WO3-GeO2based glass systems at any
energy within the range of 356–1330 keV.
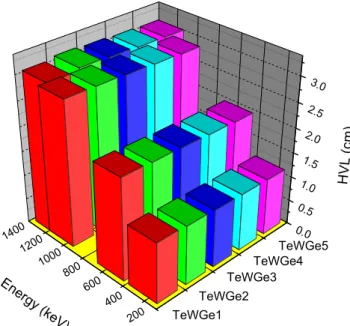
The ability of a material to reduce radiation can be directly and briefly described by calculating the mean free path (MFP) and half value layer (HVL) parameters of the relevant sample. As well known, low values of these parameters indicate how superior the shielding performance is due to lesser volume needs of the sample. Therefore, both MFP and HVL values of TeWGe1–TeWGe5 glasses have been es-timated. The comparisons of MFP and HVL values for the chosen glasses depending on the photon energies are graphically, with the help of bar diagrams, demonstrated inFigs. 7 and 8, respectively. It is easily un-derstandable from these figures that MFP and HVL values increase with increment of photon energies. Accordingly, high energy photons pos-sess more penetration within the glass when compared with the
photons with low energy. This systematically confirms with the phy-sical behavior obtained from the trends of µmvalues. These behaviors
overlap with the results reported by Agar et al.[39]. On the other hand, the MFP and HVL values of glasses are in the descending order of TeWGe1 > TeWGe2 > TeWGe3 > TeWGe4 > TeWGe5. These findings mean that the shielding parameters get affected inversely from the density of the glasses. Thus, the TeWGe5 glass sample has a superior capability to shield gamma photons in comparison to the rest of the glasses.
Conclusions
The validity of the physical models applied in FLUKA Monte Carlo code has been benchmarked for selective glass samples for some useful energy values. To the best of our knowledge, no study has reported the shielding related parameters of glass systems based upon FLUKA Monte Carlo simulations. Firstly, the results obtained by FLUKA are tested against previously reported experimental data for MoO3-B2O3-Bi2O3
glasses and it is found that FLUKA results are very close to experimental data. These findings indicate that FLUKA simulations can be a good choice in estimating the radiation shielding parameters of glasses. Thereafter, the difference between the µmvalues of FLUKA code and
XCOM data base for TeO2-WO3-GeO2system has been calculated and
found to be lower than 0.7% with exception at 1330 keV for TeWGe1 sample. Moreover, MFP and HVL results indicate that TeWGe5 glass sample has the best shielding performance among the selected glasses. References
[1] Kahraman A, Yilmaz E, Aktag A, Kaya S. Evaluation of radiation sensor aspects of Er2O3MOS capacitors under zero gate bias. IEEE Trans Nucl Sci 2016;63:1284–93.
https://doi.org/10.1109/TNS.2016.2524625.
[2] Kahraman A, Yilmaz E. Irradiation response of radio-frequency sputtered Al/
Gd2O3/p-Si MOS capacitors. Radiat Phys Chem 2017;139:114–9.https://doi.org/
10.1016/j.radphyschem.2017.04.003.
[3] Kavun Y, Boztosun I, Dapo H, Maraş I, Segebade C. Determination of the Sr/Ca ratio of tooth samples by photoactivation analysis in Southern Turkey. Radiochim Acta
2018.https://doi.org/10.1515/ract-2017-2918.
[4] Agar O, Boztosun I, Segebade C. Multielemental analysis of some soils in Karaman
by PAA using a cLINAC. Appl Radiat Isot 2017;122.https://doi.org/10.1016/j.
apradiso.2017.01.011.
[5] Fernandes Â, Barreira JCM, Günaydi T, Alkan H, Antonio AL, Oliveira MBPP, et al. Effect of gamma irradiation and extended storage on selected chemical constituents
and antioxidant activities of sliced mushroom. Food Control 2017.https://doi.org/
10.1016/j.foodcont.2016.04.044.
[6] Gölge E, Ova G. The effects of food irradiation on quality of pine nut kernels. Radiat
Phys Chem 2008.https://doi.org/10.1016/j.radphyschem.2007.06.005.
[7] Sayyed MI, Akman F, Kumar A, Kaçal MR. Evaluation of radioprotection properties
of some selected ceramic samples. Results Phys 2018.https://doi.org/10.1016/j.
rinp.2018.11.028.
[8] Agar O. Study on gamma ray shielding performance of concretes doped with natural
sepiolite mineral. 2018.
[9] Kumar Ashok, Ramandeep Kaur MI, Sayyed M Rashad, Singh Mandeep, Ali Atif
Mossad. Physical, structural, optical and gamma ray shielding behavior of (20+x)
PbO-10 BaO-10 Na2O-10 MgO-(50–x) B2O3 glasses. Phys B Condens Matter
2019;552:110–8.
[10] Ashok Kumar, Dong MG, Sayyed MI, Lakshminarayana G, Xue XX, Mahdi MA.
Gamma-ray shielding effectiveness of lead bismuth germanoborate glasses, glass
physics and chemistry. Glass Phys Chem 2018;44(4):292–9.
[11] Issa SAM, Saddeek YB, Tekin HO, Sayyed MI, Saber Shaaban K. Investigations of radiation shielding using Monte Carlo method and elastic properties of
PbO-SiO2-B2O3-Na2O glasses. Curr Appl Phys 2018.https://doi.org/10.1016/j.cap.2018.02.
018.
[12] Sayyed MI, Rammah YS, Abouhaswa AS, Tekin HO, Elbashir BO. ZnO-B2O3-PbO glasses: synthesis and radiation shielding characterization. Phys B Condens Matter
2018.https://doi.org/10.1016/j.physb.2018.08.024.
[13] Ozan Tekin H, Sayyed MI, Manici T, Altunsoy EE. Photon shielding characteriza-tions of bismuth modified borate –silicate–tellurite glasses using MCNPX Monte
Carlo code. Mater Chem Phys 2018.https://doi.org/10.1016/j.matchemphys.2018.
02.009.
[14] Lakshminarayana G, Sayyed MI, Baki SO, Lira A, Dong MG, Kaky KM, et al. Optical absorption and gamma-radiation-shielding parameter studies of Tm3+-doped
multicomponent borosilicate glasses. Appl Phys A Mater Sci Process 2018.https://
doi.org/10.1007/s00339-018-1801-4.
[15] Sayyed SBMI, Kaky KM, Gaikwad DK, Agar O, Gawai UP. Physical, structural, op-tical and gamma radiation shielding properties ofborate glasses containing heavy
metals (Bi2O3/MoO3). J Non Cryst Solids 2019;507:30–7.https://doi.org/10.
200 400 600 800 1000 1200 1400 0 1 2 3 4 TeWGe5 TeWGe4 TeWGe3 TeWGe2 TeWGe1
Mean
free
pa
th
(c
m
)
Energ
y (keV
)
Fig. 7. Comparison of mean free path of different glass systems as a function of photon energies. 200 400 600 800 1000 1200 1400 0.0 0.5 1.0 1.5 2.0 2.5 3.0 TeWGe5 TeWGe4 TeWGe3 TeWGe2 TeWGe1
HVL
(cm
)
Energ
y (keV
)
Fig. 8. Comparison of half-value layer of different glass systems as a function of photon energies.
1016/j.jnoncrysol.2018.12.010.
[16] Gaikwad DK, Obaid SS, Sayyed MI, Bhosale RR, Awasarmol VV, Kumar A, et al. Comparative study of gamma ray shielding competence of WO3-TeO2-PbO glass system to different glasses and concretes. Mater Chem Phys 2018;213:508–17.
https://doi.org/10.1016/j.matchemphys.2018.04.019.
[17] Kumar A. Gamma ray shielding properties of PbO-Li2O-B2O3glasses. Radiat Phys
Chem 2017;136:50–3.https://doi.org/10.1016/j.radphyschem.2017.03.023.
[18] Pires LF, Medhat ME. Different methods of mass attenuation coefficient evaluation: influences in the measurement of some soil physical properties. Appl Radiat Isot
2016.https://doi.org/10.1016/j.apradiso.2016.02.012.
[19] Canel A, Korkut H, Korkut T. Improving neutron and gamma flexible shielding by adding medium-heavy metal powder to epoxy based composite materials. Radiat
Phys Chem 2019;158:13–6.https://doi.org/10.1016/j.radphyschem.2019.01.005.
[20] Battistoni G, Boehlen T, Cerutti F, Chin PW, Esposito LS, Fassò A, et al. Overview of
the FLUKA code. Ann Nucl Energy 2015.https://doi.org/10.1016/j.anucene.2014.
11.007.
[21] Ballarini F, Battistoni G, Brugger M, Campanella M, Carboni M, Cerutti F, et al. The
physics of the FLUKA code: recent developments. Adv Sp Res 2007.https://doi.org/
10.1016/j.asr.2007.05.031.
[22] Böhlen TT, Cerutti F, Chin MPW, Fassò A, Ferrari A, Ortega PG, et al. The FLUKA Code: developments and challenges for high energy and medical applications. Nucl
Data Sheets 2014.https://doi.org/10.1016/j.nds.2014.07.049.
[23] Collamati F. An intraoperative Beta-Probe for Cancer Surgery. Switzerland:
Springer International Publishing; 2016.
[24] Medhat ME, Demir N, Akar Tarim U, Gurler O. Calculation of gamma-ray mass attenuation coefficients of some Egyptian soil samples using Monte Carlo methods.
Radiat Eff Defects Solids 2014.https://doi.org/10.1080/10420150.2014.918129.
[25] Demir N, Tarim UA, Popovici MA, Demirci ZN, Gurler O, Akkurt I. Investigation of mass attenuation coefficients of water, concrete and bakelite at different energies
using the FLUKA Monte Carlo code. J Radioanal Nucl Chem 2013.https://doi.org/
10.1007/s10967-013-2494-y.
[26] Bazo J, Rojas JM, Best S, Bruna R, Endress E, Mendoza P, et al. Testing FLUKA on neutron activation of Si and Ge at nuclear research reactor using gamma spectro-scopy. Nucl Instrum Meth Phys Res Sect A Accel Spectrom Detect Assoc Equip 2018.
https://doi.org/10.1016/j.nima.2017.12.042.
[27] Agar O, Sayyed MI, Akman F, Tekind HO, Kaçal MR. An extensive investigation on gamma ray shielding features of Pd/Ag-based alloys. Nucl Eng Technol 2019.
https://doi.org/10.1016/j.net.2018.12.014.
[28] Akman F, Geçibesler IH, Sayyed MI, Tijani SA, Tufekci AR, Demirtas I. Determination of some useful radiation interaction parameters for waste foods.
Nucl Eng Technol 2018.https://doi.org/10.1016/j.net.2018.05.007.
[29] Eke C, Agar O, Segebade C, Boztosun I. Attenuation properties of radiation shielding materials such as granite and marble against γ-ray energies between 80 and 1350
keV. Radiochim Acta 2017;105.https://doi.org/10.1515/ract-2016-2690.
[30] Sayyed MI, Akman F, Kumar A, Kaçal MR. Evaluation of radioprotection properties
of some selected ceramic samples. Results Phys 2018;11:1100–4.https://doi.org/
10.1016/j.rinp.2018.11.028.
[31] Akman F, Kaçal MR, Sayyed MI, Karataş HA. Study of gamma radiation attenuation properties of some selected ternary alloys. J Alloys Compd 2019;782:315–22.
https://doi.org/10.1016/j.jallcom.2018.12.221.
[32] A. Ferrari, others, FLUKA: A multi-particle transport code (Program version 2005), Cern-2005-010. (2005). doi: 10.5170/cern-2005-010.
[33] Mark S, Khomchenko S, Shifrin M, Haviv Y, Schwartz JR, Orion I. TVF-NMCRC-A powerful program for writing and executing simulation inputs for the Fluka Monte Carlo Code system. Nucl Instrum Meth Phys Res Sect A Accel Spectrom Detect Assoc
Equip 2007.https://doi.org/10.1016/j.nima.2006.12.007.
[34] Vlachoudis V. FLAIR: a powerful but user friendly graphical interface for FLUKA.
Proc Int Conf Math Comput 2009.https://doi.org/10.1016/S1473-3099(14)
71090-4.
[35] Dong MG, Agar O, Tekin HO, Kilicoglu O, Kaky KM, Sayyed MI. A comparative study on gamma photon shielding features of various germanate glass systems.
Compos Part B Eng 2019;165:636–47.https://doi.org/10.1016/j.compositesb.
2019.02.022.
[36] Jamalaiah BC. GeO2activated tellurite tungstate glass: a new candidate for solid
state lasers and fiber devices. J Non Cryst Solids 2018.https://doi.org/10.1016/j.
jnoncrysol.2018.03.032.
[37] Kaky KM, Sayyed MI, Laariedh F, Abdalsalam AH, Tekin HO, Baki SO. Stuctural, optical and radiation shielding properties of zinc boro-tellurite alumina glasses.
Appl Phys A Mater Sci Process 2019.https://doi.org/10.1007/s00339-018-2329-3.
[38] Akman F, Khattari ZY, Kaçal MR, Sayyed MI, Afaneh F. The radiation shielding features for some silicide, boride and oxide types ceramics. Radiat Phys Chem 2019.
https://doi.org/10.1016/j.radphyschem.2019.03.001.
[39] Agar O, Tekin HO, Sayyed MI, Korkmaz ME, Culfa O, Ertugay C. Experimental in-vestigation of photon attenuation behaviors for concretes including natural perlite
mineral. Results Phys 2019;12:237–43.https://doi.org/10.1016/j.rinp.2018.11.