RESEARCH ARTICLE
Happiness around the world: A combined
etic-emic approach across 63 countries
Gwendolyn GardinerID1*, Daniel Lee1, Erica Baranski2, David Funder1, Members of the
International Situations Project¶
1 Department of Psychology, The University of California, Riverside, California, United States of America, 2 Department of Psychology, The University of Houston, Houston, Texas, United States of America
¶ Complete membership of the International Situations Project group is provided in the Acknowledgments. *[email protected]
Abstract
What does it mean to be happy? The vast majority of cross-cultural studies on happiness have employed a Western-origin, or “WEIRD” measure of happiness that conceptualizes it as a self-centered (or “independent”), high-arousal emotion. However, research from East-ern cultures, particularly Japan, conceptualizes happiness as including an interpersonal aspect emphasizing harmony and connectedness to others. Following a combined emic-etic approach (Cheung, van de Vijver & Leong, 2011), we assessed the cross-cultural appli-cability of a measure of independent happiness developed in the US (Subjective Happiness Scale; Lyubomirsky & Lepper, 1999) and a measure of interdependent happiness devel-oped in Japan (Interdependent Happiness Scale; Hitokoto & Uchida, 2015), with data from 63 countries representing 7 sociocultural regions. Results indicate that the schema of inde-pendent happiness was more coherent in more WEIRD countries. In contrast, the coher-ence of interdependent happiness was unrelated to a country’s “WEIRD-ness.” Reliabilities of both happiness measures were lowest in African and Middle Eastern countries, suggest-ing these two conceptualizations of happiness may not be globally comprehensive. Overall, while the two measures had many similar correlates and properties, the self-focused con-cept of independent happiness is “WEIRD-er” than interdependent happiness, suggesting cross-cultural researchers should attend to both conceptualizations.
Introduction
What does it mean to be happy? The answer might depend, at least in part, on cultural context. Laypeople, scientists, and even governments seek to assess the happiness of nations around the world. Some investigators ask which countries have the happiest people, while others seek pre-dictors of happiness at the country or individual level. However, almost all international stud-ies of happiness rely on measures developed in the West, which may impose inappropriate conceptualizations, styles, or values [1–5]. Moreover, empirical research exploring cultural dis-tinctions in happiness beyond just a few countries (usually two)–is sorely lacking. The present article, following a combined etic-emic approach [6], assesses two measures of happiness, a1111111111 a1111111111 a1111111111 a1111111111 a1111111111 OPEN ACCESS
Citation: Gardiner G, Lee D, Baranski E, Funder D, Members of the International Situations Project (2020) Happiness around the world: A combined etic-emic approach across 63 countries. PLoS ONE 15(12): e0242718.https://doi.org/10.1371/journal. pone.0242718
Editor: Shang E. Ha, Sogang University (South Korea), REPUBLIC OF KOREA
Received: July 6, 2020 Accepted: November 8, 2020 Published: December 9, 2020
Copyright: This is an open access article, free of all copyright, and may be freely reproduced, distributed, transmitted, modified, built upon, or otherwise used by anyone for any lawful purpose. The work is made available under theCreative Commons CC0public domain dedication. Data Availability Statement: Data and code are available at:https://osf.io/jrbt3/.
Funding: The research was supported by the US National Science Foundation under Grant BCS-1528131 for the primary authors. Data gathering in the Czech Republic was supported by grant 17-14387S by the Czech Science Foundation and by institutional research funding RVO: 68081740 from the Institute of Psychology, Czech Academy of Sciences. Data gathering in Chile was partly supported by the Centre for Social Conflict and
developed in the United States and Japan, across 63 countries on all of the inhabited continents of the world.
Early cross-cultural research usually tested the generalizability of established psychological measures, almost always developed in the United States, in other cultures. For example, researchers have assessed the universality of the Big Five personality traits across multiple counties [7,8]. This method is known as the etic approach. However, the etic approach often overlooks important aspects of a particular culture because they are not included in the origi-nal measure, typically developed within Western contexts. The emic approach to cross-cultural psychology attempts to compensate for this problem by developing measures of concepts deemed important to a particular culture, including non-Western contexts, using a bottom-up approach. While the emic approach is crucial for comprehensive assessments of cultural attri-butes, it often emphasizes cultural uniqueness and lacks widespread applicability outside of the cultural context [6]. The combined etic-emic approach attempts to utilize the benefits of both approaches, by assessing the generalizability of multiple measures of a similar construct across multiple groups in culturally distinctive contexts.
Cross-cultural research on happiness
The vast majority of research on happiness has originated in WEIRD countries (Western, Edu-cated, Industrialized, Rich, and Democratic [9]), most frequently the United States (while many authors distinguish among terms such as happiness, well-being, positive affect, and life satisfaction, here we incorporate all of these terms under the common construct of happiness for a more comprehensive review of the literature). Accordingly, the prevailing conceptualiza-tion of happiness is consistent with a historically Protestant, self-centered worldview that emphasizes personal worthiness and hard work to obtain positive outcomes [10], and sees hap-piness as a personal achievement rather than the result of good fortune or context [5,11]. This view further assumes the self is largely independent of others, and thus one’s happiness is inde-pendent of others. Additionally, people in Western societies, most notably in America, appar-ently enjoy higher levels of emotional arousal [12], which may also reflect historical and modern Christian influences [13].
In contrast, the East Asian worldview has been described as one in which the self is more entwined with others, such that personal happiness depends on positive connections in social relationships [5]. For example, one study found that Koreans are more likely than Americans to spontaneously mention the word “family” when asked what they typically associate with the word “happiness” [14]. Additionally, the Eastern view of happiness prioritizes a lower level of emotional arousal [12]. Lower arousal can encompass both positive and negative emotions, with balance and harmony being more valued than a high ratio of positive to negative affect [11,15].
Previous studies have also found cultural distinctions in predictors and consequences of happiness [16]. Self-esteem is often the strongest predictor of happiness in Western cultures, but this relationship is generally weaker in East Asian cultures [17]. Relational self-esteem, such as being proud of one’s family, is a stronger predictor of subjective well-being for Chinese students than is personal self-esteem [18]. Other predictors of happiness that vary by culture are contextual events, such as positive daily life experiences, which are stronger predictors of well-being for East Asians than for Westerners [19]. Lastly, interventions designed to increase happiness can have different results in different cultures [20]. For example, practicing grati-tude is typically associated with increased positive emotions for Americans but may lead to mixed feelings for Koreans, such as feeling guilt or indebtedness along with love [21].
Overall, evidence from cross-cultural studies on the differences in definitions, associations, and consequences of happiness suggests previous Western-centered conceptualizations of Cohesion Studies (FONDAP 15130009) and Center
for Intercultural and Indigenous Research (CIIR) (FONDAP 15110006).
Competing interests: The authors have declared that no competing interests exist.
happiness are far from universal. Additionally, if the concept of happiness varies cross-cultur-ally, the method of measuring happiness across cultures must also vary accordingly. For exam-ple, the Eastern conceptualization of happiness as more intertwined with others may be masked from researchers who only assess happiness using measures developed with a Western, independent focus. Thus, the evidence of cross-cultural differences in happiness point to a greater need for incorporating more culturally sensitive measures of happiness.
Independent vs. interdependent measures of happiness
Despite the widespread acknowledgment of cultural distinctions in the concept of happiness and the evident need for a measure developed in a non-WEIRD country, emic (indigenous) measures developed outside of the West have become available only recently. One such measure, the Inter-dependent Happiness Scale (IHS), developed by researchers in Japan [22], was designed to encompass the main components of happiness based on the outlook of individuals in East Asia, specifically Japan. The IHS assesses three main components: relationship orientation, quiescence, and embeddedness in the ordinariness of others. Relationship orientation means that one’s own happiness is dependent upon the happiness of others—an important aspect of this dependency comes from interpersonal harmony. Quiescence comes from an Eastern belief that part of happi-ness is the absence of negative events or potential for social disruptions that may hinder a peaceful existence. Embeddedness in the ordinariness of others comes from the Eastern preference for nor-mality in the sense that everyone is on an equal level in their success and accomplishments.
The Interdependent Happiness Scale (IHS) differs from traditional Western measures of happiness in both its ideal level of affect and in its lesser emphasis on comparisons with others. For example, one common measure of happiness developed in the West, the Satisfaction with Life Scale (SWLS: [23]), asks individuals how much they agree with the statement “The condi-tions of my life are excellent,” implying a high level of affect intensity. In contrast, the IHS asks if individuals have “any concerns or anxieties” with the absence of negative affect indicating greater well-being. Likewise, another Western measure of happiness, the Subjective Happiness Scale (SHS: [24]), asks participants to compare themselves to others around them and rate if they are “more happy” or “less happy.” In contrast, the IHS asks participants how much they agree with the statement that they are “just as happy as others around them,” incorporating the interdependence of others’ happiness into the measure. The Western conceptualizations of happiness can be defined in terms of independence while the Eastern conceptualizations of happiness can be defined in terms of interdependence. Thus, from this point forward, we will refer to self-focused, Western conceptualizations of happiness asindependent happiness and
Eastern conceptualizations of happiness asinterdependent happiness.
Little is known regarding how well these two conceptualizations of happiness generalize beyond the East vs. West dichotomy that seems ubiquitous in cross-cultural research [4]. Non-WEIRD countries encompass a wide range of diverse cultural values, religious beliefs, political institutions, and even geographic conditions that can all influence psychological constructs [25]. These overlapping influences could be expected to affect the extent to which independent or interdependent concepts of happiness generalize cross-culturally. For example, Latin Amer-ica societies and East Asians societies are both seen as collectivistic, valuing close relationships with others, which would suggest an interdependent view of happiness. However, one study on cultural differences in ideal affect found Mexicans prefer higher arousal positive emotions while Hong Kong Chinese prefer lower arousal positive emotions [26], suggesting the quies-cence aspect of the Interdependent Happiness Scale may not apply in Latin American societies. Assessing a wider range of cultures beyond the most commonly included Western and Eastern countries will help further test the generalizability of these two concepts of happiness.
The current study
The purpose of the present study is to compare and contrast the two cultural conceptualiza-tions of independent and interdependent happiness in many countries around the world. Using a combined etic-emic approach [6], we assessed the Western conceptualization of inde-pendent happiness using a measure developed and widely-used in the United States (Subjec-tive Happiness Scale, SHS: [24]) and the Eastern conceptualization of interdependent
happiness using the Interdependent Happiness Scale (IHS), developed in Japan [22]. While the Interdependent Happiness Scale (IHS) has been assessed in a number of Eastern and Western countries (e.g., [27]), a large-scale assessment comparing the measure with a Western measure of happiness across diverse cultural contexts has yet to be reported. Additionally, previous cross-cultural research on happiness has typically only compared Westerners (usually in the US or Canada) with East Asians (most commonly Japan), while neglecting cultures in Africa, Latin America, the Middle East, and Southeast Asia [4]. We sought to assess the constructs of Eastern interdependent happiness with a Western measure of independent happiness across a wide range of 63 culturally diverse countries to determine the generalizability of the measures both within and outside of the Eastern and Western contexts.
Methods
Participants
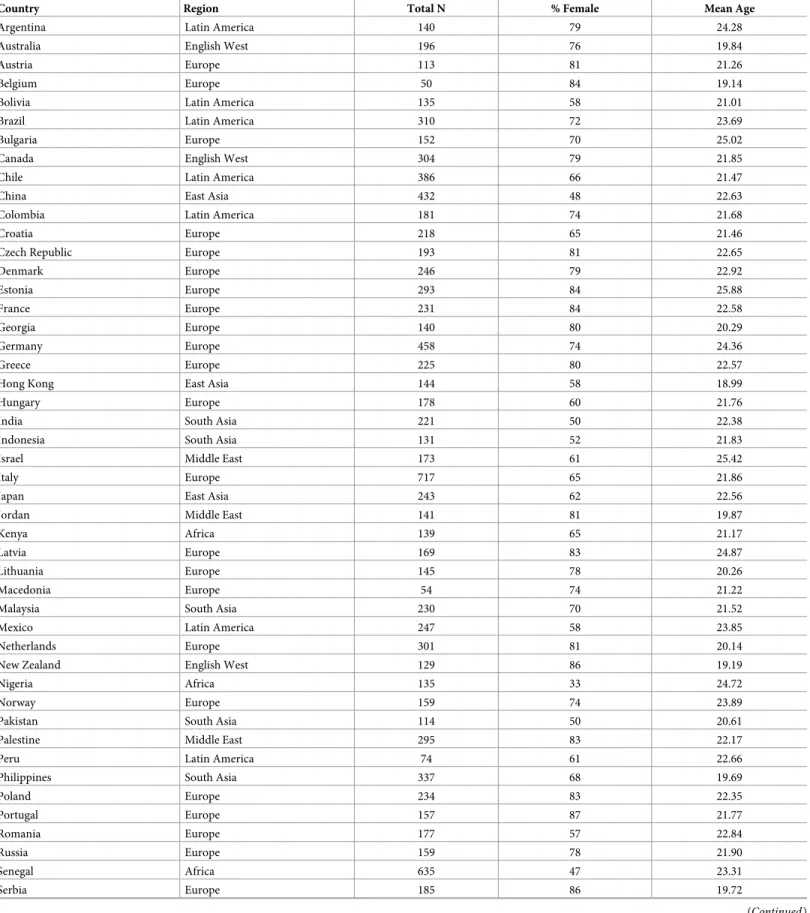
Participants (N = 15,368; 71% female) were recruited by local collaborators from 63 countries (seeTable 1) and were members of their local university and college communities (Mage=
21.93). The average sample size across all the countries wasn = 246 (range: 50–1,366).
Partici-pants either volunteered or received compensation in the form of extra credit, course credit, small gifts, or monetary payment for participation.
Measures
The analyses presented below stem from the International Situations Project (ISP), a large cross-cultural study assessing situational experience, daily behavior, and individual differences. Other analyses based on this large and diverse data set have been published [28–30] or are in progress, but all analyses reported in the present article are new and unique. For an overview of the project, including all measures and translations, see
situationslab.com/the-international-situations-project. Only measures included in the present analyses are described in this article, along with country-level variables collected previously and separately by other researchers or obtained from public databases.
Independent happiness. The Western measure of happiness was the Subjective
Happi-ness Scale (SHS: [24]). The SHS is one of the most widely used measures of happiness in stud-ies conducted in the US and Europe. The measure has 4 items to which participants respond on a 7-point scale (e.g., “Compared with most of my peers, I consider myself. . .” 1 =less happy
to 7 =more happy).
Interdependent happiness. The Eastern measure of happiness was the Interdependent
Happiness Scale [22]. The IHS was developed in Japan and validated against samples in the United States, Germany, and South Korea. The measure has 9 items to which participants respond on a 5-point scale (e.g., “I believe that my life is just as happy as that of others around me” 1 =strongly disagree, 5 = strongly agree).
Country-level variables. The current analyses use several country-level variables obtained
from publicly available databases. Country level variables were chosen to represent a range of socioecological, geographic, and psychological variables that could be feasibly related to
Table 1. Demographic information by country.
Country Region Total N % Female Mean Age
Argentina Latin America 140 79 24.28
Australia English West 196 76 19.84
Austria Europe 113 81 21.26
Belgium Europe 50 84 19.14
Bolivia Latin America 135 58 21.01
Brazil Latin America 310 72 23.69
Bulgaria Europe 152 70 25.02
Canada English West 304 79 21.85
Chile Latin America 386 66 21.47
China East Asia 432 48 22.63
Colombia Latin America 181 74 21.68
Croatia Europe 218 65 21.46
Czech Republic Europe 193 81 22.65
Denmark Europe 246 79 22.92 Estonia Europe 293 84 25.88 France Europe 231 84 22.58 Georgia Europe 140 80 20.29 Germany Europe 458 74 24.36 Greece Europe 225 80 22.57
Hong Kong East Asia 144 58 18.99
Hungary Europe 178 60 21.76
India South Asia 221 50 22.38
Indonesia South Asia 131 52 21.83
Israel Middle East 173 61 25.42
Italy Europe 717 65 21.86
Japan East Asia 243 62 22.56
Jordan Middle East 141 81 19.87
Kenya Africa 139 65 21.17
Latvia Europe 169 83 24.87
Lithuania Europe 145 78 20.26
Macedonia Europe 54 74 21.22
Malaysia South Asia 230 70 21.52
Mexico Latin America 247 58 23.85
Netherlands Europe 301 81 20.14
New Zealand English West 129 86 19.19
Nigeria Africa 135 33 24.72
Norway Europe 159 74 23.89
Pakistan South Asia 114 50 20.61
Palestine Middle East 295 83 22.17
Peru Latin America 74 61 22.66
Philippines South Asia 337 68 19.69
Poland Europe 234 83 22.35 Portugal Europe 157 87 21.77 Romania Europe 177 57 22.84 Russia Europe 159 78 21.90 Senegal Africa 635 47 23.31 Serbia Europe 185 86 19.72 (Continued )
country level differences in the conceptualizations of happiness [25,31]. We grouped the country level variables into two categories of “objective” variables (statistics measured by gov-ernment or other organizations) and “subjective” variables (aggregated from individual responses to psychological measurements). For a complete list of all country scores for each of the listed variables, seeS1 File.
Objective country-level variables. A number of “objective” country level variables were
cho-sen to reflect basic characteristics of the country as measured by various organizations, selected based on plausible relevance to happiness and the availability of data for at least 40 of the coun-tries included in our data. These variables were also chosen to be as independent from each other as possible, as many country characteristics (e.g., GDP & life expectancy) are highly cor-related with each other and would thus produce redundant results.
Human Development Index (HDI). The Human Development Index (HDI) is a composite
measure of a country’s development, consisting of life expectancy, educational opportunities, and standard of living [32]. HDI scores were available for all ISP countries except Taiwan. Country HDI scores ranged from .49 (Uganda & Senegal) to .95 (Norway), with higher scores indicating greater economic development.
Population density. Population density is the number of people per sq. km of land area (The
World Bank [33]). Population density data was available for all ISP countries except Taiwan; however, both Hong Kong (7,040 people per sq. km) and Singapore (7,916 people per sq. km) were excluded from analyses because their unusually high density skewed the country-level results. The remaining population density scores ranged from 3 people per sq. km (Australia) to 756 people per sq. km (Palestine).
Growth rate. Population growth rate is the average annual percent change in population of
a country [34]. Growth rate data was available for all ISP countries except Palestine. Country scores ranged from -1.08 (Latvia) to 3.20 (Uganda), with positive scores indicating an increase in population size and negative scores indicating a decrease in population size.
Table 1. (Continued)
Country Region Total N % Female Mean Age
Singapore South Asia 136 78 20.93
Slovakia Europe 148 70 22.41
Slovenia Europe 123 57 20.59
South Africa Africa 256 66 22.20
South Korea East Asia 281 58 22.35
Spain Europe 419 85 19.73
Sweden Europe 130 70 †
Switzerland Europe 755 84 22.35
Taiwan East Asia 162 77 19.71
Thailand South Asia 196 77 19.27
Turkey Middle East 329 68 21.09
Uganda Africa 93 65 22.63
Ukraine Europe 244 77 20.62
United Kingdom Europe 136 89 25.64
United States English West 1366 67 19.86
Vietnam South Asia 168 77 19.05
World Average 246 71 21.93
Note
† = Data not available.
Suicide rate. Suicide rate is the age-standardized suicide rate per 100,000 people, averaged
across sexes [35]. Suicide rates were available for 60 ISP countries. Country scores ranged from 2.50 (Pakistan) to 26.10 (Lithuania), with high scores indicating a higher suicide rate.
Average temperature. Average temperature is the average daily temperature throughout the
entire year in Celsius [36]. Because some larger countries have a wide range of average temper-atures depending upon exact location, the average temperature used was that of the city or cit-ies in which ISP data collection took place. For most countrcit-ies, only one city was included in the average daily temperature. Data on average daily temperature was available for all 63 ISP countries and ranged from 4˚C (Russia) to 29˚C (Thailand).
Subjective country level variables. Subjective country level variables were chosen to reflect
the psychological or cultural characteristics of a country.
WEIRDness. WEIRD country level scores are a measure of cultural distance from the United
States [37]. As computed by Muthukrishna and colleagues [37], the scores reflect a country’s overall dissimilarity to the United States on a range of psychological variables from the World Values Survey (WVS), including personality traits, cultural values, and tightness/looseness. These psychological variables were selected by the authors to include all questions from the WVS that were judged to be culturally transmissible. The United States was chosen as the ref-erence group because of the large American dominance in the field of psychology. Psychologi-cal distance scores were also Psychologi-calculated for China as a comparison, but were excluded from present analyses because the comparison measure of interdependent happiness was developed in Japan. Notably, the cultural distance calculated between the United States and Japan was similar to the cultural distance between China and Japan, meaning the scores computed for China would not be representative of the cultural similarity to the IHS. For the cultural dis-tance scores presented for the United States, we reversed the country scores to make higher scores indicate more similarity and thus a higher level of “WEIRD-ness” as it was originally conceptualized (i.e., more Western, Educated, Industrialized, Rich and Democratic, similar to the United States). Cultural distance WEIRD scores were available for 46 ISP countries. The ‘most WEIRD’ countries (most psychologically similar to the United States) were Canada (.97) and Australia (.97), and the least WEIRD countries was Jordan (.81).
Cultural values. Schwartz’s cultural value orientation scales represent seven distinct bipolar
values assessed in national surveys of students and teachers in 80 countries [38]. The scales measureembeddedness (how embedded people are in their groups), intellectual autonomy (the
independent pursuit of ideas and knowledge),affective autonomy (the independent pursuit of
pleasure),harmony (valuing the group rather than the self), egalitarianism (valuing
coopera-tion and concern for all),hierarchy (reliance on structured and hierarchical social roles), and mastery (valuing success through self-assertion). Country scores for all seven of Schwartz’s
cul-tural values were available for 59 ISP countries.
Procedure
Local collaborators (all of whom were psychologists) translated each of the measures into their local language, which were then back translated into English by an independent translator. The original English version was then compared with the back-translated measure and dis-crepancies were resolved. This method was used to translate all of the research materials into 42 languages. The local collaborators then recruited participants from their college communi-ties (largely students) to log on to our custom-built website (ispstudy.net) with a unique partic-ipant ID. They then completed the informed consent process followed by a series of measures, including the happiness measures reported here. Upon completing the survey, participants had the opportunity to receive feedback on their personality trait levels based on their ratings
on the personality measure included in the survey (a complete wireframe of the study’s website is available online athttps://osf.io/jrbt3/). All procedures were in accordance with the ethical standards of the University of California, Riverside, Office of Research Integrity, who approved this study (HS-11-046), and with the 1964 Helsinki declaration and its later amendments or comparable ethical standards.
Data analytic strategy
Data analyses were separated into those at the individual level and country level to assess how the performance of the happiness measures vary cross-culturally. The first set of analyses were conducted at the individual level, within each country, and results are presented for all 63 countries. These individual level analyses include several internal consistency tests including general factor saturation (ωh) and total common variance (ωt) [39]. Additionally, because the
two happiness measures have an unequal number of items, we present the average communal-ity score (�h2
) and the smallest split half reliability (β) score for each measure. These tests of reli-ability were all conducted separately within each country and then averaged within geographic and cultural regions. To test for the association between the two happiness measures within each country, we used Structural Equation Modeling (SEM) to account for measurement error. Readers interested in comparing the mean levels of the happiness measures across coun-tries may reference theS1 File, but those scores were not included in any of the present analyses.
Because results are presented for many countries here, the second set of analyses attempts to find patterns in the data by analyzing relationships between variables on thecountry level.
Specifically, what country level variables are associated with higher or lower reliability of the happiness measures. These country level tests use the individual level analyses presented within each country as well as country level data collected independently from the current study, to reduce method bias [40]. Given the potential for spurious country-level correlations due to the high number of potential relationships being tested and the subjective manner in which external country variables were selected, randomization tests determined the number of relationships expected by chance [41]. Out of a total of 117 possible correlations (9 averaged individual level values, 13 external country level values) about 7 were expected to be significant by chance. The number of observed statistically significant correlations in the data is 44 (p <
.001), with an average absoluter = .25 (p < .001, expected average absolute r = .13).
Both individual and country level analyses were conducted in R using thepsych [42], multi-con [43], andlavaan [44] packages. All data and R code necessary to recreate the analyses pre-sented here are available on the OSF project page (https://osf.io/jrbt3/).
Results
Individual level happiness measure analyses within each country
Reliability of the happiness measures. The first set of individual level analyses concern
the reliability of the happiness measures within each country. We present multiple tests of internal consistency using the broad approach prescribed by generalizability theory [39]. Each result is presented for each country, considering each as a separate sample, as well as the aver-age across all countries. The internal consistency scores for the Subjective Happiness Scale (SHS) are presented inTable 2and the internal consistency scores for the Interdependent Happiness Scale (IHS) are presented inTable 3. Averages of these countries’ scores for both happiness measures within geographic regions are presented inTable 4(seeTable 1for a list of countries and their corresponding region).
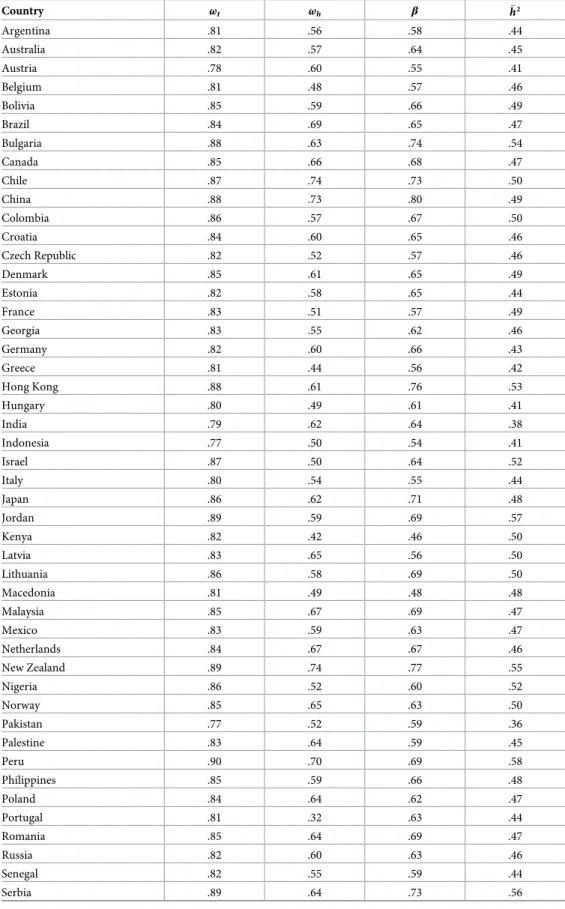
Table 2. Reliability measures of the Subjective Happiness Scale (SHS) by country. Country ωt ωh β h�2 Argentina .83 .06 .82 .56 Australia .89 .83 .83 .68 Austria .86 .83 .83 .63 Belgium .93 .91 .91 .78 Bolivia .87 .00 .86 .63 Brazil .86 .83 .83 .61 Bulgaria .92 .82 .83 .77 Canada .89 .87 .87 .69 Chile .89 .86 .86 .68 China .83 .04 .78 .57 Colombia .77 .38 .66 .50 Croatia .91 .86 .86 .73 Czech Republic .90 .84 .84 .71 Denmark .91 .88 .88 .73 Estonia .88 .00 .87 .65 France .89 .79 .79 .70 Georgia .80 .78 .73 .53 Germany .91 .87 .86 .72 Greece .85 .82 .81 .60 Hong Kong .82 .80 .74 .56 Hungary .86 .82 .82 .62 India .65 .62 .60 .35 Indonesia .74 .30 .34 .54 Israel .76 .07 .70 .50 Italy .86 .83 .82 .62 Japan .84 .79 .75 .60 Jordan .75 .72 .64 .49 Kenya .72 .01 .66 .43 Latvia .92 .84 .84 .76 Lithuania .89 .33 .85 .69 Macedonia .84 .77 .77 .60 Malaysia .71 .01 .59 .44 Mexico .78 .01 .72 .49 Netherlands .92 .88 .87 .76 New Zealand .86 .01 .83 .62 Nigeria .74 .48 .58 .48 Norway .89 .85 .85 .68 Pakistan .68 .37 .39 .48 Palestine .70 .01 .58 .42 Peru .90 .88 .88 .71 Philippines .83 .08 .79 .57 Poland .90 .86 .85 .70 Portugal .88 .79 .79 .67 Romania .86 .30 .79 .64 Russia .87 .85 .85 .64 Senegal .59 .54 .46 .31 Serbia .89 .79 .81 .69 (Continued )
Total common variance (ωt). We first estimated the total reliability of the happiness
mea-sures using McDonald’s [45] omega total (ωt). This metric is similar to Cronbach’s alpha, and
can be interpreted along the same scale, but provides a better estimate of reliability [39]. Both the SHS and the IHS had identical average total common variance across countries (ωt Mean=
.84). For the SHS, only four countries hadωt< .70: Senegal (ωt= .59), India (ωt= .65),
Paki-stan (ωt= .68), and Uganda (ωt= .69). The countries with the highest SHS total common
vari-ance were the United Kingdom (ωt= .94) and Belgium (ωt= .93). Overall, countries in Africa
had the lowest total variance (ωt Mean= .72) while Western Europe had the highest (ωt Mean=
.90). For the IHS, none of the countries had a total common variance scoreωt< .70. The
coun-tries with the lowest total common variance were Uganda (ωt= .74) and Indonesia (ωt= .77)
while the highest proportion was in Peru (ωt= .90). Similar to the SHS, the lowest total
com-mon variance for the IHS was found in African countries (ωt Mean= .81) but the highest
pro-portions were in East Asian countries (ωt Mean= .87). While the total reliability for both
happiness measures were lowest in African countries, the average was higher for the IHSωt (Mean= .81) than the SHS (ωt Mean= .72).
General factor saturation (ωh). Next, we estimated the proportion of the variance in the
observed happiness scores that can be attributed to the general latent factor. The general factor saturation of the test was calculated using McDonald’s [45] omega hierarchical (ωh) coefficient.
Omega hierarchical is a useful test for assessing the homogeneity of a measure. A low score would indicate that the observed scores are not accurate predictors of the latent score and the variability in the items may be due to other factors [39]. Omega hierarchical is useful because, unlike omega total, the reliability estimates are not a function of test length. This is particularly important when comparing the reliability of two measures with unequal numbers of items, as Table 2. (Continued) Country ωt ωh β h�2 Singapore .89 .85 .83 .68 Slovakia .86 .78 .81 .63 Slovenia .87 .83 .83 .64 South Africa .88 .86 .85 .66 South Korea .91 .84 .86 .72 Spain .89 .84 .84 .68 Sweden .91 .89 .89 .73 Switzerland .87 .83 .83 .64 Taiwan .88 .02 .86 .67 Thailand .89 .02 .86 .67 Turkey .87 .84 .83 .64 Uganda .69 .20 .20 .49 Ukraine .82 .42 .75 .57 United Kingdom .94 .86 .88 .80 United States .87 .84 .82 .64 Vietnam .74 .04 .65 .46 Average .84 .59 .77 .62 SD .08 .34 .14 .11
Note. ωt= total common variance,ωh= general factor saturation,β = smallest split half reliability, �h2= average
communality score.
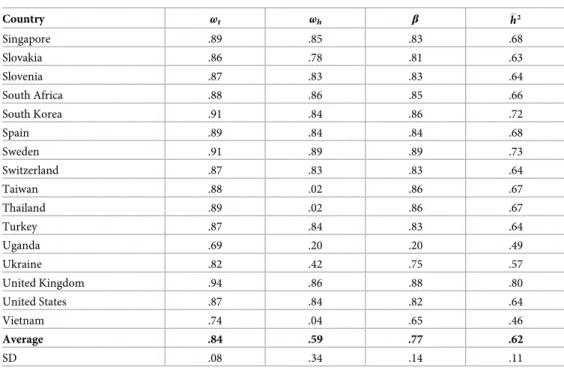
Table 3. Reliability measures of the Interdependent Happiness Scale (IHS) by country. Country ωt ωh β h�2 Argentina .81 .56 .58 .44 Australia .82 .57 .64 .45 Austria .78 .60 .55 .41 Belgium .81 .48 .57 .46 Bolivia .85 .59 .66 .49 Brazil .84 .69 .65 .47 Bulgaria .88 .63 .74 .54 Canada .85 .66 .68 .47 Chile .87 .74 .73 .50 China .88 .73 .80 .49 Colombia .86 .57 .67 .50 Croatia .84 .60 .65 .46 Czech Republic .82 .52 .57 .46 Denmark .85 .61 .65 .49 Estonia .82 .58 .65 .44 France .83 .51 .57 .49 Georgia .83 .55 .62 .46 Germany .82 .60 .66 .43 Greece .81 .44 .56 .42 Hong Kong .88 .61 .76 .53 Hungary .80 .49 .61 .41 India .79 .62 .64 .38 Indonesia .77 .50 .54 .41 Israel .87 .50 .64 .52 Italy .80 .54 .55 .44 Japan .86 .62 .71 .48 Jordan .89 .59 .69 .57 Kenya .82 .42 .46 .50 Latvia .83 .65 .56 .50 Lithuania .86 .58 .69 .50 Macedonia .81 .49 .48 .48 Malaysia .85 .67 .69 .47 Mexico .83 .59 .63 .47 Netherlands .84 .67 .67 .46 New Zealand .89 .74 .77 .55 Nigeria .86 .52 .60 .52 Norway .85 .65 .63 .50 Pakistan .77 .52 .59 .36 Palestine .83 .64 .59 .45 Peru .90 .70 .69 .58 Philippines .85 .59 .66 .48 Poland .84 .64 .62 .47 Portugal .81 .32 .63 .44 Romania .85 .64 .69 .47 Russia .82 .60 .63 .46 Senegal .82 .55 .59 .44 Serbia .89 .64 .73 .56 (Continued )
is the case for the two measures of happiness. Both the SHS (ωhMean= .59) and IHS (ωhMean=
.60) average coefficients were very similar, however the SHS (ωhSD= .34) varied considerably
more than the IHS (ωhSD= .08). The countries with the lowest SHS general factor saturation
coefficients were Bolivia (ωh= .002) and Estonia (ωh= .003) while the countries with the
high-est SHS general factor saturation were Belgium (ωh= .91) and Sweden (ωh= .89). The region
with the highest average SHS general factor saturation was Western Europe (ωhMean= .85)
while the lowest scores were found in South Asian countries (ωhMean= .29). For the IHS, the
countries with the lowest general factor saturation were Portugal (ωh= .32) and Uganda (ωh=
41) while the highest countries were Thailand (ωh= .81) and Taiwan (ωh= .77). The region
with the highest average IHS general factor saturation was East Asia (ωhMean= .70) while
Afri-can countries had the lowest average (ωhMean= .51).
Smallest split half reliability (β). Another assessment of the homogeneity of a test is the
smallest split half reliability of the test, calculated from all possible splits of the items for each happiness measure The smallest split half reliability is similar to an alpha orωt, as it is an
esti-mate of the total reliable variance. However, similar toωh, it is not influenced by test length,
and thus useful for comparing measures with unequal items. For interpreting results, aβ around .50 would indicate that about half of test reflects one general factor of happiness [39]. The SHS had the highest averaged smallest split half reliability (βMean= .77) than the IHS
(βMean= .64). The worst lowest split half reliability for the SHS was in Uganda (β = .20),
fol-lowed by Indonesia (β = .34) and Pakistan (β = .39). The best lowest split half reliability scores for the SHS were in Belgium (β = .91) and Sweden (β = .89). Overall, for SHS, the worst lowest split half reliabilities were in African countries (βMean= .55) while the best lowest split half reli-abilities were in Western European countries (βMean= .85) and Western English-speaking
countries (βMean= 84). For the IHS, the worst lowest split half reliability was in Kenya (β = .46)
Table 3. (Continued) Country ωt ωh β h�2 Singapore .85 .62 .69 .47 Slovakia .89 .70 .75 .54 Slovenia .83 .58 .63 .44 South Africa .84 .64 .64 .46 South Korea .89 .75 .79 .55 Spain .84 .66 .71 .46 Sweden .89 .63 .68 .57 Switzerland .82 .56 .61 .44 Taiwan .85 .77 .67 .48 Thailand .89 .81 .76 .57 Turkey .83 .63 .63 .44 Uganda .74 .41 .47 .37 Ukraine .80 .54 .56 .43 United Kingdom .85 .65 .72 .46 United States .84 .68 .69 .44 Vietnam .84 .65 .69 .47 Average .84 .60 .64 .47 SD .03 .09 .07 .05
Note. ωt= total common variance,ωh= general factor saturation,β = smallest split half reliability, �h2= average
communality score.
followed by Uganda (β = .47) while the best lowest split half reliability scores were in China (β = .80) and South Korea (β = .79). Similar to the SHS, the worst lowest split half reliability scores for the IHS were in African countries (βMean= .55) but the best lowest split half reliability
scores were in East Asian countries (βMean= .75).
Communality scores (�h2). Communality scores are the square of the factor loadings of the
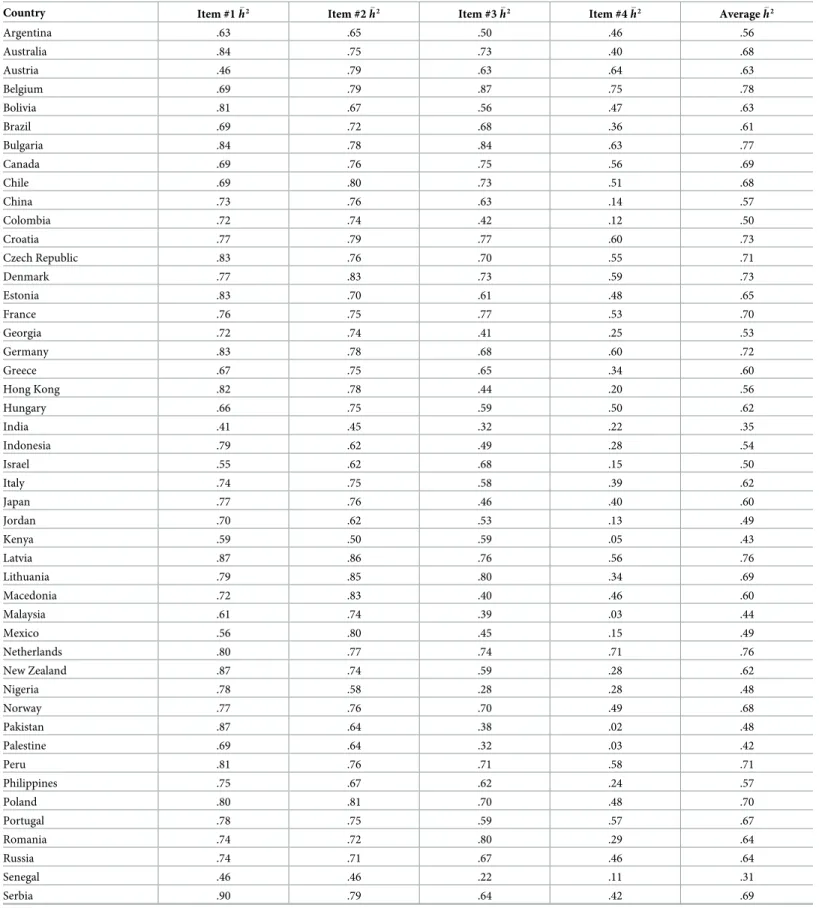
item on the latent trait and represent the percent of variance in the item that can be explained by the latent trait [46]. As communality scores are essentially correlation coefficients, the results can be interpreted similarly [47], with scores of less than .40 suggesting the items may not be strongly related to the latent variable. Tables5and6present the communality scores for the SHS and IHS across countries, respectively. Because the two happiness measures do not have an equal number of items, we also calculated the average communality score for each measure [39], presented inTable 4.
The bottom row ofTable 5presents the average communality score for each item of the Subjective Happiness Scale across countries. The first 3 items of the SHS had high communal-ity scores (ranging from .60 to .70), suggesting a high proportion of their variabilcommunal-ity could be explained by the latent independent happiness variable. However, there was a substantial drop in communality scores for the fourth item on the scale. The communality score for the SHS item #4 was less than .40, suggesting this item may not be as strongly related as the other items. Notably, item #4 is also the only reversed item on the scale–“Some people are generally not very happy. . .To what extent does this characterize you?”. For some countries, such as Kenya, Vietnam, and Pakistan, the communality scores for the first three items were all acceptable while the communality score for item #4 was almost zero. Even in the United States, the coun-try of origin for the measure, the communality score for item #4 might not be considered acceptable. Overall, this suggests this item should be removed to improve the overall reliability of the measure.
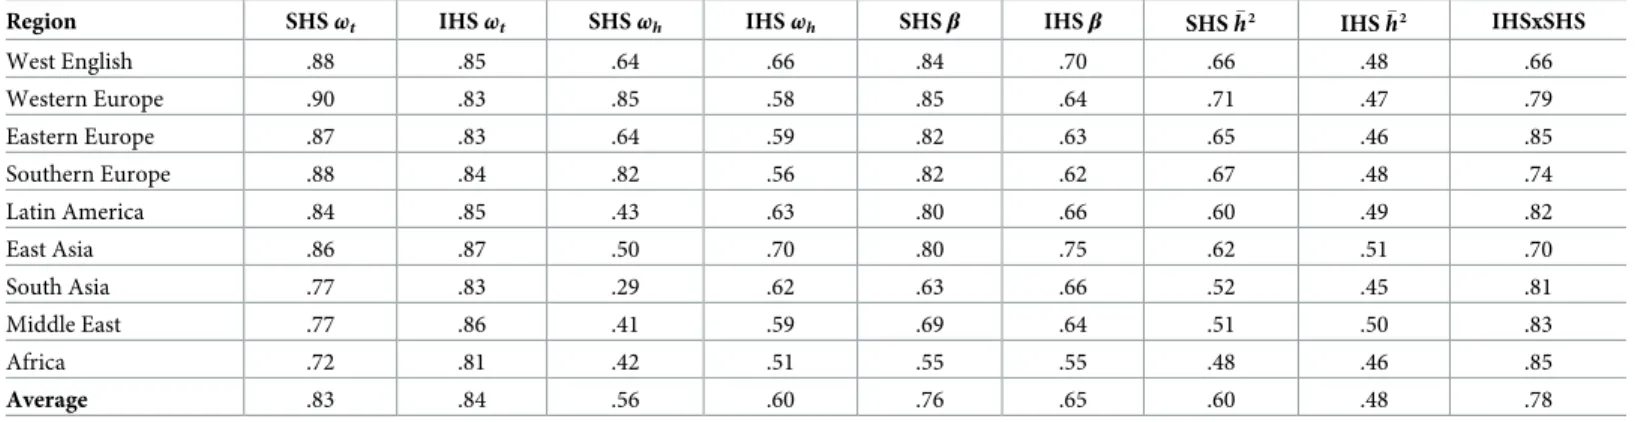
For the Interdependent Happiness Scale, the communality scores for all of the items were much more consistent. Two of the items (#4 & #6) had average communality scores below .40 but were not substantially lower than the other items that ranged from .40 to .60. These two items from the IHS pertain to the quiescence component of the scale, regarding the absence of negative aspects in one’s life. However, while these two items were lowest on average, these items were not consistently low within countries. For example, Austria and Brazil had low (< .30) communality scores for item #4 but extremely high communality scores for #6. How-ever, in Japan, the country of origin for the IHS, the communality score for item #6 was Table 4. Reliability measures for the Subjective Happiness Scale (SHS) and Interdependent Happiness Scale (IHS) averaged by region.
Region SHSωt IHSωt SHSωh IHSωh SHSβ IHSβ SHS �h2 IHS �h2 IHSxSHS
West English .88 .85 .64 .66 .84 .70 .66 .48 .66 Western Europe .90 .83 .85 .58 .85 .64 .71 .47 .79 Eastern Europe .87 .83 .64 .59 .82 .63 .65 .46 .85 Southern Europe .88 .84 .82 .56 .82 .62 .67 .48 .74 Latin America .84 .85 .43 .63 .80 .66 .60 .49 .82 East Asia .86 .87 .50 .70 .80 .75 .62 .51 .70 South Asia .77 .83 .29 .62 .63 .66 .52 .45 .81 Middle East .77 .86 .41 .59 .69 .64 .51 .50 .83 Africa .72 .81 .42 .51 .55 .55 .48 .46 .85 Average .83 .84 .56 .60 .76 .65 .60 .48 .78
Note. ωt= total common variance,ωh= general factor saturation,β = smallest split half reliability, �h2= average communality score.
Table 5. Communality scores (�h2) for the Subjective Happiness Scale (SHS).
Country Item #1 �h2 Item #2 �h2 Item #3 �h2 Item #4 �h2 Average �h2
Argentina .63 .65 .50 .46 .56 Australia .84 .75 .73 .40 .68 Austria .46 .79 .63 .64 .63 Belgium .69 .79 .87 .75 .78 Bolivia .81 .67 .56 .47 .63 Brazil .69 .72 .68 .36 .61 Bulgaria .84 .78 .84 .63 .77 Canada .69 .76 .75 .56 .69 Chile .69 .80 .73 .51 .68 China .73 .76 .63 .14 .57 Colombia .72 .74 .42 .12 .50 Croatia .77 .79 .77 .60 .73 Czech Republic .83 .76 .70 .55 .71 Denmark .77 .83 .73 .59 .73 Estonia .83 .70 .61 .48 .65 France .76 .75 .77 .53 .70 Georgia .72 .74 .41 .25 .53 Germany .83 .78 .68 .60 .72 Greece .67 .75 .65 .34 .60 Hong Kong .82 .78 .44 .20 .56 Hungary .66 .75 .59 .50 .62 India .41 .45 .32 .22 .35 Indonesia .79 .62 .49 .28 .54 Israel .55 .62 .68 .15 .50 Italy .74 .75 .58 .39 .62 Japan .77 .76 .46 .40 .60 Jordan .70 .62 .53 .13 .49 Kenya .59 .50 .59 .05 .43 Latvia .87 .86 .76 .56 .76 Lithuania .79 .85 .80 .34 .69 Macedonia .72 .83 .40 .46 .60 Malaysia .61 .74 .39 .03 .44 Mexico .56 .80 .45 .15 .49 Netherlands .80 .77 .74 .71 .76 New Zealand .87 .74 .59 .28 .62 Nigeria .78 .58 .28 .28 .48 Norway .77 .76 .70 .49 .68 Pakistan .87 .64 .38 .02 .48 Palestine .69 .64 .32 .03 .42 Peru .81 .76 .71 .58 .71 Philippines .75 .67 .62 .24 .57 Poland .80 .81 .70 .48 .70 Portugal .78 .75 .59 .57 .67 Romania .74 .72 .80 .29 .64 Russia .74 .71 .67 .46 .64 Senegal .46 .46 .22 .11 .31 Serbia .90 .79 .64 .42 .69 (Continued )
considerably lower. The item with the highest overall average communality score was #9, “I generally believe that things are going well for me in its own way as they are for others around me,” followed by items #7 and #8. These last three items on the measure pertain to the embeddedness aspect of interdependent happiness.
Each measure’s average communality score was calculated as the average of each item’s communality score within each country and then averaged across countries (seeTable 4). Across all countries, the average communality scores for the SHS (�h2
Mean= .62) were higher
than the average communality scores for the IHS (�h2
Mean= .47). The countries with the lowest
average communality scores for the SHS were Senegal (�h2= .31) and India (�h2= .35), while the
highest scores were in the United Kingdom (�h2= .80) and Belgium (�h2= .78). Overall, the
low-est average communality scores for the SHS were in Africa (�h2
Mean= .48) while the highest
average communality scores were in Western Europe (�h2
Mean= .71). For the IHS, the countries
with the lowest average communality scores were Pakistan (�h2= .36) and Uganda (�h2= .37)
while the highest average communality scores were in Peru (�h2= .58) and Jordan, Sweden, and
Thailand (�h2= .57). Overall, the lowest average communality scores for the IHS were in South
Asia (�h2
Mean= .45) and the best average communality scores were in East Asia (�h 2
Mean= .51).
Relationship between happiness measures. To test for the relationship between the two
happiness measures we used Structural Equation Modeling (SEM) to account for differences in the reliability of the measures. For the Interdependent Happiness Scale (IHS), the 9 items were grouped into 3 corresponding parcels to decrease the total number of parameters esti-mated. There were no missing data and thus no imputation was needed.
Given the range of sample sizes across countries, post hoc power analyses were conducted for estimating the relationship between the two latent variables using thepwrSEM app [48]. Rather than calculate power estimates for all 63 countries, we tested the power to detect an effect given the average observed relationships among variables and then with a combination of the lowest observed relationships among variables. For the first power analysis, we estimated the factor loadings for the 4 item SHS should be .75, given an average reliability of .84. The Table 5. (Continued)
Country Item #1 �h2 Item #2 �h2 Item #3 �h2 Item #4 �h2 Average �h2
Singapore .87 .85 .60 .40 .68 Slovakia .67 .70 .78 .37 .63 Slovenia .79 .77 .52 .48 .64 South Africa .77 .80 .70 .37 .66 South Korea .83 .81 .74 .50 .72 Spain .70 .73 .67 .64 .68 Sweden .80 .82 .75 .54 .73 Switzerland .74 .70 .65 .48 .64 Taiwan .67 .91 .76 .33 .67 Thailand .85 .67 .73 .43 .67 Turkey .74 .75 .61 .47 .64 Uganda .75 .70 .29 .23 .49 Ukraine .78 .72 .55 .22 .57 United Kingdom .85 .88 .78 .70 .80 United States .78 .77 .68 .32 .64 Vietnam .79 .60 .40 .07 .46 Average .74 .73 .61 .39 .62 https://doi.org/10.1371/journal.pone.0242718.t005
Table 6. Communality scores (�h2) for the Subjective Happiness Scale (SHS). Country #1 �h2 #2 �h2 #3 �h2 #4 �h2 #5 �h2 #6 �h2 #7 �h2 #8 �h2 #9 �h2 Avg �h2 Argentina .42 .28 .34 .22 .20 .28 .56 .65 1.00 .44 Australia .29 .48 .81 .21 .68 .15 .57 .37 .51 .45 Austria .35 .17 .22 .08 .40 1.00 .61 .41 .46 .41 Belgium .29 1.00 .36 .16 .13 .26 .30 .64 1.00 .46 Bolivia .83 .40 .39 .32 .32 .37 .59 .71 .48 .49 Brazil .50 .30 .49 .26 .24 1.00 .63 .45 .40 .47 Bulgaria .53 .63 .36 .30 .39 1.00 .59 .59 .49 .54 Canada .33 .67 .38 .35 .45 .30 .57 .40 .82 .47 Chile .48 .30 .43 .35 1.00 .23 .69 .53 .53 .50 China .39 .58 .41 .47 .34 .54 .55 .40 .69 .49 Colombia .58 .22 1.00 .33 .43 .40 .62 .46 .47 .50 Croatia .32 .42 .40 .44 .49 .32 .57 .47 .70 .46 Czech Republic .32 .11 1.00 .16 .61 .29 .51 .42 .73 .46 Denmark .42 .36 .41 .50 .58 .23 .82 .44 .68 .49 Estonia .39 .42 .45 .10 .74 .30 .39 .50 .65 .44 France .39 .34 .33 .24 1.00 .25 .69 .53 .60 .49 Georgia .40 .21 .33 .42 .77 .21 .47 .67 .63 .46 Germany .31 .42 .66 .11 .69 .27 .46 .32 .66 .43 Greece .35 .31 .39 .57 .21 .22 .68 .40 .67 .42 Hong Kong .42 .57 .40 .41 .50 .33 .62 1.00 .52 .53 Hungary .36 .48 .46 .08 .44 .39 .38 .38 .73 .41 India .28 .39 .58 .20 .43 .21 .58 .36 .38 .38 Indonesia .32 .90 .47 .17 .04 .27 1.00 .22 .28 .41 Israel .52 .77 .65 .34 .29 .30 .76 .67 .42 .52 Italy .44 .41 .33 .01 1.00 .14 .61 .48 .52 .44 Japan 1.00 .51 .29 .42 .28 .19 .63 .52 .53 .48 Jordan .54 .54 .61 .51 1.00 .28 .56 .53 .61 .57 Kenya .31 .30 .40 .40 1.00 .39 .56 .54 .56 .50 Latvia .23 .13 1.00 .27 .33 .67 .61 .47 .79 .50 Lithuania .43 .50 .40 .16 1.00 .24 .50 .54 .77 .50 Macedonia 1.01 .07 .09 .84 .22 .14 .52 .64 .80 .48 Malaysia .52 .37 .29 .54 .32 .16 .58 1.00 .44 .47 Mexico .95 .25 .25 .34 .20 .43 .63 .51 .65 .47 Netherlands .45 .35 .71 .18 .50 .17 .72 .49 .55 .46 New Zealand .49 1.00 .16 .26 .35 .59 .77 .63 .72 .55 Nigeria .43 .39 .51 .39 .15 1.00 .60 .60 .57 .52 Norway .27 .87 .32 .27 .59 .24 .68 .61 .62 .50 Pakistan .28 .51 .28 .20 .18 .33 .63 .41 .45 .36 Palestine .47 .23 .50 .39 .44 .23 .40 .56 .80 .45 Peru .73 .40 .54 .40 .54 .46 .76 .74 .63 .58 Philippines .33 .50 .48 .21 .74 .27 .57 .64 .61 .48 Poland .33 1.00 .20 .36 .52 .22 .66 .46 .49 .47 Portugal .37 .48 1.00 .36 .20 .21 .55 .54 .26 .44 Romania .47 .50 .41 .33 .53 .24 .56 .55 .70 .47 Russia .29 .47 .30 .12 1.00 .28 .82 .38 .48 .46 Senegal .35 .39 .33 .37 .22 1.00 .36 .48 .51 .44 Serbia .53 .45 .53 .33 1.00 .20 .58 .62 .80 .56 (Continued )
Table 6. (Continued) Country #1 �h2 #2 �h2 #3 �h2 #4 �h2 #5 �h2 #6 �h2 #7 �h2 #8 �h2 #9 �h2 Avg �h2 Singapore .36 .43 .44 .58 .31 .32 .64 .47 .69 .47 Slovakia .38 .71 .51 .37 .52 .31 .61 .64 .76 .54 Slovenia .47 .69 .06 .34 .46 .22 .55 .56 .62 .44 South Africa .35 .28 .60 .32 .47 .25 .59 .50 .81 .46 South Korea .58 .38 .38 .41 .43 1.00 .64 .59 .54 .55 Spain .46 .33 .36 .24 1.00 .18 .60 .34 .67 .46 Sweden .33 .69 .54 .46 .60 .40 .54 .56 1.00 .57 Switzerland .30 .45 .36 .17 .84 .18 .56 .47 .61 .44 Taiwan .42 .35 1.00 .24 .30 .26 .69 .38 .66 .48 Thailand .35 .90 .30 .44 1.00 .28 .73 .53 .59 .57 Turkey .29 .36 .29 .19 .66 .33 .63 .48 .70 .44 Uganda .50 .36 .11 .33 .59 .13 .38 .68 .27 .37 Ukraine .39 .58 .35 .18 .46 .26 .41 .50 .71 .43 United Kingdom .32 .33 .79 .20 .55 .27 .56 .48 .68 .46 United States .44 .54 .22 .21 .57 .28 .55 .52 .58 .44 Vietnam 1.00 .61 .41 .24 .27 .20 .60 .31 .60 .47 Average .44 .47 .45 .31 .52 .35 .59 .52 .62 .47 https://doi.org/10.1371/journal.pone.0242718.t006
Fig 1. SEM model displaying the correlation between the happiness latent variables.Note. IHS = Interdependent
Happiness Scale. SHS = Subjective Happiness Scale. Model fit statistics: RMSEA = .06, CFI = .98,R2= .63. Estimate
between SHS and IHS:β = .79, b = .31, z = 72.99, p < .001. IHS.1 was an average of the first 3 items on the IHS, IHS.2
was an average of the next 3 items on the IHS, and IHS.3 was an average of the last 3 items on the IHS.
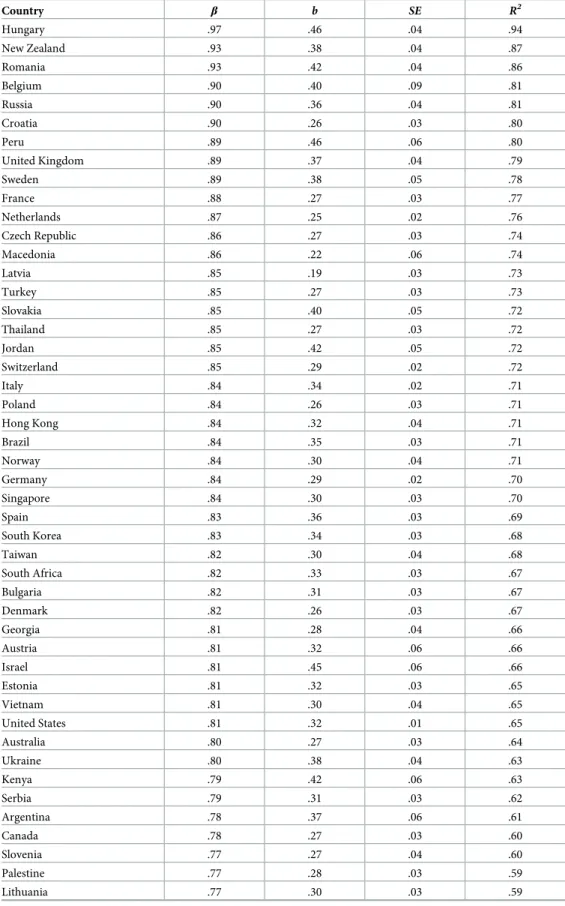
Table 7. Results from structural equation model with IHS ~ SHS. Country β b SE R2 Hungary .97 .46 .04 .94 New Zealand .93 .38 .04 .87 Romania .93 .42 .04 .86 Belgium .90 .40 .09 .81 Russia .90 .36 .04 .81 Croatia .90 .26 .03 .80 Peru .89 .46 .06 .80 United Kingdom .89 .37 .04 .79 Sweden .89 .38 .05 .78 France .88 .27 .03 .77 Netherlands .87 .25 .02 .76 Czech Republic .86 .27 .03 .74 Macedonia .86 .22 .06 .74 Latvia .85 .19 .03 .73 Turkey .85 .27 .03 .73 Slovakia .85 .40 .05 .72 Thailand .85 .27 .03 .72 Jordan .85 .42 .05 .72 Switzerland .85 .29 .02 .72 Italy .84 .34 .02 .71 Poland .84 .26 .03 .71 Hong Kong .84 .32 .04 .71 Brazil .84 .35 .03 .71 Norway .84 .30 .04 .71 Germany .84 .29 .02 .70 Singapore .84 .30 .03 .70 Spain .83 .36 .03 .69 South Korea .83 .34 .03 .68 Taiwan .82 .30 .04 .68 South Africa .82 .33 .03 .67 Bulgaria .82 .31 .03 .67 Denmark .82 .26 .03 .67 Georgia .81 .28 .04 .66 Austria .81 .32 .06 .66 Israel .81 .45 .06 .66 Estonia .81 .32 .03 .65 Vietnam .81 .30 .04 .65 United States .81 .32 .01 .65 Australia .80 .27 .03 .64 Ukraine .80 .38 .04 .63 Kenya .79 .42 .06 .63 Serbia .79 .31 .03 .62 Argentina .78 .37 .06 .61 Canada .78 .27 .03 .60 Slovenia .77 .27 .04 .60 Palestine .77 .28 .03 .59 Lithuania .77 .30 .03 .59 (Continued )
factor loadings for the 3 item IHS with an average reliability of .84 were estimated at .80. The average correlation between the observed SHS and IHS in the data was r = .59, which gives an estimated latent variable correlation of .69. Given these estimated parameters and an average sample size of 246 participants across countries, we estimated the power to detect an effect between the two latent happiness variables to approach 1.
Next, we conducted a power analyses using the lowest observed values, to determine the minimum power we could expect for any of our countries. The lowest reliability of the SHS was .59 (Senegal), so the estimated factor loadings were set to .51. For the IHS, the lowest reli-ability observed was .74 (Uganda), so the estimated factor loadings were set to .70. The smallest observed correlation between the two happiness measures was r = .26 (Indonesia), so using the lowest reliabilities we estimated the lowest correlation between the two latent variables to be .39. Lastly, power was calculated using these parameter estimates with the smallest sample in our data of 54 (Macedonia), resulting in power of .72 to detect an effect between the happiness measures. Given that there would still be reasonable power to detect an effect despite this exact combination of lowest possible parameters not actually appearing in our data, we concluded all of our country’s sample sizes were sufficient for estimating the latent relationship between the SHS and IHS.
A model with the two latent happiness variables was first fitted using all of the data (seeFig 1). The first factor loadings for each measure were fixed to 1 and the SHS was set as the predic-tor variable. Results indicated overall good fit for the model (RMSEA = .06, CFI = .98). Unsur-prisingly, the SHS was significantly related to the IHS,b = .31, β = .79, z = 72.99, p < .001.
Next, the same model was used to calculate the relationship between the SHS and the IHS within each country. Results are presented inTable 7. The countries with the strongest stan-dardized relationship between the SHS and the IHS were Hungary (β = .97), New Zealand and Romania (β = .93). The countries with the weakest standardized relationship between the two happiness measures were Indonesia (β = .31) and Uganda (β = .36). Both Western and Eastern Table 7. (Continued) Country β b SE R2 India .76 .39 .07 .58 Senegal .76 .29 .03 .57 Chile .75 .31 .03 .57 Portugal .75 .19 .03 .56 China .74 .28 .02 .54 Mexico .73 .32 .04 .53 Japan .72 .35 .04 .52 Philippines .70 .29 .03 .48 Malaysia .66 .33 .05 .44 Pakistan .66 .20 .04 .43 Greece .65 .25 .03 .43 Bolivia .62 .32 .05 .38 Colombia .56 .24 .04 .32 Nigeria .56 .20 .04 .31 Uganda .36 .11 .05 .13 Indonesia .31 .06 .03 .09 Average .79 .31 .04 .64
Note. Countries are listed from highest to lowest β.
European countries had the highest average association between the happiness measures (βMean= .85) while the lowest associations were found in African countries (βMean= .66).
Over-all, while the relationship between the two happiness measures varied across countries, the were no countries in which the two measures were unrelated or negatively associated with each other.
Country-level analyses
The second set of analyses were conducted on the country level, using the results presented previously as the input data (Tables2,3&5) as well as country-level data acquired from sources independent from this study (seeS1 Filefor these country level scores). These country level analyses were conducted to help interpret the results previously discussed by attempting to find patterns in the results. This procedure is similar to Multilevel Modeling (MLM) that tests for group (Level 2) predictors of individual (Level 1) relationships. However, given that many of the relationships involve summaries of individuals within countries (e.g., reliability of a measure) rather than individual scores, we could not use the MLM framework for analyses. Fortunately, the large number of countries presented here allow for correlations to be con-ducted on the group level, with a total sample size ranging from 45 to 63 (countries).
Relationship between happiness measure reliabilities. The previous tests of reliability
for the happiness measures resulted in multiple scores of internal consistency for each country and for each measure. We were interested to see if the same countries with good reliabilities for one happiness measure also produced good reliabilities for the other happiness measure. Correlations between the happiness measure reliabilities across countries were conducted for the general factor saturation, total common variance, smallest split-half reliability, and average communality scores for the items (seeTable 8). There was a significant positive correlation between the two happiness measures for the total common variancer(61) = .34, p = .006,
smallest split half reliabilityr(61) = .38, p = .002, and the average communality scores r(61) =
.27,p = .03, but not for the general factor saturation r(61) = -.03, p = .82.
Country-level predictors of happiness measure properties. The last set of analyses
attempted to find predictors of the happiness measure reliabilities and associations. If there are meaningful patterns in the data for the assessment of happiness across countries then these patterns can be predicted from other country-level variables. The first set of predictors were objective country level variables obtained from government sources and include the Human Development Index (HDI), population growth rate, population density, average suicide rate, and average temperature of a country. Full results are shown inFig 2. Across these objective country level variables, the best predictor of happiness measure reliability was HDI, and these Table 8. Correlation between happiness measure reliabilities across countries.
SHS ωh ωt β �h2 IHS ωh -.03 ωt .34 β .38 � h2 .27
Note. N = 63 countries. Correlations significant at the .05 level are bolded.
ωt= total common variance,ωh= general factor saturation,β = smallest split half reliability, �h2= average
communality score.
associations were higher for the SHS than the IHS. HDI was positively correlated with all four of the SHS reliabilities (general factor saturationr(60) = .48, p < .001, total common variance r(60) = .76, p < .001, lowest split half reliability r(60) = .73, p < .001, and average communality
scorer(60) = .70, p < .001). For the IHS, HDI was significantly correlated with two of the
reli-abilities (total common variancer(60) = .27, p = .03, lowest split half reliability r(60) = .33, p =
.009). The population growth rate (rωh(60) = -.32,rωt(60) = -.66,rβ(60) = -.61,r�h2(60) = -.62)
and average temperature (rωh(60) = -.38,rωt(60) = -.59,rβ(60) = -.51,r�h2(60) = -.59) of a
country were negatively related to all of the SHS reliabilities but none of the IHS reliabilities. Suicide rates were unrelated to any of the happiness measure reliabilities. The strongest predic-tor of the correlation between the two happiness measures was a country’s HDIr(60) = .53, p < .001, population growth rate r(60) = -.47, p < .001, and average daily temperature r(60) =
-.35,p = .005.
The correlations for subjective country level variables included a measure of WEIRDness and Schwartz’s values (seeFig 3). Consistent with the objective country level variables, there were many more correlates for the SHS reliabilities than the IHS reliabilities. For exam-ple, a country’s WEIRD score was positively correlated with the SHS general factor saturation
r(43) = .43, p = .003, total common variance r(43) = .57, p < .001, lowest split half reliability r(43) = .64, p < .001, and average communality score r(43) = .51, p < .001 but unrelated to any
of the IHS reliabilities. Additionally, countries with higher SHS reliabilities also scored higher on the values of Affective Autonomy (rωh(57) = .39,rωt(57) = .56,rβ(57) = .49,r�h2(57) = .55),
and Intellectual Autonomy (rωh(57) = .37,rωt(57) = .56,rβ(57) = .55,r�h2(57) = .53) and lower
on the value of Embeddedness (rωh(57) = -.43,rωt(57) = -.66,rβ(57) = -.63,r�h2(57) = -.58).
Consistent with the objective country level correlates, there were substantially far fewer signifi-cant IHS reliability correlations. The only signifisignifi-cant relationship was between the lowest split half IHS reliability and higher levels of valuing Masteryr(57) = .35, p = .007. This cultural
value was unrelated to any of the SHS reliabilities. The strongest predictors of the correlation between the two happiness measures were a country’s WERID scorer(43) = .42, p = .004, and
the values of Intellectualr(43) = .46, p < .001 and Affective Autonomy r(43) = .42, p < .001
and less Embeddednessr(43) = -.47, p < .001.
Fig 2. Country level correlations between objective country level variables and happiness variable reliabilities.
Note. IHS = Interdependent Happiness Scale, SHS = Subjective Happiness Scale, ωt = total common variance, ωh =
general factor saturation,β = smallest split half reliability, h2 = average communality score, HDI = Human Development Index, PopDensity = population density, GrowthRate = population growth rate, SuicideRate = suicide rate, AvgTemp = average daily temperature.
Discussion
Reliability of the independent (SHS) and interdependent (IHS) measures of
happiness
Multiple tests of measurement reliability revealed that, as might be expected, the reliability of each measure of happiness was stronger in regions more culturally similar to the country of the measure’s origin. Specifically, the interdependent measure of happiness had the highest overall reliabilities in East Asian countries, while the independent measure of happiness had the highest reliabilities in Western Europe. Interestingly, the reliabilities of the two measures of happiness were highly similar between the United States and Japan, the two countries in which the SHS and IHS measure were developed, respectively. As can be seen in Tables2and
3, the reliabilities of the measure of independent happiness were only slightly higher in the country of origin (the United States) than in Japan. The same held true for Japan, where the reliabilities of the measures of interdependent happiness were only slightly higher than the reliabilities in the United States. In both countries, the reliabilities of the measure of indepen-dent happiness were higher than the reliabilities of the measure of interdepenindepen-dent happiness, although this difference was less pronounced in Japan. While these subtle differences between the United States and Japan still align with theoretical predictions, differences in the reliabili-ties of the happiness measures become more notable when compared across the remaining 61 countries. For example, the interdependent measure of happiness performed much better than the independent measure of happiness in South Asian countries and the Middle Eastern coun-tries. Additionally, the lowest reliabilities for both happiness measures were found in African countries, suggesting that neither conceptualization of happiness might be particularly well-suited for those cultures.
Additionally, the ranges of reliabilities across countries were different for the two happiness measures. The range of the reliabilities for the independent measure of happiness varied Fig 3. Country level correlations between subjective country level variables and happiness variable reliabilities.
Note. IHS = Interdependent Happiness Scale, SHS = Subjective Happiness Scale, ωt = total common variance, ωh =
general factor saturation,β = smallest split half reliability, h2 = average communality score. WEIRD scores originally from Muthukrishna et al. [37], values scores originally from Schwartz [38].
drastically while the range of reliabilities for the interdependent measure of happiness were much smaller. This discrepancy appeared despite the comparable overall averages in reliabili-ties across countries, with the SHS performing slightly better than the IHS overall. Thus, while the SHS has some of the highest reliabilities in certain countries (generally WEIRD ones), it also had some of the lowest reliabilities in other countries (generally non-WEIRD ones), while the reliabilities of the IHS varied less. Higher reliabilities of measures are generally considered better; however, for cross-cultural researchers interested in comparing measures across coun-tries, the equivalence of a measure’s reliability maybe more important than its size, as varia-tions in reliability can artificially inflate or deflate comparisons between countries [49]. Thus, despite the slightly lower overall reliability of the IHS than the SHS, we believe that in most cases the IHS would still be a better cross-cultural instrument.
The reliability of a measure is also a way to assess its coherence or “schema” in a particular culture. Higher reliabilities mean participants are responding to each item on the scale in a manner consistent with the putatively underlying latent trait, in this case happiness. A lower reliability suggests that the latent concept or structure of happiness is not as strong or coherent for that group, or that the items are assessing multiple aspects of happiness that do not map equally well onto the underlying construct. Treating reliabilities as an assessment of a con-struct’s coherence means that we can seek to predict the overall coherence of a measure across countries using other country-level data. It also suggests that it might be a mistake to “correct” the SHS for attenuation within countries where it has low reliability, since this may indicate that the SHS is a less appropriate measure in those countries and any corrections would only mask that fact.
The reliability of the SHS was related to many country-level variables, including economic development and a country’s “WEIRDness.” Specifically, coherence of the independent happi-ness measure was stronger in countries with higher development, less population growth, and in colder climates. Additionally, several cultural values were related to the reliabilities, or coherence, of the SHS. Greater coherence of the independent happiness measure was stronger in countries that value autonomy, both affective and intellectual. These countries value each individual’s uniqueness and, particularly for affective autonomy, “encourage individuals to pursue affectively positive experience for themselves” [53]. Additionally, the reliabilities for the SHS were lower in countries that value embeddedness with others, suggesting less interdepen-dence in general as well as for defining one’s happiness. Thus, it appears that the concept of independent happiness is more coherent in the more developed, autonomous, WEIRD countries.
For interdependent happiness, there were far fewer country-level correlates with the reli-abilities. However, given the more limited range of reliabilities compared to the SHS reliabili-ties as previously discussed, it is perhaps unsurprising that we were not able to find as many country level predictors. The IHS reliabilities were weakly related to a country’s economic development and higher in countries that value mastery over harmony. Interestingly, the reli-ability of the interdependent happiness measure was completely unrelated to a country’s “WEIRDness.” Thus, interdependent happiness may not be a WEIRD (or even non-WEIRD) construct; but rather be more uniformly meaningful across all countries. In that sense IHS may be a more “universal” measure of happiness than the SHS. This finding is consistent with previous work on cross-cultural differences in conceptual definitions of happiness. Delle Fave and colleagues [1] found that the most universal definition of happiness across 12 countries was harmony, a concept more commonly associated with the East Asian view on happiness, rather than the Western view. Thus, these universal lay definitions of happiness may explain why the IHS, developed in East Asia, performed more consistently across cultures than the SHS.
Conceptual overlap between independent (SHS) and interdependent (IHS)
happiness
Further analyses attempted to assess the degree of similarity between the two measures. Over-all, the two measures of happiness were positively related to each other in every country assessed, however the strength of this relationship still varied cross-culturally. Individuals were more likely to associate these two measures of happiness in “WEIRDer” countries, i.e., those most similar to the United States. Additionally, the relationship between the two happiness measures was stronger in countries with more development, less population growth, and where people value more autonomy and less interdependence with others. These correlations are consistent with regional averages found in the data. Specifically, the strongest correlations between the two happiness measures were in European countries while somewhat lower in East Asian and Latin American countries. Interestingly, the lowest correlations between the happiness measures were found in Africa. Given that the African countries also had the lowest reliabilities for both happiness measures this suggests that the two measures may not only be more conceptually distinct in Africa but that neither measure may be fully appropriate for assessing happiness in that cultural context.
The two measures of happiness tested in this article originated from cultures with distinct historical roots and religious traditions [5]. The West has historically been influenced by a self-centered Protestant work ethic that defines happiness as a personal achievement and individu-als as distinct, independent, and responsible for their own fate. In contrast, the Eastern ideolo-gies of Buddhism, Taoism, and Confucianism emphasize the interconnectedness of everyone and everything, prioritizing harmony and balance over individual achievement [5]. Thus, it is perhaps unsurprising that both the American and Japanese measures of happiness performed worse in the regions lacking either Christian Protestant or Buddhist traditions (e.g., Africa and the Middle East) while generalizing better to Latin America, Europe, and the rest of Eastern Asia. The lower performance of both happiness measures in Africa and the Middle East further highlights the need for cross-cultural research to expand beyond the traditional East vs. West dichotomy (often limited even further to comparisons between Japan and the US). While it seems clear that the two measures of happiness presented here miss some aspect crucial to the cultures outside of the Eastern and Western contexts in which the measures were developed, it is less clear what these aspects are. To fill this gap in the literature remains an important next step for researchers interested in developing a universal measure of happiness.
Limitations and future directions
The current study used country as a proxy for culture; however, country boundaries do not always correspond to cultural boundaries. Indeed, cultural boundaries are often extremely dif-ficult to define, as numerous subcultures may exist within dominant cultures [50]. Thus, many researchers simplify or bypass the cultural definition problem by using country as the grouping variable. While using country as a proxy for culture far from a perfect solution, it does allow researchers to more easily compare results across studies. Additionally, it allows researchers to use country-level data, such as HDI, as predictors of individual level outcomes. This method is also of particular relevance to national governments interested in the well-being of their citizens.
Another potential limitation of the present study is the use of members of college commu-nities as the primary source of participants. While data from non-college participants were also collected in a handful of countries, they were excluded from the present analyses to match the samples across countries and avoid confounding the results [51]. Because the vast majority of psychological studies use student participants [52], the results of this study are directly