Contents lists available atScienceDirect
Food Chemistry
journal homepage:www.elsevier.com/locate/foodchem
The effect of harvest times on bioactive properties and fatty acid
compositions of prickly pear (Opuntia ficus-barbarica A. Berger) fruits
Fahad Al Juhaimi
a, Kashif Ghafoor
a,⁎, Nurhan Uslu
b, Isam A. Mohamed Ahmed
a,
Elfadıl E. Babiker
a, Mehmet Musa Özcan
b,⁎, Gbemisola J. Fadimu
aaDepartment of Food Science & Nutrition, College of Food and Agricultural Sciences, King Saud University, Riyadh, Saudi Arabia bDepartment of Food Engineering, Faculty of Agriculture, Selcuk University, 42031 Konya, Turkey
A R T I C L E I N F O Keywords:
Prickly pear pulp Seed oil
Bioactive properties Phenolic compounds
A B S T R A C T
In the study, the impact of harvest time on total phenolic content, antioxidant activity, and phenolic compounds of prickly pear (Opuntia ficus-barbarica A. Berger) fruit pulp and the oil content and fatty acids profile of the seed were investigated. The highest total phenolic content was determined as 156.77 mg/100 g in July 1 harvest, while the maximum antioxidant activity and total oil content were found as 9.81% and 6.80% at the last stage of maturation (15 August), respectively. The highest oleic (28.51%), palmitic (22.61%) and stearic acid contents (9.20%) in seed oil were observed in June 15 harvest. The highest value for linoleic acid (57.50%) was detected in August 15 harvest. Prickly pear is a vital source of bioactive constituents such as phenolic and antioxidant substances in terms of being useful for human health and the optimum harvesting time to retain high quantities of most phenolic compounds is 1st July.
1. Introduction
Prickly pear (Opuntia ficus-barbarica A. Berger) is a typical species of the genus Opuntia classified in the family “Cactaceae”, and it is called frenk fig, spiny fig, corn prickly pears in Turkish (Özcan & Al-Juhaimi, 2011; Özcan & Matthaus, 2017). The first meeting of the Europeans with the genus Opuntia was made in 1892 by Christopher Columbus. Columbus brought these cactus species to Lisbon in 1493. In 1700, Tournefort named Opuntia because of its similarity to a thorny plant growing in the Greek town of Opus. The country, which is the most important prickly pear producer in the world where production is cultivated, is Mexico with 70,000 ha of production area and 300,000 tons of fruit production. In Turkey, it is grown in cities such as Mersin, Antalya, Muğla (Al-Juhaimi & Özcan, 2013; Duru & Turker, 2005). There are 150–300 non-renewable cores in the pulp part of the thick crusted figs. The actual weight (3–7%) of the prickly pear fruit is the core. Mesocarp and pericarp are 36–48% of the fruit and 39–64% of the edible pulp, respectively (Felker, Soulier, Leguizamon, & Ochoa, 2002; Felker et al., 2005). In other words, the parts that can be used as commercial products of the fruit are divided into 3 parts as core, shell and pulp. The exact immature was found in the prickly pear fruit at pH 5.6–6.5 (Felker et al., 2005). Acidity was found between 0.05 and 0.18%. Oil is obtained from the bark and seeds of the fruit. It is used in
many areas as fruit juices, concentrated, coloring food, powder pro-ducts, soft drinks, jam, marmalade, as well as many other foods in the cosmetic sector (Castellar, Obón, Alacid, & Fernández-López, 2003; Stintzing, Schieber, & Carle, 2001; Stintzing, Schieber, & Carle, 2003; Moßhammer, Stintzing, & Carle, 2006a; Carle, Markus, & Stintzing, 2006). Although prickly pear fruits have a high potential in terms of nutrient content, it is limited to studies performed in the laboratory (Stintzing & Carle, 2006). Prickly pear fruits do not have sufficient re-sistance to microbial spoilage. It is especially sensitive to yeasts and mesophilic bacteria. Transformation and preservation processes should be applied as a prerequisite to prevent post-harvest damage. The dry weight of the seeds in the edible portion of the fruit varies between 30 and 40%. These seeds are usually removed for proper use. These waste products constitute important new sources as fat and food (Habibi, Heux, Mahrouz, & Vignon, 2008). Prickly pear is characterized by the high sugar content (12–17%) and low acidity (0.03–0.12%), and con-tains higher vitamin C than apples, pears, grapes and bananas. The total antioxidant activity of the prickly pear was 2-folds greater than that of some fruits such as pear, apple, tomato and grape (Livrea & Tesoriere, 2006). The total antioxidant activities of cactus fruits of different colors, measured by different color determinations, showed a high correlation with each other as well as concentrations of ascorbic acid, betalain and total phenolics (Abdel-Hameed, Nagaty, Salman, & Bazaid,
https://doi.org/10.1016/j.foodchem.2019.125387
Received 3 December 2018; Received in revised form 14 August 2019; Accepted 17 August 2019 ⁎Corresponding authors.
E-mail addresses:[email protected](M.M. Özcan),[email protected](K. Ghafoor).
Available online 19 August 2019
0308-8146/ © 2019 Elsevier Ltd. All rights reserved.
2014; Corral-Aguayo, Yahia, Carrillo-Lopez, & Gonzalez-Aguilar, 2008; Feugang, Konarski, Zou, Stintzing, & Zou, 2006; Kuti, 2004; Ortiz-Laurel & Mendez-Gallegos, 2000; Stintzing et al., 2005). The main aim of this study was to examine the effect of harvest times on antioxidant activity, phenolic compounds and fatty acid compositions of prickly pear (Opuntia ficus-barbarica A. Berger) fruit and seed oils.
2. Material and methods
2.1. Material
In this study, prickly pear (Opuntia ficus-barbarica A. Berger) fruits were harvested at 15 days intervals during 15 June-15 August 2018 from the same tree (30–35 years old) in Dalaman district of Muğla, Turkey (N: 36° 46′ 1″; E: 28° 48′ 0″). The metrological data in the ex-perimental site was as follow: average temperatures; humidity; rainfall; wind speeds; and day light length in June, July and August were 22.2, 26.7 and 26.7 °C; 60.2, 46.1, and 50.7%; 2.4, 0.5, and 0.7 mm; 1.5, 1.9, and 1.6 m/sn; 7.7, 9.5, and 8.2 h/day, respectively. In each harvesting time, 30 prickly fruits were collected, immediately placed in cold re-sistant containers, transferred to the laboratory, and stored at −20 °C until used for analysis. The thorns of the fruit are manually peeled off with a knife. Following this, the pieces of the fruits were cut with a knife at both ends and the fruits were cut to the length of the fruit. The seed portion from the pulp obtained after the shell separation was manually separated. After that, the seeds were dried, and ground. 2.2. Methods
2.2.1. Preparation of the extract
The extraction was carried out by mixing 2 g prickly pear pulp sample with 6 mL of 80% methanol (80: 20, MeOH: H2O, v/v) followed by 10 min sonication. The mixture was then centrifuged for 5 min at 6000×g and these steps (sonication and centrifugation) were repeated twice. Each time, the supernatants were collected, pooled, and then concentrated under vacuum at 37 °C. Thereafter, the volume was raised to 25 mL with deionized water and filtered using 0.45-µm filter mem-brane.
2.2.2. Total polyphenol
The colorimetric method using Folin-Ciocalteu (FC) reagent was performed for quantification of total polyphenol content of prickly pear fruit pulp extracts as described by Yoo, Lee, Park, Lee, and Hwang (2004). In brief, the 1 mL of the extract was vortex mixed with 1 mL of FC for 5 min. Thereafter, 10 mL of Na2CO3was added to the mixture and vortex mixed again, and then deionized water was added to adjust the final volume of the extract to 25 mL. Gallic acid standard (0–200 mg/ml) solution was treated in the same way. The mixtures were left to stand at room temperature for 1 h before measuring the absorbance of the developed color at 750 nm using a UV–VIS spectro-photometer. The results were expressed as mg gallic acid equivalent (GAE)/100 g of fresh weight.
2.2.3. Antioxidant activity
DPPH (1,1-diphenyl-2-picrylhydrazyl) scavenging method was used for the quantification of antioxidant activity of prickly pear fruit extract as described elsewhere (Lee et al., 1998). Briefly, 1 mL DPPH metha-nolic solution was added to the extracts (prepared using methanol as explained inSection 2.2.1), mixed well, and kept at room temperature for 30 min. Thereafter, the absorbance of both extracts and control (blank) were measured at 517 nm in a UV–VIS spectrophotometer and the percentage of inhibition was calculated according to formula given below.
= A control A Extract ×
A control
Inhibition (%) 517 517
517 100
2.2.4. Determination of individual phenolic compounds in prickly pear extracts
The phenolic compounds of prickly pear extracts were detected and quantified using Inertsil ODS-3 (5 µm; 4.6 × 250 mm) column attached to a Shimadzu-HPLC system having a PDA detector. The mobile phase consisted of 0.05% acetic acid in deionized water (buffer A) and acet-onitrile (buffer B). Samples (40 µl) were injected to the injection port and the flow rate and temperature were set as 0.85 mL/min and 30 °C, respectively. A gradient elution profile was used where the concentra-tion of mobile phase B (acetonitrile) was gradually changed (8% for 0–0.1 min; 10% for 0.1–2 min; 30% for 2–27 min 56% B for 27–37 min and 8% for 37–45 min) and each sample was given a total run time of about 60 min. The peaks of phenolic compounds of prickly pear extracts were monitored at 280 and 330 nm and compared with those of ex-ternal authentic standards of phenolic compounds.
2.2.5. Oil content of prickly pear seeds
Ground prickly pear seeds were extracted for 5 h at 50 °C using a soxhlet apparatus and petroleum ether as solvent. After removing the solvent with a rotary evaporator, the oil residue was collected and then kept in a colored vial at −18 °C until analysis (AOAC, 1990). 2.2.6. Fatty acid profile
Oil extracted from the seed of prickly pear was analyzed for fatty acids profile using a Tecnocroma TR-CN100 (60 m × 0.25 mm, film thickness: 0.20 µm) capillary column attached to a Shimadzu GC-2010 gas chromatography system equipped with a flame-ionization detector (FID). Prior to the analysis, oil was esterificated as described in the standard ISO-International Organization for Standardization (1978) esterification method. The fatty acid methyl esters of the samples were identified by comparing their retention time with those of appropriate fatty acids methyl esters standards (Sigma Chemical Co.). The injection port temperature was 250 °C. The column temperature was programed as 120 °C for 5 min, then increased to 240 °C at a rate of 4 °C/min, and finally held at 240 °C for 25 min.
2.3. Statistical analysis
Triplicate analysis was carried out for all parameters of three in-dependent pear sample patches at each harvesting time. The results were statistically analyzed for variance (ANOVA) using JMP version 9.0 and the results were expressed as mean ± standard deviation (MSTAT C) of independent prickly pear fruit and seed samples (Püskülcü & İkiz, 1989).
3. Results and discussion
Total phenolic substances and antioxidant amounts of pulps be-longing to the fruits of prickly pear (Opuntia ficus-barbarica A. Berger) collected at five different times were determined. In addition, the oil contents and fatty acids profile of the seeds were also investigated. The results of total phenolic content and antioxidant activity are shown in Table 1. The total phenolic values in the fruits of the prickly pear were ranged from 90.97 to 156.77 mg GAE/100 g.Yahia and Mondragon-Jacobo (2011)found that total phenolic substance was found between 10 and 130 mg gallic acid/100 g FW in the pulp of prickly pear. Ap-parently, total phenolic contents in the current study are greater than those reported previously for different pears fruits from different countries (Fernández-López, Almela, Obón, & Castellar, 2010; Osorio-Esquivel, Alicia-Ortiz-Moreno, Alvarez, Dorantes-Alvarez, & Giusti, 2011; Yahia & Mondragon-Jacobo, 2011). The variation in phenolic contents between these studies might be attributed to the differences in the genotypes, environmental conditions, post-harvest and handling processes, maturity stages, and phenolic analysis methods and condi-tions. It is well known that phenolic substances in foods vary depending on plant maturity, environmental factors, food processing, storage and
storage time, dissolution processes. The highest phenolic content (156.77 mg GAE/100 g) was found on the 1st of July, followed by that harvested at 15th August (121.61 mg GAE/100 g) and 1st August (119.79 mg GAE/100 g) suggesting that maturation stage and en-vironmental conditions affected the phenolic content of prickly pear fruits. However, the least values of total phenolic content were ob-served on July 15 (90.97 mg GAE/100 g) and June 15 (92.19 mg GAE/ 100 g). The variation in total phenolic contents of prickly fruits har-vested at different times might be due to the variations in environ-mental conditions (temperature, day length, day light, and humidity) as clearly observed in the metrological data of the experimental site. In addition, and chemical changes during maturation processes of the fruits could also lead to the variation in the total phenolics of prickly fruits harvested as different times. The antioxidant activity values of the prickly pear collected at 5 different times varied from 2.55% to 9.81%. The antioxidant value of prickly pear in the study conducted byPiga, Del Caro, Pinna, and Agabbio (2003)ranged between 2.18 and 2.30 mg TEAC/g dry matters. In the current study, an increase in the values of antioxidant was observed when the maturity of the fruit increased. The highest antioxidant content was found to be 9.81% on the 15th of August, which is the last stage of maturation.Boutakiout et al. (2018) studied the impact of different harvesting times on antioxidant capacity and phenolic contents of prickly pear cladode juice and they observed higher phenolic and antioxidant activity in cladodes harvested in Au-gust than in those harvested in January and March. However,Allegra et al. (2015)reported that ripening stages did not affect the polyphenol contents of minimally processed fruit pulp of Opuntia ficus-indica that harvested at two different times (27th August and 16th October). The changes in total polyphenol contents and antioxidant activities in these studies are probably due to the variation in fruit maturity, growing areas, agronomical practices, soil fertility, and environmental and analytical conditions.
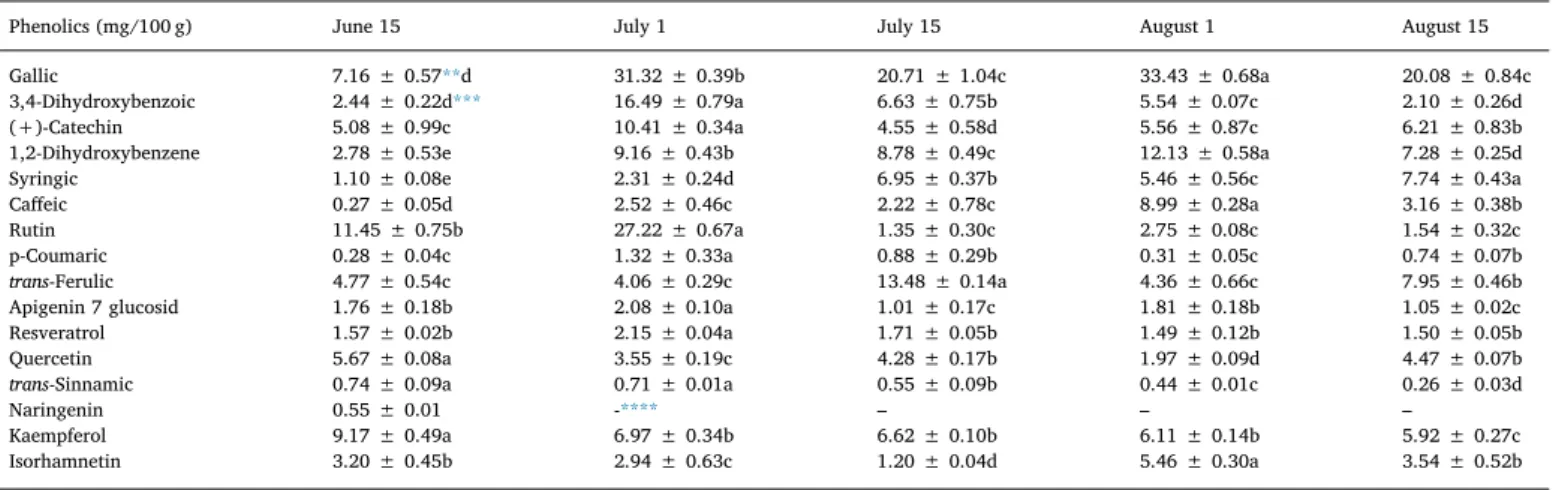
Phenolic components of prickly pear fruits and HPLC chromato-grams are given inTable 2. The dominant phenolic compounds were gallic acid (7.16–33.43 mg/100 g), 3,4-dihydroxybenzoic acid (2.10–16.49 mg/100 g) and rutin (1.35–27.22 mg/100 g). Harvest time significantly affected the phenolic compound values of prickly fruits. While the highest values of gallic acid (33.43 mg/100 g), 1,2-dihy-droxybenzene (12.13 mg/100 g) and caffeic acid (8.99 mg/100 g) were found in the samples harvested on 1st of August, highest amounts of 3,4-dihydroxybenzoic acid (16.49 mg/100 g), (+)-catechin (10.41 mg/ 100 g) and rutin (27.22 mg / 100 g) were observed in the prickly pear harvested on 1st of July. In addition, maximum values of kaempferol (9.17 mg/100 g), trans-ferulic acid (13.48 mg/100 g), and syringic acid (7.74 mg/100 g) were found in the samples harvested on June 15, July 15, and August 15, respectively. Analysis of variance (ANOVA) results revealed significant (p < 0.05) effects of harvesting time (maturity stage) on the values of catechin, apigenin 7-glucoside, quercetin, nar-ingenin, 1,2-dihydroxybenzene, isorhamnetin, and gallic, syringic, caffeic, and p-coumaric acids of prickly pear fruit pulps. In addition, statistically significant differences was not observed among rutin and
resveratrol contents of prickly pear pulp extracts collected on 15th of July, 1st of August, and 15th of August. Additionally, significant dif-ferences were not observed among kaempferol contents of samples collected in 1st of July, 15th of July, and 1st of August. Variation in the phenolic compounds during harvesting time of prickly pear fruits could be due to the differences in the ecological conditions such as day light lengths, temperature, humidity, wind speed, and rainfall. To help plant cope with surrounding environment, phenolic compounds are either metabolized or accumulate at high concentration in plant cells. Studies on the impact of harvesting time (ripening stages) on phenolic com-pounds of prickly pear fruits are limited. However,Herrera-Hernández, Guevara-Lara, Reynoso-Camacho, and Guzmán-Maldonado (2011) ob-served a reduction in quercetin, phenolic acids namely ellagic, gallic, and caffeic acids and an increase in 3,4-dihydroxybenzoic acid during ripening processes of a related species cactus berry (Myrtillocactus geometrizans). The reduction in quercetin during ripening process of cactus berry is similar to our findings as quercetin was high in fruits harvested on June 15 and concomitantly decreased as the harvesting time progressed and reaching its minimum values at 1stAugust and increased again in samples harvested afterward. High content of quer-cetin at the beginning of harvesting time (ripening stage) might be linked to its function in protecting photosynthetic system of unripe fruits. In another study,Wang et al. (2016)reported fluctuated trends for gallic, caffeic and 3,4-dihydroxybenzoic acids during ripening of jujube (Ziziphus jujuba Miller) fruits which are similar to the trends observed for the same phenolic compounds in the present study. However,Stanger, Steffens, Soethe, Moreira, and do Amarante (2017) observed a general reduction in the individual phenolic compounds during the maturation of apple fruits. The variation among these re-ports may be due to the differences in the genetic makeup, growing conditions, agronomical practices, environmental conditions, and ex-perimental and analytical methods. Generally, the phenolic acid profile of prickly pear fruits collected at different harvesting time demon-strated that rutin, 1,2-dihydroxybenzene, kaempferol, and phenolic acids such as 3,4-dihydroxybenzoic, gallic, trans-ferulic acids were re-latively found in higher quantities, whereas, the other phenolic com-pounds namely caffeic, syringic, and p-coumaric acids are existed in lower amounts in prickly pears fruit pulps.
Oil content and fatty acid profile of prickly pear seeds are illustrated inTable 3. The amounts of oil obtained from the samples of the prickly pear seeds were found as 3.09%, 3.22%, 6.77%, 6.00%, and 6.80% for fruits harvested on 15th of June, 1st of July, 15th of July, 1st of August and 15th of August, respectively. The highest oil content was de-termined as 6.80% on 15th of August. Regardless of the harvesting time, the oil content of the seeds of prickly pear fruits in this study was ranged from 3.09 to 6.80%. These results were within the range of 5.0–14.4% for oil from the seeds of prickly pears reported previously (Chougui & Tamendjari, 2013; El Mannoubi, Barrek, Skanji, Casabianca, & Zarrouk, 2009; Matthaus & Özcan, 2011). Regardless of maturation stage, the key fatty acids of the oils extracted from prickly pear seeds harvested at different times were linoleic (0.76–57.50%), oleic (1.97–28.51%) and palmitic (10.65–22.61%) acids (Fig. S1). Si-milarly, other studies on the fatty acid profile of prickly pears pulp and seed from different locations showed linoleic, oleic and palmitic acids are the most dominant fatty acids in prickly pears oil (Belviranlı et al., 2019; Matthaus & Özcan, 2011; Ramadan & Mörsel, 2003). As the maturation progressed, linoleic acid content increased and palmitic acid content decreased. Recent study about the impact of growing lo-cation on prickly pear seeds oil showed significant variation in fatty acids profile among the samples from different locations indicating that the environment has great influence on the fatty acid composition of prickly pear seed oil (Belviranlı et al., 2019). In the current study, the amounts of myristic acid decreased concomitantly as the maturation (harvesting time) of prickly pear fruits progressed. Additionally, lino-lenic, behenic and erucic acid were not detected at early maturity stage (June 15), but they were detected in samples collected on 1stJuly and Table 1
Total phenol and antioxidant activity of prickly pear fruits.*
Harvest times Total phenol (mg GAE/100 g) Antioxidant activity (DPPH inhibition %) June 15 92.19 ± 0.02**d 2.55 ± 0.03de July 1 156.77 ± 0.09a*** 3.27 ± 0.02d July 15 90.97 ± 0.01e 5.00 ± 0.00c August 1 119.79 ± 0.10c 6.83 ± 0.00b August 15 121.61 ± 0.09b 9.81 ± 0.01a *In dry weight basis.
**Mean ± standard deviation.
**Values within each column followed by different letters are significantly different (p < 0.05).
afterward. As maturation progressed, these fatty acids showed gradual reduction. Interestingly, the unsaturation characteristic of the prickly pears seed oil increased concurrently as the maturation of prickly pears progressed due to the increased quantities of linoleic and oleic acids. Essential and polyunsaturated fatty acids namely linoleic and oleic acid of prickly pear seed oils are thought to be important from both nutri-tional and health perspectives (Belviranlı et al., 2019) and thus har-vesting of pear fruits at appropriate maturity stages (July 15–August 15) is recommended. The variation in fatty acids profile of prickly pears seed oil at different harvesting time could be due to the difference in maturity stage where diverse metabolic activities could lead to the decomposition and/or development of oil components. Overall, oil contents and fatty acids profile of prickly pear fruits collected from the same tree at 15 days intervals are varied significantly due to the var-iation in the environmental conditions mainly temperature, humidity, rainfall, wind speed, and day light length during harvesting times. 3.1. Correlation and multivariate analysis
Table 4shows the correlation coefficients between biochemical of prickly pear fruits harvested at different times. Regardless of the har-vesting time, there are numerous correlations between antioxidant, total phenolic, phenolic compounds, and fatty acids of prickly pear fruits pulp and seeds oil. Among antioxidant and phenolic compounds,
highly positive correlation (r2= 0.939, P < 0.01) was observed be-tween (+)-catechin and total phenolic contents suggesting the con-tribution of catechin to the total phenolic contents of prickly pears. Extremely negative correlation (r2= −0.996, P < 0.0001) was ob-served between trans-cinnamic acid and the antioxidant activity (DPPH assay) of prickly pear fruit pulp, which could attributed to the lower ability of trans-cinnamic to reduce DPPH (Scherer & Godoy, 2014). Gallic acid and 3,4-dihydroxybenzoic acid positively correlated (P < 0.01) with 1,2-dihydroxybenzene (r2= 0.945) and resveratrol (r2= 0.952), respectively. Quercetin correlated negatively with gallic acid (r2= −0.934, P < 0.01), 1,2-dihydroxybenzene (r2= −0.953, P < 0.01), and caffeic acid (r2= −0.928, P < 0.05). Naringenin showed positive correlation with kaempferol (r2= 0.948, P < 0.01). Interestingly, there were significant correlations between phenolic compounds, oil and fatty acids of prickly pear fruits and seeds. Positive correlations was observed between gallic acid (r2= 0.965, P < 0.01) and 1,2-dihydroxybenzene (r2= 0.904, P < 0.05) with linolenic acid, and 3,4-dihydroxybenzoic acid with behinic acid (r2= 0.921, P < 0.05). Syringic acids, naringenin, and kaempferol are the major phenolic compounds those shows multiple correlations with fatty acids in prickly pear fruits pulp and seed oils. Syringic acid was positively correlated with oleic (r2= 0.937, P < 0.01), linoleic (r2= 0.891, P < 0.05) and oil (r2= 0.983, P < 0.001) and negatively correlated with palmitic (r2= −0.884, P < 0.05). Naringenin showed extreme Table 2
Phenolic compounds of prickly pear fruits.*
Phenolics (mg/100 g) June 15 July 1 July 15 August 1 August 15
Gallic 7.16 ± 0.57**d 31.32 ± 0.39b 20.71 ± 1.04c 33.43 ± 0.68a 20.08 ± 0.84c
3,4-Dihydroxybenzoic 2.44 ± 0.22d*** 16.49 ± 0.79a 6.63 ± 0.75b 5.54 ± 0.07c 2.10 ± 0.26d
(+)-Catechin 5.08 ± 0.99c 10.41 ± 0.34a 4.55 ± 0.58d 5.56 ± 0.87c 6.21 ± 0.83b
1,2-Dihydroxybenzene 2.78 ± 0.53e 9.16 ± 0.43b 8.78 ± 0.49c 12.13 ± 0.58a 7.28 ± 0.25d
Syringic 1.10 ± 0.08e 2.31 ± 0.24d 6.95 ± 0.37b 5.46 ± 0.56c 7.74 ± 0.43a
Caffeic 0.27 ± 0.05d 2.52 ± 0.46c 2.22 ± 0.78c 8.99 ± 0.28a 3.16 ± 0.38b
Rutin 11.45 ± 0.75b 27.22 ± 0.67a 1.35 ± 0.30c 2.75 ± 0.08c 1.54 ± 0.32c
p-Coumaric 0.28 ± 0.04c 1.32 ± 0.33a 0.88 ± 0.29b 0.31 ± 0.05c 0.74 ± 0.07b
trans-Ferulic 4.77 ± 0.54c 4.06 ± 0.29c 13.48 ± 0.14a 4.36 ± 0.66c 7.95 ± 0.46b
Apigenin 7 glucosid 1.76 ± 0.18b 2.08 ± 0.10a 1.01 ± 0.17c 1.81 ± 0.18b 1.05 ± 0.02c
Resveratrol 1.57 ± 0.02b 2.15 ± 0.04a 1.71 ± 0.05b 1.49 ± 0.12b 1.50 ± 0.05b
Quercetin 5.67 ± 0.08a 3.55 ± 0.19c 4.28 ± 0.17b 1.97 ± 0.09d 4.47 ± 0.07b
trans-Sinnamic 0.74 ± 0.09a 0.71 ± 0.01a 0.55 ± 0.09b 0.44 ± 0.01c 0.26 ± 0.03d
Naringenin 0.55 ± 0.01 -**** – – –
Kaempferol 9.17 ± 0.49a 6.97 ± 0.34b 6.62 ± 0.10b 6.11 ± 0.14b 5.92 ± 0.27c
Isorhamnetin 3.20 ± 0.45b 2.94 ± 0.63c 1.20 ± 0.04d 5.46 ± 0.30a 3.54 ± 0.52b
* On dry weight basis. ** Mean ± standard deviation.
*** Values within each row followed by different letters are significantly different (p < 0.05). **** Non-identified.
Table 3
Oil content and fatty acid composition of prickly pear seeds (%).*
June 15 July 1 July 15 August 1 August 15
Myristic 1.21 ± 1.21**a 0.19 ± 0.00b 0.10 ± 0.00c 0.11 ± 0.01c 0.09 ± 0.00c
Palmitic 22.61 ± 0.00a*** 18.15 ± 0.52b 12.09 ± 0.19c 11.89 ± 0.09 cd 10.65 ± 0.13d
Stearic 9.20 ± 0.18a 5.50 ± 0.06b 4.54 ± 0.01c 3.92 ± 0.01d 4.10 ± 0.01c
Oleic 1.97 ± 0.05e 6.47 ± 0.02d 28.51 ± 0.17a 22.88 ± 0.09b 21.79 ± 0.12c
Arachidic 12.36 ± 0.04a 0.77 ± 0.01b 0.49 ± 0.00b 0.40 ± 0.02b 0.39 ± 0.01b
Arachidonic 0.93 ± 0.01 0.35 ± 0.16 0.25 ± 0.00 0.21 ± 0.03 0.17 ± 0.01
Linoleic 0.76 ± 0.07e 33.2 ± 0.17d 48.29 ± 0.01c 54.76 ± 0.08b 57.50 ± 0.18a
Linolenic –**** 0.69 ± 0.02a 0.45 ± 0.00b 0.60 ± 0.01b 0.40 ± 0.22bc
Behenic – 0.84 ± 0.04a 0.54 ± 0.01b 0.38 ± 0.02c 0.22 ± 0.00d
Erusic – 0.34 ± 0.01a 0.18 ± 0.00b 0.17 ± 0.01bc 0.19 ± 0.00b
Oil content (%) 3.09 ± 0.02b 3.22 ± 0.03b 6.77 ± 0.02a 6.00 ± 0.01a 6.80 ± 0.02a * The percentage of oil content in seed and the percentage of each fatty acid in the oil.
** Mean ± standart deviation.
*** Values within each row followed by different letters are significantly different (p < 0.05). **** Non-identified.
positive correlations with myristic (r2= 0.997, P < 0.0001), stearic (r2= 0.960, P < 0.01), arachidic (r2= 1.00, P < 0.0001) and ara-chidonic (r2= 0.977, P < 0.001) acids, and negative correlations (P < 0.05) with linoleic (r2= −0.915) and linolenic (r2= −0.900) acids. In addition, kaempferol showed significant positive correlations with myristic (r2= 0.966, P < 0.01), palmitic (r2= 0.936, P < 0.01), stearic (r2= 0.993, P < 0.0001), arachidic (r2= 0.956, P < 0.01) and arachidonic (r2= 0.992, P < 0.0001) acids, while it showed ne-gative correlation with linoleic acid (r2= −0.990, P < 0.0001). There are also significant correlations (positive and negative) among the oil and fatty acids of prickly pear seeds. In which, myristic acid exhibited extreme positive correlations with stearic (r2= 0.977, P < 0.001), arachidic (r2= 0.999, P < 0.0001), and arachidonic (r2= 0.990, P < 0.0001) acids, whereas, it showed negative correlation with li-noleic acid (r2= −0.943, P < 0.01). Palmitic acid also correlated positively with stearic (r2= 0.939, P < 0.01) and arachidonic (r2= 0.920, P < 0.05) acids and negatively with oil (r2= −0.946, P < 0.01), oleic (r2= −0.938, P < 0.01) and linoleic (r2= −0.976, P < 0.001) acids. Stearic acid also correlated positively with arachidic (r2= 0.968, P < 0.01) and arachidonic (r2= 0.995, P < 0.0001) acids and negatively with linoleic acid (r2= −0.989, P < 0.001). Oleic acid correlated positively with oil (r2= 0.966, P < 0.01). Ara-chidic acid correlated positively with arachidonic acid (r2= 0.983, P < 0.001) and negatively with linoleic (r2= −0.926, P < 0.05) and linolenic (r2= −0.891, P < 0.05) acids, whereas, arachidonic corre-lated negatively with linoleic acid (r2= −0.979, P < 0.001). Erusic acid correlated positively (P < 0.05) with linolenic (r2= 0.912) and behenic (r2= 0.916) acids
To deeply recognize the interrelationship between biochemical properties and harvesting time, HJ-biplot based on principle component analysis (PCA) was performed, in which, eigenvalues of PC1 and PC2 were compared for traits and harvesting time. The results showed an excellent contribution of PC1 (51.28%) and PC2 (31.11%) to the total variability (82.39%) of the plotted components (Fig. 1). In the biplot, the cosine of the angles between the vector of the biochemical prop-erties indicate the correlation between them, in which, acute (< 90°), obtuse (> 90°) or straight (180°), and right (90°) angles demonstrate positive, negative, and no correlations, respectively (Mutwali, Mustafa, Gorafi, & Mohamed Ahmed, 2016). Clear positive and negative corre-lations were evident between the antioxidant, total phenolics, phenolic compounds, oil, and fatty acids of prickly pear fruits pulp and seeds oil. Regarding the biochemical properties, PC1 had all fatty acids, oil, an-tioxidant activity, and some phenolic compounds namely isorhamnetin, 1,2-dihyroxybenzene, kaempferol, naringenin, quercetin, gallic, caffeic, and trans-cinnamic acids as primary principle components, while PC had total phenolic, (+)-catechin, resveratrol, rutin, apigenin 7 gluco-side, and p-coumaric, trans-ferulic, and 3,4-dihydroxybenzoic acids as primary elements. Hierarchical clustering clearly distinguished three groups of harvesting times according to their influence on the bio-chemical properties of prickly pear fruit pulp and seeds. Early har-vesting (15thJune), mid harvesting (1stJuly), and mid to late harvesting (July 15 to August 15) times. The first cluster (upper left quartile, squire symbol) composed of prickly fruits those harvested at early stage (June 15) and are characterized by higher values of fatty acids namely myristic, stearic, arachidic, arachidonic, and palmitic acids, and some phenolic compounds namely kaempferol, naringenin and quercetin Table 4
Correlation coefficient of antioxidant activity, total phenolic, phenolic compounds, oil and fatty acids of prickly pear (Opuntia ficus-barbarica A. Berger) fruits. Total
phenolic Antioxidantactivity Gallic 3,4-Dihydroxybenzoic 1,2-Dihydroxybenzene Caffeic Syringic Naringenin Kaempferol (+)-Catechin 0.939** 1,2-Dihydroxybenzene 0.945** Resveratrol 0.952** Quercetin −0.934** −0.953** −0.928* Trans-Cinnamic −0.996**** −0.884* Kaempferol 0.948** Myristic 0.997**** 0.966** Palmitic −0.962** 0.936** Stearic 0.960** 0.993**** Oleic 0.937** Arachidic 1.000**** 0.956** Arachidonic 0.977*** 0.992**** Linoleic 0.891* −0.915* −0.990**** Linolenic 0.965** 0.904* −0.900* Behenic 0.921* Erusic Oil 0.983***
Myristic Palmitic Stearic Oleic Arachidic Arachidonic Linolenic Behenic (+)-Catechin 1,2-Dihiydroxybenzene Resveratrol Quercetin Trans-Cinnamic Kaempferol Myristic Palmitic Stearic 0.977*** 0.939** Oleic −0.938** Arachidic 0.999**** 0.968** Arachidonic 0.990**** 0.920* 0.995**** 0.983*** Linoleic −0.943** −0.976*** −0.989*** −0.926* −0.979*** Linolenic −0.891* Behenic Erusic 0.912* 0.916* Oil −0.946** 0.966** *P < 0.05, ** P < 0.01, *** P < 0.001, **** P < 0.0001.
than those harvested at mid or late stages. The second cluster (lower of the graph, circle symbol) contained fruits harvested on July 1 those having greater amounts of total phenolic, (+)-catechin, resveratrol, rutin, apigenin 7 glucoside, and p-coumaric, 3,4-dihydroxybenzoic, behenic, and erusic acids compared to those harvested earlier at 15 June or later at 15 July and afterward. The last cluster (upper right quartile, tringle symbol) contained fruits harvested at 15 July, 1 Au-gust, and 15 August those characterized by higher antioxidant activity, isorhamnetin, 3,4-dihydroxybenzene, oil, oleic, trans-ferulic, caffeic, linoleic, and linolenic acids than those harvested at 15 June and 1 July. Evidently, differences in harvesting time resulted in different bio-chemical compositions of prickly fruits. Hence it is important to harvest prickly pear fruit at appropriate time according to intended use for a desired health benefit (that may be linked with it’s a certain phenolic compound or a fatty acid) when used either in food formulations and natural medicine or consumed directly.
4. Conclusion
This study investigates the influence of harvesting time on the biochemical quality of prickly pear fruits and seeds. Harvesting time (maturity stage) had significant impacts on antioxidant activity, total phenol, phenolic compounds and fatty acid compositions of prickly pear fruit pulps and seed oils. Prickly pear fruits pulp and seed oil harvested at different times contained different quantities of phenolic compounds and fatty acids and their antioxidant activities also varied. Differences in the biochemical qualities of prickly pear fruits pulp and seeds oil could be due to the variation in the environmental conditions such as temperature, rainfall, humidity, day light length and wind speed during harvesting time (15 June–15 August) in addition to var-ious other time dependent biochemical changes within the fruit. Maturity stage of the fruits also affected the biochemical quality of prickly pear fruits. The results presented here are useful to identify the best harvest time for obtaining optimum functional properties of prickly pear fruit and seed.
Declaration of Competing Interest
The authors declare that they have no known competing financial interests or personal relationships that could have appeared to influ-ence the work reported in this paper.
Acknowledgements
The authors extend their appreciation to the Deanship of Scientific Research at King Saud University for funding this work through re-searchgroup no. (RG-1439-016).
Appendix A. Supplementary data
Supplementary data to this article can be found online athttps:// doi.org/10.1016/j.foodchem.2019.125387.
References
Abdel-Hameed, E. S., Nagaty, M. A., Salman, M. S., & Bazaid, S. A. (2014). Phytochemicals, nutritionals and antioxidant properties of two prickly pear cactus cultivars (Opuntia ficus indica Mill.) growing in Taif, KSA. Food Chemistry, 160, 31–38.
Al-Juhaimi, F., & Özcan, M. M. (2013). Determination of some mineral contents of prickly pear (Opuntia ficus-indica L.) seed flours. Environmental Monitoring and Assessment,
185, 3659–3663.
Allegra, A., Sortino, G., Miciletta, G., Riotto, M., Fasciana, T., & Inglese, P. (2015). The influence of harvest period and fruit ripeness at harvest on minimally processed cactus pears (Opuntia ficus-indica L. Mill.) stored under passive atmosphere.
Postharvest Biology and Technology, 104, 57–62.
AOAC (1990). Official Methods of Analysis (15th edn.). Washington, DC: Association of Official Analytical Chemists.
Belviranlı, B., Al-Juhaimi, F., Özcan, M. M., Ghafoor, K., Babiker, E. E., & Alsawmahi, O. N. (2019). Effect of location on some physico-chemical properties of prickly pear (Opuntia ficus-indica L.) fruit and seeds. Journal of Food Processing and Preservation, 43, e13896.
Boutakiout, A., Elothmani, D., Hanine, H., Mahrouz, M., Le Meurlay, D., Hmid, I., & Ennahli, S. (2018). Effects of different harvesting seasons on antioxidant activity and phenolic content of prickly pear cladode juice. Journal of the Saudi Society of
Agricultural Sciences, 17, 471–480.
Carle, R., Markus, R., Moßhammer, & Stintzing, F. C. (2006). Cactus Pear Fruits (Opuntia
Fig. 1. Principle component analysis (PCA) of antioxidant activity, total phenolic, phenolic compounds, oil and fatty acids of prickly pear (Opuntia ficus-barbarica A.
spp.): A Review of Processing Technologies and Current Uses. Germany: Hohenheim
University.
Castellar, M. R., Obón, J. M., Alacid, M., & Fernández-López, J. A. (2003). Color prop-erties and stability of betacyanins from Opuntia fruits. Journal of Agricultural and Food
Chemistry, 51, 2772–2776.
Chougui, N., & Tamendjari, A. (2013). Oil composition and characterisationof phenolic compounds of Opuntia ficus-indica seeds. Food Chemistry, 139, 796–803.
Corral-Aguayo, R., Yahia, E. M., Carrillo-Lopez, A., & Gonzalez-Aguilar, G. (2008). Correlation between some nutritional components and the total antioxidant capacity measured with six different assays in eight horticultural crops. Journal of Agricultural
and Food Chemistry, 56, 10498–10504.
Duru, B., & Turker, N. (2005). Changes in physical properties and chemical composition of
cactus pear (Opuntia ficus-indica) during maturation. University of Mersin J.
PACD22–33.
El Mannoubi, I., Barrek, S., Skanji, T., Casabianca, H., & Zarrouk, H. (2009). Characterization of Opuntia ficus indica seed oil from Tunisia. Chemistry of Natural
Compounds, 45, 616–620.
Felker, P., del C. Rodriguez, S., Casoliba, R. M., Filippini, R., Medina, D., & Zapatae, R. (2005). Comparison of opuntia ficus-indica varieties of Mexican and Argentine origin for fruit yield and quality in Argentina. Journal of Arid Environments, 60, 405–422.
Felker, P., Soulier, C., Leguizamon, G., & Ochoa, J. A. (2002). A comparison of the fruit parameters of 12 Opuntia clones grown in Argentina and the United States. Journal of
Arid Environments, 52, 361–370.
Feugang, J. M., Konarski, P., Zou, D. M., Stintzing, F. C., & Zou, C. P. (2006). Nutritional and medicinal use of Cactus pear (Opuntia spp.) cladodes and fruits. Frontiers in
Bioscience, 11, 2574–2589.
Fernández-López, J. A., Almela, L., Obón, J. M., & Castellar, R. (2010). Determination of antioxidant constituents in cactus pear fruits. Plant Foods for Human Nutrition, 65, 253–259.
Habibi, Y., Heux, L., Mahrouz, M., & Vignon, M. R. (2008). Morphological and structural study of seed pericarp of Opuntia ficus-indica prickly pear fruits. Carbohydrate
Polymers, 72, 102–112.
Herrera-Hernández, M. G., Guevara-Lara, F., Reynoso-Camacho, R., & Guzmán-Maldonado, S. H. (2011). Effects of maturity stage and storage on cactus berry (Myrtillocactus geometrizans) phenolics, vitamin C, betalains and their antioxidant properties. Food Chemistry, 129, 1744–1750.
ISO-International Organization for Standardization, (1978). Animal and vegetable fats and oils preparation of methyl esters of fatty acids, ISO, Geneve, Method ISO 5509, pp. 1–6.
Kuti, J. O. (2004). Antioxidant compounds from four Opuntia cactus pear fruit varieties.
Food Chemistry, 85, 527–533.
Lee, S. K., Mbwambo, Z. H., Chung, H. S., Luyengi, L., Games, E. J. C., & Mehta, R. G. (1998). Evaluation of the antioxidant potential of natural products. Combinational
Chemistry and High Throughput Screening, 1, 35–46.
Livrea, M. A., & Tesoriere, L. (2006). Health benefits and bioactive components of fruits from Opuntia ficus-indica [L.] Mill. Journal of the Professional Association for Cactus
Development, 73.
Matthaus, B., & Özcan, M. M. (2011). Habitat effects on yield, fatty acid composition and tocopherol contents of prickly pear (Opuntia ficus-indica L.)seed oils. Scientia
Horticulturae, 131, 95–98.
Moßhammer, M. R., Stintzing, F. C., & Carle, R. (2006a). Evaluation of different methods
for the production of juice concentrates and fruit powders from cactus pear.
Innovative Food Science and Emerging Technologies in press.
Mutwali, N. I. A., Mustafa, A. I., Gorafi, Y. S. A., & Mohamed Ahmed, I. A. (2016). Effect of environment and genotypes on the physicochemical quality of the grains of newly developed wheat inbred lines. Food Science & Nutrition, 4(4), 508–520.
Osorio-Esquivel, O., Alicia-Ortiz-Moreno, Alvarez, V. B., Dorantes-Alvarez, L., & Giusti, M. M. (2011). Phenolics, betacyanins and antioxidant activity in Opuntia joconostle fruits. Food Research International, 44, 2160–2168.
Ortiz-Laurel, H., & Mendez-Gallegos, S. J. (2000). Production of melcocha and queso de tuna from cactus pear fruit in the centre of Mexico. Food Chain, 26, 20–21.
Özcan, M. M., & Al-Juhaimi, F. (2011). Nutritive value and chemical composition of prickly pear seeds (Opuntia ficus indica L.) growing in Turkey. International Journal of
Food Sciences and Nutrition, 62(5), 533–536.
Özcan, M.M., Matthaus, B. (2017). A review:Composition, use and bioactive properties of prickly pear (Opuntia ficus-indica L. Mill.) fruit and seeds. Z Arznei- Gewurzpfla 22 (4): 177–180.
Piga, A., Del Caro, A., Pinna, I., & Agabbio, M. (2003). Changes in ascorbic acid, poly-phenol content and antioxidant activity in minimally processed cactus pear fruits.
Lebensmittel-Wissenschaft und -Technologie, 36, 257–262.
Püskülcü, H., & İkiz, F. (1989). Introduction to Statistic. Bornova. İzmir, Turkey: Bilgehan Press333 (in Turkish).
Ramadan, M. F., & Mörsel, J. T. (2003). Recovered lipids from prickly pear [Opuntia
ficus-indica (L.) Mill] peel: A good source of polyunsaturated fatty acids, natural
anti-oxidant vitamins and sterols. Food Chemistry, 83, 447–456.
Scherer, R., & Godoy, H. T. (2014). Effects of extraction methods of phenolic compounds from Xanthium strumarium L. and their antioxidant activity. Revista Brasileira de
Plantas Medicinais Campinas, 16(1), 41–46.
Stanger, M. C., Steffens, C. A., Soethe, C., Moreira, M. A., & do Amarante, C. V. T. (2017). Phenolic content and antioxidant activity during the development of ‘Brookfield’ and ‘Mishima’ apples. Journal of Agricultural and Food Chemistry, 65, 3453–3459.
Stintzing, F. C., Schieber, A., & Carle, R. (2001). Phytochemical and nutritional sig-nificance of cactus pear. European Food Research and Technology, 212, 396–407.
Stintzing, F. C., Schieber, A., & Carle, R. (2003). Evaluation of colour properties and chemical quality parameters of cactus juices. European Food Research and Technology,
216, 303–311.
Stintzing, F. C., & Carle, R. (2006). Cactus fruits – more than colour. Fruit Processing, 16, 166–171.
Stintzing, F. C., Herbach, K. M., Mosshammer, Carle, R., Yi, W. G., & Sellapan, S. (2005). Color betalain pattern and antioxidant properties of cactus pear. Journal of
Agricultural and Food Chemistry, 53, 442–451.
Wang, B., Huang, Q., Venkitasamy, C., Chai, H., Gao, H., Cheng, N., ... Pan, Z. (2016). Changes in phenolic compounds and their antioxidant capacities in jujube (Ziziphus
jujuba Miller) during three edible maturity stages. LWT - Food Science and Technology, 66, 56–62.
Yahia, E. M., & Mondragon-Jacobo, C. (2011). Nutritional components and anti-oxidant capacity of ten cultivars and lines of cactus pear fruit (Opuntia spp.). Food Research
International, 44, 2311–2318.
Yoo, K. M., Lee, K. W., Park, J. B., Lee, H. J., & Hwang, I. K. (2004). Variation in major antioxidants and total antioxidant activity of Yuzu (Citrus junos Sieb ex Tanaka) during maturation and between cultivars. Journal of Agricultural and Food Chemistry,