KADİR HAS UNIVERSITY
GRADUATE SCHOOL OF SCIENCE AND ENGINEERING
LOCATION AND DISTRIBUTION DECISIONS IN AN EARTHQUAKE
RELIEF NETWORK
Master Thesis
Zeren D. Yenice
Ze re n D. Ye nic e M.S . The sis 20 15 S tudent’ s F ull Na me P h.D. (or M.S . or M.A .) The sis 20 11
LOCATION AND DISTRIBUTION DECISIONS IN AN
EARTHQUAKE RELIEF NETWORK
Zeren D. YENİCE
Submitted to the Graduate School of Science and Engineering in partial fulfillment of the requirements for the degree of
Master of Science in
Industrial Engineering
KADİR HAS UNIVERSITY June, 2015
i
LOCATION AND DISTRIBUTION DECISIONS IN AN
EARTHQUAKE RELIEF NETWORK
Abstract
In this thesis, a multi-objective mathematical model was developed in order to configure part of the earthquake relief network in Istanbul, Turkey. The aim of the mathematical model was to help decision makers decide on the locations of storage areas for relief aids as well as distribution of relief aids from these areas to temporary shelter areas while minimizing expected total distribution distance, expected total earthquake damage risk factor of storage areas and expected total unsatisfied demand penalty cost. In the model, demands of the population, coverage restrictions, and storage area capacity restrictions were taken into consideration. The data related to the potential storage areas and shelter locations were obtained from Kadıköy municipality and İstanbul metropolitan municipality (IMM). The earthquake damage risk was determined based on possible earthquake scenarios given in Japan International Cooperation Agency’s (JICA) report. The mathematical model was implemented in a pilot area, Kadiköy, and sample efficient solutions were obtained in order to prepare inventory and distribution plan.
Key words: Stochastic, Multi objective, Mixed Integer Programming, Location and Distribution, Optimization, Emergency Response, Earthquake.
ii
LOCATION AND DISTRIBUTION DECISIONS IN AN
EARTHQUAKE RELIEF NETWORK
Özet
Bu tez çalışmasında, İstanbul’da beklenen depremin afet yardım ağını yapılandırmak amacı ile birden fazla amaç fonksiyonuna sahip matematiksel model geliştirildi. Matematiksel modelin amacı, afet çadırlarının depolanacağı yerleri ve bu depolardan geçici toplanma yerlerine dağıtımı belirleyecek karar mercilerine yardımcı olmak ve bunu yaparken toplam dağıtım mesafesini, depolama alanlarının toplam risk faktörünü ve toplam ceza maliyetini en iyilemek. Modelde, nüfusun ihtiyaç duyacağı çadır miktarları, kapsama kısıtları ve depo alanlarının kapasiteleri göz önünde bulunduruldu. Potansiyel depo alanları ve toplanma alanları ile ilgili veriler, Kadıköy Belediyesi ve İstanbul Büyük Şehir Belediyesinden alınmıştır. Beklenen depremin hasar riskleri, JICA raporunda belirlenen olası deprem senaryoları üzerinden belirlenmiştir. Geliştirilen matematiksel model Kadıköy bölgesinde uygulanmıştır ve elde edilen çözümler sonucunda bu bölge için depolama ve dağıtım planı oluşturulmasına olanak sağlanmıştır.
Anahtar Kelimeler: Stokastik, Çoklu Amaç Fonksiyonu, Karışık Tamsayılı Programlama, Lokasyon ve Dağıtım, Optimizasyon, Acil Müdahale, Deprem.
iii
Acknowledgments
First of all I would like to offer my thanks to all the people who have supported and motivated me during my research. I give my best regards to my thesis advisor Assoc. Prof. Dr. Funda Samanlıoğlu. She always shows me right ways to reach success in my research.
People who helped me in IBB by providing information and data also deserve my thanks. Their knowledge was very important for progress of my thesis.
I would like to express my deepest gratitude to my soul mate Dilan Özkoçak and to my cats. They are my family who always support me to complete my research. Without their love and encouragement, reaching this point could be very hard.
I also want to thank my parents, they have never doubted me during my education life and they always believed in me. They have given me the strength that I need to complete this research.
iv
Table of Contents
Abstract ... i Özet ... ii Acknowledgments ... iii List of Tables ... vList of Figures ... vii
List of Abbreviations ... viii
Chapter 1 Introduction ... 1
Chapter 2 Literature Review ... 4
2.1 Location and Distribution Decisions with Deterministic Models ... 4
2.2 LDD with Stochastic and/or Multi-objective Models ... 6
2.2.1 General Industry Applications ... 6
2.2.2 Health Care Applications ... 8
2.2.3 Emergency Management Applications ... 9
Chapter 3 Problem Definition & Model Development ... 17
3.1 Historical Data of Istanbul Earthquakes ... 17
3.2 The JICA Report ... 20
3.3 Description of The Problem ... 28
3.4 The Developed Mathematical Model ... 31
Chapter 4 Solution Approach ... 36
4.1 Normalized Weighted Sum (Weighting) Method ... 36
4.2 Calculation of Ideal and Nadir Points ... 39
Chapter 5 Application and Results ... 40
5.1 Application Area ... 40
5.2 Data and Input file generation ... 40
5.2.1 Temporary Shelter Area Data ... 41
5.2.2 Storage Area Data ... 42
5.2.2.1 Risk Factor Generation ... 43
5.2.2.2 Capacities of Storage Areas ... 44
5.2.3 Penalty Cost Determination ... 52
5.2.4 Distance Matrix ... 53
5.3 Results ... 55
5.3.1 Calculation of Ideal Points, Nadir Points and Ranges ... 55
5.3.2 Sample Efficient Solutions of Mathematical Model (15) ... 57
5.3.3 Example Inventory and Distribution Plan ... 61
Chapter 6 Conclusions ... 66
References ... 67
v
List of Tables
Table 3.1: Number of deaths during the 1999 earthquake ... 17
Table 3.2: Number of damaged buildings during the 1999 earthquake ... 18
Table 3.3: Historical earthquake data of Istanbul ... 19
Table 3.4: Possible Event Scenarios for Mathematical Model ... 23
Table 4.1 Well dispersed 16 weight vectors ... 39
Table 5.1: Data of Temporary Shelter Areas ... 42
Table 5.2: Risk factors of neighborhoods for Scenario A ... 46
Table 5.3: Risk factors of neighborhoods for Scenario C ... 48
Table 5.4: Risk factors and capacities of storage areas ... 49-52 Table 5.5: Penalty cost of temporary shelter areas ... 53
Table 5.6: Distance matrix between storage areas and temporary shelter areas ... 54-55 Table 5.7 Ideal, Nadir point and Range point for scenario 1 ... 56
Table 5.8 Ideal, Nadir point and Range point for scenario 2 ... 56
Table 5.9 Ideal, Nadir point and Range point for scenario 3 ... 56
Table 5.10 Ideal, Nadir point and Range point for scenario 4 ... 56
Table 5.11 16 sample efficient solution from Pareto space for scenario 1 ... 57
Table 5.12 16 sample efficient solution from Pareto space for scenario 2 ... 58
Table 5.13 16 sample efficient solution from Pareto space for scenario 3 ... 59
Table 5.14 16 sample efficient solution from Pareto space for scenario 4 ... 60
Table 5.15 Solution output of scip solver for 10th solution of scenario 3 ... 62
Table 5.16 Expected distribution plan of 10th solution of scenario 3 if model A occurs (Xnj1) ... 63
vi
Table 5.17 Expected distribution plan of 10th solution of scenario 3 if model C occurs (Xnj2) ... 63 Table 5.18 CPU times in seconds for each solution ... 65
vii
List of Figures
Figure 2.1: Operations of disaster management ... 10
Figure 2.2: Stages of disaster operations management and distribution of research contribution ... 11
Figure 3.1: Fault lines of the expected earthquake models ... 22
Figure 3.2: Number of heavily damaged buildings in Model A ... 24
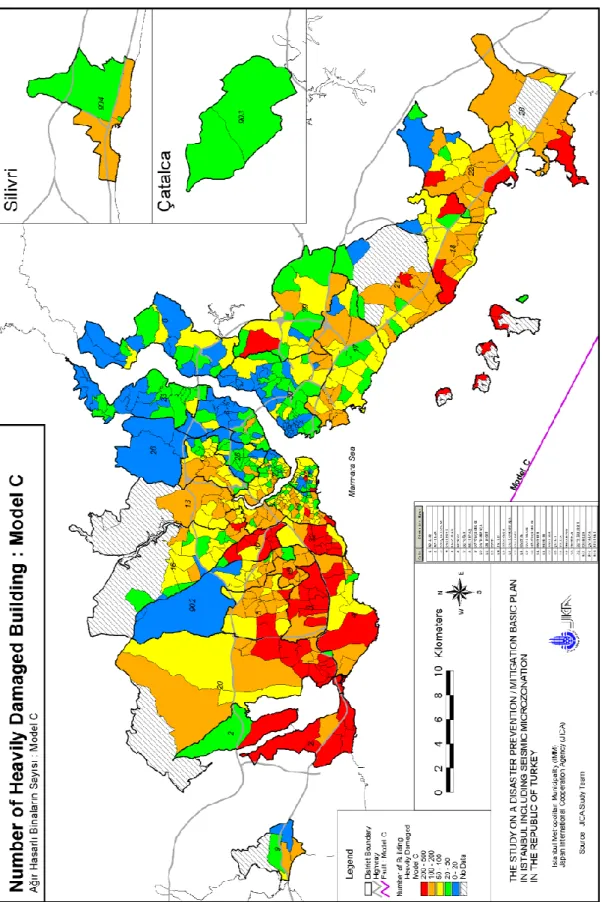
Figure 3.3: Number of heavily damaged buildings in Model C ... 25
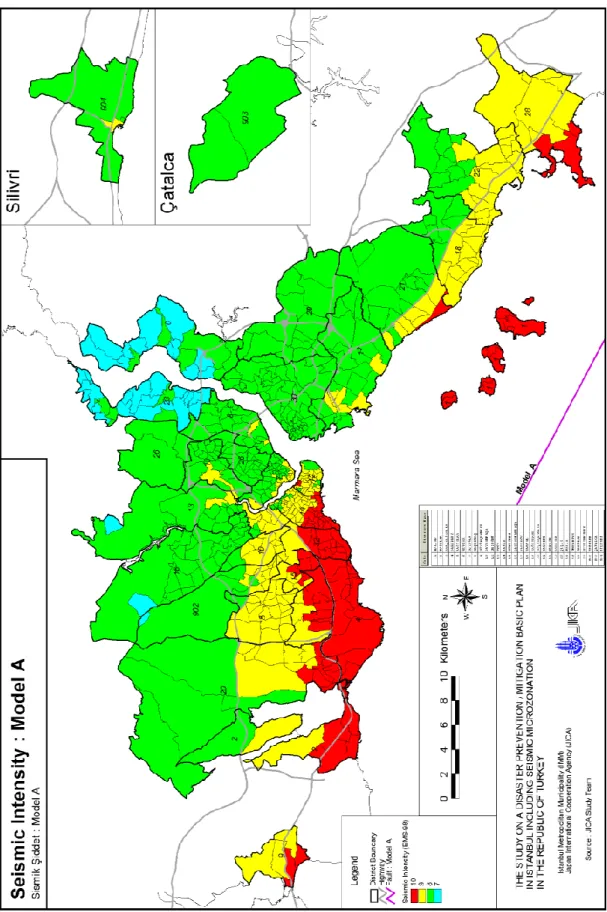
Figure 3.4: Seismic Intensity in Model A ... 26
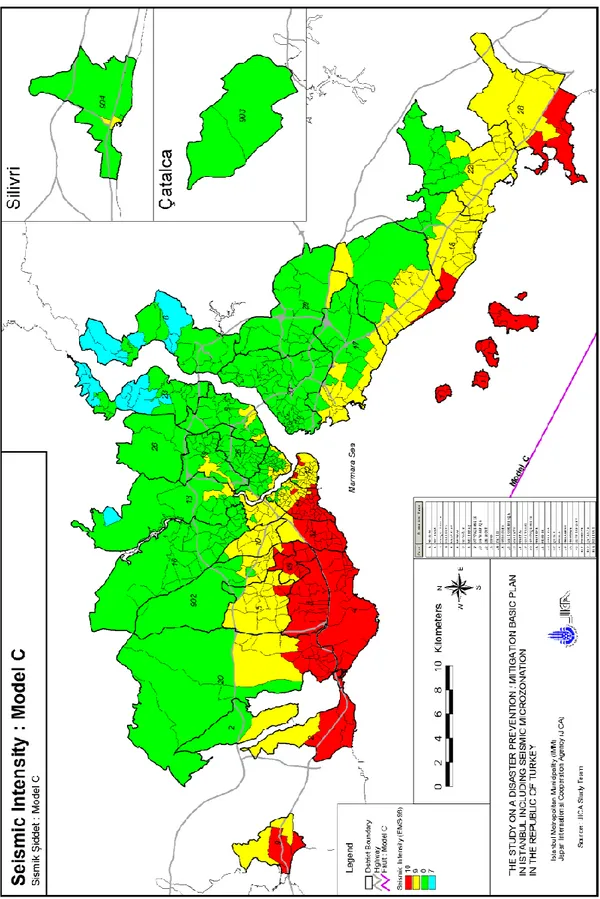
Figure 3.5: Seismic Intensity in Model C ... 27
Figure 3.6: The context diagram of the problem... 30
Figure 5.1: Map of number of damaged buildings of Kadiköy for scenario A ... 45
Figure 5.2: Seismic intensity map of Kadiköy for scenario A ... 45
Figure 5.3: Map of number of damaged building of Kadiköy for scenario C ... 47
Figure 5.4: Seismic intensity map of Kadiköy for scenario C ... 47
Figure 5.5 Visual expected distribution plan of event scenario 3 for Model (A) ... 64
Figure 5.6 Visual expected distribution plan of event scenario 3 for Model (C) ... 64
Figure A.1 First part of ZIMPL code of the normalized weighting model ... 72
viii
List of Abbreviations
IBB/IMM: Istanbul Metropolitian Municipality AKOM: IMM Disaster Coordination Center AKUT: Turkish Search and Rescue Association JICA: Japan International Cooperation Agency TSA: Temporary shelter area
SA: Storage area
LAOM: Location and allocation optimization models LA: Location allocation
MIP: Mixed integer programming LP: Linear programming
LDD: Location and distribution decisions MOP: Multi objective problem
1
Chapter 1
Introduction
Today’s one of the prominent problems is natural disaster. Every year thousands of people are losing their lives and their homes are being demolished due to natural disasters. Post disaster period has a significant role for survivors. Through unsuccessful management of post disaster activities, insufficient materials, starvation, cold and diseases, people continue to lose their lives. People have learnt from experience that constructing strong earthquake-resistant buildings are not enough to be prepared for natural disasters. Organizations must have contingency plans for predicted natural disasters and must apply and manage these plans successfully to save millions’ lives. This is called “disaster management” or “emergency management”.
Emergency response (ER) is the second phase of disaster management (Tufekci and Wallace, 1998). It is applied to all types of natural disasters but its specific activities may change according to the type of disaster. ER operations assist people maintain life and improve health conditions and morale of disaster victims. In this research focus is on one of the emergency response operations which is the distribution of shelters to temporary shelter areas. However, preparing distribution plans alone is not sufficient, having better positioned storage areas provides better distribution plans. Because of that, locating storage areas is also considered in this thesis as preparedness phase of disaster management.
2
Natural disasters are divided into two main categories as geological and climatic (Aeron, 2006). Geological disasters are earthquake, landslide, tsunami and volcanic eruption. Climatic disasters are drought, flood, tropical cyclone/hurricane and wildfire. In this thesis, focus is on earthquake disaster which is expected to occur in İstanbul/Turkey. If we take earthquake in general, factors that contribute to vulnerability are the location of buildings in seismic areas, earthquake-vulnerable buildings and overpopulation. Casualties are often high in over populated areas. Diseases may occur because of contaminated water supply or deterioration of sanitary conditions. There may be problems about water supply due to damaged water systems (canals/pipes). Typical needs after earthquake are search and rescue operations, medical assistance, food and water procurement, repair, reconstruction and provision of shelters. As it was stated before, storage and distribution of shelters are investigated in this thesis.
Provision of shelters should be planned carefully because families will live in the shelters temporarily and there will be kids. Providing shelters to families is going to raise their morale. Insufficient amounts of shelters cause many problems. Moreover, especially in cold and rainy weather, bringing shelters to survivors quickly is very critical to prevent diseases.
A multi objective stochastic location and distribution model was developed in order to prepare inventory and distribution plan and in order to solve predicted shelter provision problem of expected Istanbul earthquake. In the model, there are temporary shelter areas (TSA) that people will be gathered at and live temporarily. Because of the reasons mentioned above, shelters will have to be received by TSA as soon as possible. Moreover, the model has possible storage areas (SA) that shelters
3
will be stored at before earthquake hits. After earthquake, shelters will be sent immediately to the TSA. To achieve that, one of our objectives is to minimize total distance between TSA and SA.
Kadıköy was chosen as the application area. Detailed information about application area and collected data were given in Chapter 5. The mathematical model was developed to help decision makers create an inventory and distribution plan in Kadıköy. All information about expected Istanbul earthquake was collected from JICA report. Civilians of Istanbul have negative past experiences about earthquake and it is crucial to be prepared against the upcoming one. Storage of shelters is also a critical issue as much as rapid shelter transportation. Due to lack of security at storage areas, shelters can be stolen or be damaged. It was discussed in Chapter 3 more deeply.
The organization of the thesis is as follows; Chapter 2 includes the related literature. In Chapter 3, the problem is defined. Then, effects and causes of the problem are explained. After that, the mathematical model is introduced. Chapter 4 includes the solution approach for the mathematical model. In Chapter 5 implementation of the mathematical model is discussed and all of collected necessary data is presented. Furthermore, results of the mathematical model are examined and an example inventory and distribution plan is given. Next, research is concluded in Chapter 6.
4
Chapter 2
Literature Review
Our problem includes two significant topics which are emergency management and location and distribution decisions. In this chapter, academic articles about emergency response and studies carried out in location and allocation/distribution models were examined.
2.1 Location and Distribution Decisions with Deterministic Models
Location and distribution decisions (LDD) become very critical in developed and globalized world. Many of the location and distribution decisions are handled with location and allocation optimization models (LAOM) that are also known as p-median problem / multi-Weber problem. P-p-median problem is defined by Hakimi (1963) and it involves locating p facilities on a network by minimizing total weighted distance of serving the demand points. There are many successful applications of LAOM models in transportation, retailing, emergency health services, logistics, and emergency response systems. Managers deal with location and allocation problems when they want to decide where to build distribution centers and how to distribute supplies to demand points.
Logic of LAOMs is minimizing the total cost by selecting a set of distribution centers and a set of allocation decision for each distribution center. According to the
5
needs of organization, one distribution center may serve only one demand point or multiple points.
Cooper (1963) modeled the first location allocation problem and presented methods to solve these problems. Furthermore, Cooper (1972) formulated a problem by combining transportation and location problem. The problem was stated as combined concept of Location Allocation (LA) problem and Hitchcock transportation problem. This study is considered as root of location and routing literature. Cooper’s problem was locating “n” sources among “m” fixed locations. Objective function of the problem was minimizing total cost according to the capacities of source points and the demand of destination points. Cooper (1972) also included a heuristic approach to this problem and developed a new heuristic approach to the same problem in 1976. Hakimi (1965) created the concept of network location-allocation problem to find the best location of “switching center” in the network so that he can locate the optimal place for building the police station. ReVelle and Swain (1970) designed a LA model that consists of determining m of n communities as centers in such a way that the average distance or time travelled per person become minimum.
Kuenne and Soland (1972) generated exact and approximate solutions for p-median problems using branch-and-bound. On the other hand, simulated annealing is another method to solve LA problems and it was used by Murray and Church (1996). Location Allocation problem was studied deeply by Gen and Cheng (1997). They used genetic algorithms to solve many constrained optimization problems such as location and allocation problems. When the number of facilities to locate was very large, it was difficult to obtain optimal results. Gen and Cheng also included
6
many types of LA problems in their book called “Genetic Algorithms and Engineering Design”. Brimberg et al. (2000) developed today’s algorithms to deal with LA problems. They compared and analyzed solutions of heuristic methods such as tabu search (Mladenović, 1996), projection method of Bongartz et al. (Bongartz et al., 1994), heuristic solution of Hansen et al. for Multiscore Weber problems (Hansen et al., 1996) and others with exact solutions. They also stated that many traditional heuristics give poor results when number of facilities became large.
All LA models that are mentioned in this section contain deterministic and single objective problems. Our LA model was developed considering multi objective functions with stochastic events.
2.2 LDD with Stochastic and/or Multi-objective Models
Deterministic models provide a single outcome for a given set of constraints and variables. However, stochastic models provide a set of possible outcomes according to their probabilities. Stochastic modeling is used in many areas when uncertainty takes place. Uncertainty creates possible different scenarios that depend on their probabilities. Because of that, stochastic mathematical models optimize expected values (Taylor and Karlin, 1988). There are some applications of stochastic location allocation models in the literature as follows.
2.2.1 General Industry Applications
Carbone (1974) developed a deterministic LA model that minimizes travel distance of users to fixed medical centers. When he realized the number of users at each demand point was uncertain, he updated the deterministic model to a chance-constrained model. Similar to the mathematical model of Carbone (1974), Logendran
7
and Terrell (1988) generated a facility location model that has stochastic demands and un-capacitated plants. Model is solved with a heuristic approach to select plants to open and to determine allocation of clients to plants. Objective function of the model was maximization of expected profit. Since Logendran and Terrell’s model is stochastic LA, it is more similar to our problem. However our model has capacitated storage areas. Louveaux (1993) mentioned that locations and sizes of facilities are considered as first-stage decisions in many LA models. In addition, some of the models contain decision variable of allocation of customers to facilities as first-stage decision. An example to that situation is the model which was developed by Laporte et al. (1994). They assumed that determining which facilities to use and allocation of customers to facilities are first-stage decisions. On the other hand, determining quantities that will be transferred from facilities to customers is considered as second stage decision. Another incapacitated and stochastic facility location model was developed by Louveaux and Peeters (1992). Their model contains uncertain demands, uncertain transportation and production costs, uncertain selling prices and event scenarios.
Michalopoulos et al. (2013) developed a stochastic network model that determines the locations of radiation detectors for construction decisions. Radiation detectors had to be built along one of the nation’s border to prevent nuclear smuggling. They created possible threat scenarios by determining smuggler population. Solution of the model gives priority list of locations for building detectors. Model has a budget constraint that limits installation of detectors. The objective of the model is allocating locations to priority rank levels and building radiation detectors at high priority locations according to budget. The presented model is stochastic linear MIP. Mousavi and Niaki (2012) studied a capacitated
8
location allocation problem where demands and locations of customers were uncertain. They assumed that demands are fuzzy and locations have normal probability distribution. Expected distances between nodes are determined by two closed form Euclidean and squared Euclidian expressions. Three types of fuzzy programming were developed for modeling location-allocation problem. They also solved the model with a hybrid intelligent algorithm. First model was the fuzzy expected cost model that minimizes expected cost while finding optimal stochastic location. The first model has closer logic to our model than other two models.
2.2.2 Health Care Applications
One of the major application areas of LA models is health care service. Carson et al. (1990) constructed a LA model for preparing dynamic ambulance position plan for campus emergency service. Demands change based on the scenarios and ambulances were relocated in each scenario for minimizing the average response time. Furthermore, Berlin et al. (1976) discussed two LA problems related with locating hospitals and ambulances. First problem focused on patients and the objective of the model was minimizing the average distance between hospitals and demand nodes based on average response time. Second problem included a new objective function in order to minimize average distance between hospitals and ambulance location nodes. Moreover, Mestre et al. (2014) studied a location allocation model for stochastic hospital network planning. Aim of the research was to reconstruct the hospital network system that improves geographic access and minimizes all costs. In the model, hospitals provided multiservice with hierarchy and demand uncertainty was considered instead of deterministic demands. Each scenario contains different demands with related probabilities. Two location-allocation
9
models were generated by Mestre et al. (2014). First one contains locating operation as first stage decisions; second model contains locating and allocating operations as first stage decisions. These two models were applied on a case study of Portuguese National Health Service. In the second model location-allocation decisions were not scenario dependent because these decisions had to be made at the first stage. So, unsatisfied demand and extra capacity variables were added to the model to handle demand changes in each scenario. Because of adding those new variables and considering allocation as first stage decision, second model was not constrained by a single extreme scenario as in first model. Their models were bi-criteria models that minimize the total expected travel time and the total expected cost. Among models introduced in this section, first model of Mestre et al. (2014) was closer to proposed mathematical model of this thesis. Considering location decision as first stage and allocation decision as second stage, scenario based uncertain demands, and multi objective functions are the similarities between the models. However, their model did not have expected penalty cost due to unsatisfied demand as one of the objectives. Our model contains three objective functions: total expected earthquake damage risk factor, total expected distribution distance and total expected unsatisfied penalty cost.
LA models were used in many areas by armies, government, employees, etc. However, the focus is on LA models that are used to manage emergency response operations in the following part of the literature review.
2.2.3 Emergency Management Applications
Emergency management operations need to be planned carefully in order to decrease the effects of disasters, so there are many academic works about it all around the world. An example of a disaster case is a cyclone named Nargis that
10
stroke Myanmar coasts in 2008. Because of the government’s restrictions on foreign aid workers and equipment, 2.5 million people were affected since they needed aids to survive (Sheu, 2010). The importance of Emergency Management can be clearly understood from this example.
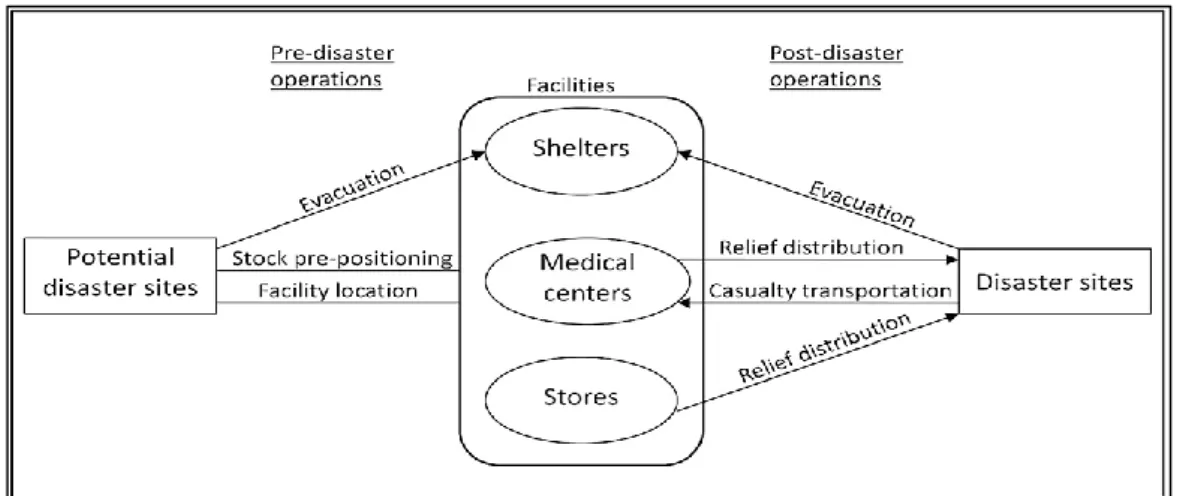
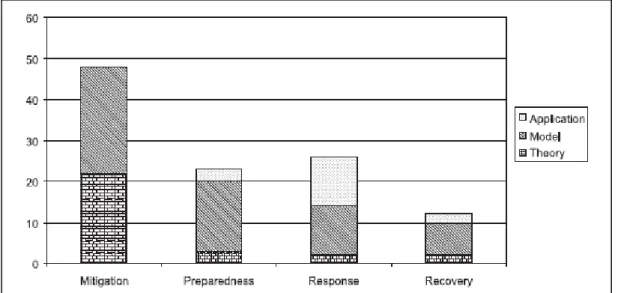
Caunhye et al. (2011) stated that emergency transportation operations were divided into three parts in the literature: Facility locations, relief distribution and casualty transportation. For these three parts, Caunhye et al. (2011) compared models based on their objective functions and constraints. Listed facility location models in the article show that models are mostly single-period because they are used to plan pre-disaster operations. Moreover, relief transportation is a post-disaster operation so, models that include relief distribution as second stage decisions are mostly multi-period. In Figure 2.1, operations of disaster management are given (Caunhye et al., 2011). In addition, Altay and Green (2005) surveyed the literature for identifying related research about disaster operations management. They analyzed distribution of research contribution and research types according to phases of disaster management. In Figure 2.2, you can see the related data about contribution (Altay and Green, 2005).
11
Figure 2.2: Stages of disaster operations management and distribution of research contribution
This research includes preparedness and recovery stages of disaster management. Figure 2.2 shows that modeling is significant for these two stages. In the response stage, application is also critical because successful applications save peoples’ life in that stage. As mentioned in Altay and Green (2005), real life application in a pilot area was considered in this thesis. In addition, Chia (2006) studied disaster relief and published an article called “Engineering Disaster Relief”. In the article, it was stated that the primary role of the logistic management in disasters was to deliver supplies in good conditions with the required quantities at the right time to the right place. However, destruction of roads may have created bottleneck in the distribution network so while having made plans, efficient and alternative routing of relief supplies would have been required. Moreover, importance of security management for emergency response was emphasized by Chia (2006).
Duran et al. (2011) explained the model that was generated by Cooperative for Assistance and Relief Everywhere (CARE) International of Georgia Institute of Technology. The model was developed to increase effectiveness of CARE’s average
12
relief-aid emergency response time. CARE determined the configuration of its network with the help of the model and the roadmap was evaluated to see how they achieve that configuration when funds become available. CARE’s model was a stochastic model due to the change of demand according to disaster type. Moreover, the objective of CARE’s models was minimizing the expected response time. Another single objective MIP model about transportation in disaster response operations was developed by Berkoune et al. (2012). They developed an efficient genetic algorithm in order to deal with realistic situations that have large node sizes. Also, they managed to provide very effective near optimal transportation plans to help emergency managers in decision making. The objective function of their model (TP-DRO) was minimizing the total transportation duration. TP-DRO was applied on a case study which includes three distribution sites and sixty delivery points. At the end, it was concluded that the genetic algorithm was very effective and could deal with larger instances for decision support. Brown and Vassiliou (1993) created resource allocation models to manage relief distribution. The objectives of the research was minimizing distance costs, and to maximize efficiency. However optimization of objective functions was performed separately. They developed a decision support system called ARES that contains three different models and the system solves three models in sequence. Balcık and Beamon (2008) introduced single objective maximal covering location model that integrates both location and inventory decisions. The objective function of the model was maximizing the total expected demand covered by distribution centers. In the model, they considered multiple item types and they included constraints related with budget and capacity. The model was applied to an actual case study and the results were analyzed. As a result the developed model was very effective in terms of response time and demand
13
satisfaction. Additionally, Rawls and Turnquist (2006) published an article about two-stage stochastic optimization model that found optimum locations for emergency supplies and allocate quantities of those emergency supplies. The objective function of the model was cost minimization with three scenario-based uncertainties such as demand quantities, demand locations and transportation capacities. The model was implemented on a pilot area that was hit by a hurricane in Southern United States. Another facility location model was studied by Mirchandani (1980) in order to locate fire-fighting units according to stochastic travel characteristics and demand pattern. He considered an uncertainty that a facility might be unavailable and cannot serve demand points.
Evacuation is also a critical operation in Emergency Response Management. There are some models that optimize evacuation in disasters. One of the models was designed by Cova and Johnson (2003). They presented a network flow model to find optimal lane-based route plan for evacuation. The model was a minimum cost flow problem and solved by mixed-integer programming solver. Moreover, Yi and Özdamar (2006) introduced a location and distribution model that coordinates logistics and evacuation operations in emergency response management. The model was a mixed integer multi-commodity network flow model and its objective function was minimizing total delay in delivery of the commodities at aid centers and in the provision of healthcare for the injured survivors.
Sheu (2010) stated that “Emergency logistics management has emerged as a globally concerned theme as natural disasters ubiquitously occur around the world.” In the article, a dynamic multi-criteria relief demand management model was introduced to meet urgent relief demands based on time-varying relief demand and
14
demand urgency of the affected area. Furthermore, Liberatore et al. (2014) worked on distribution of emergency goods to casualties by recovering damaged distribution elements. During disaster, parts of distribution infrastructures like bridges and roads can be damaged. Because of that, vehicles cannot reach all distribution centers. A multi-criteria model called RecHADS was developed and applied for a case study about 2010 Haiti earthquake. Their model includes also reliability and security attributes rather than only cost attribute like the model of this thesis. Zhang et al. (2013) mentioned the need for quick responses and unpredictable events of disasters that make emergency logistic system quite different than traditional logistic systems. In the article, they introduced a weighted bottleneck Steiner tree based multi-objective location optimization model for logistic system of Emergency Response. The weights represent the importance of demand points and the model has two objective functions for minimizing the total distance and minimizing the maximum distance between facility and demand. According to Zhang et al. (2013), instead of cost minimization, responding to urgent needs of affected people quickly is more crucial. Barbarosoglu and Arda (2004) developed a two-stage stochastic transportation model for earthquake disaster relief system and the model was validated with the data of 1997 Istanbul earthquake. Both first and second stage problems were transportation systems that occur at different times. First stage includes transportation of supplies between supply nodes and starts as soon as earthquake signal is received with magnitude. It has a very short time period. Second stage contains transportation between demand and storage points where additional external supplies are not allowed. Instead of combining two stages within a same model, they developed two separate mathematical models. First model determines amounts of supplies at storage points by minimizing total transportation
15
cost and expected recourse cost before disaster. Second model determines distribution of relief aids after disaster according to output of the first model by minimizing total flow cost, mode shift cost and penalty cost. There is a limited time between receiving earthquake signal and occurrence of disaster. Because of that, first stage operation of this research is considered as locating of storage areas at low risk areas as much as possible instead of relief preposition. Moreover, instead of developing separate model for each stage, in this research two stages of emergency management were combined within a same model.
The model of this research has aspects from the relevant literature; however, there is no other model that includes:
demand uncertainty,
simultaneously minimization of total risk factors, total distance and scenario dependent unsatisfied demand penalty,
two stage stochastic approach in which the first stage is locating storage areas and second stage is relief distribution,
capacitated storage areas as schools, and
coverage limit for storage areas
within the same model all at once in the earthquake emergency response management literature.
In the literature the closest model to this research was developed by Samanlıoğlu et al. (2012). They developed a model in order to manage relief distribution before and after a hurricane. So, their model was a stochastic two stage expected cost minimization problem. The first stage includes preposition of relief
16
goods between storage areas according to forecasts, and the second stage is the response phase that includes distribution of relief goods between storage points and demand points. Moreover, demand changes according to the scenarios, so demand changing parameter was included in the model. Different from their model, the model of this research includes locating storage areas as the first stage (before disaster event) operation instead of pre-positioning operation because earthquake is not predictable like hurricane. Hurricane can be predicted 48 hours before landfall; however, there is no such time for earthquake so it is difficult to perform preposition operations between storage points. Another difference between those models is their objective functions. The model of this research simultaneously minimizes three objective functions that are mentioned earlier. Furthermore, the developed model of this thesis includes preparedness and response phases of emergency management and they are very critical in terms of modeling and application (Altay and Green, 2005). In this thesis, first stage (pre-disaster stage) of the developed model includes locating SA and second stage (post-disaster stage) of the developed model includes distributing shelters between SA and TSA.
17
Chapter 3
Problem Definition & Model Development
3.1 Historical Data of Istanbul Earthquakes
Both Istanbul metropolitan municipality and foreign researchers of JICA declared that there will be an earthquake in Istanbul in the following years and people need to be prepared for it (JICA, 2002). People had many negative experiences during and after earthquake. Turkey went through several earthquake disasters in the century and at least 110,000 people lost their lives, about 250,000 people got injured and around 600,000 buildings collapsed (Erdik and Aydinoglu, 2002; Erdik 2001).
An earthquake happened in August 17, 1999 and damaged several cities in the Marmara Region and the center of the earthquake was Gölcük. Approximate number of deaths because of Gölcük earthquake is listed among cities in the following table (Kaya et al., 2004).
Table 3.1: Number of deaths during 1999 earthquake
Golcuk İzmit Sakarya Yalova Istanbul Bolu Bursa Eskisehir Zonguldak
5025 4093 2696 2502 981 264 268 86 3
Table 3.1 includes underestimated number of casualties since actual numbers can be more (Sahin and Tari, 2000). Moreover, the number of heavily damaged houses is around 66403 and the number of heavily damaged business units is 15000
18
for Gölcük disaster. Around 60% of these houses and business units collapsed immediately during the earthquake. Number of weakly or medium damaged houses is approximately 146493 and number of weakly or medium damaged business units is 21000 (Sahin and Tari, 2000). As a result, around 120000 families needed home after Golcuk earthquake and this shows importance of shelter provision which is the research area of this thesis.
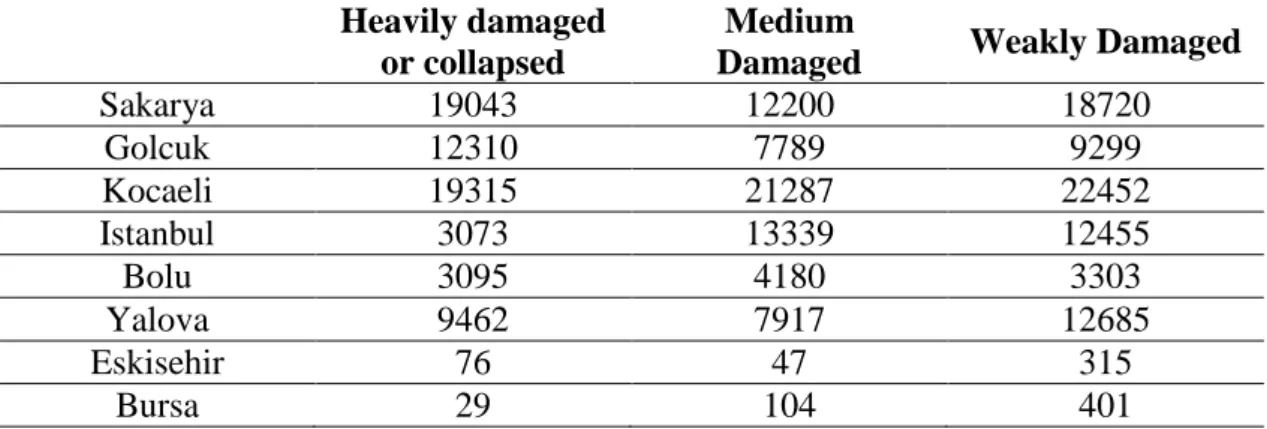
Distribution of damaged houses among cities is given in Table 3.2 (Sahin and Tari, 2000). As it is shown, Istanbul has 3073 collapsed or heavily damaged and 25794 medium or weakly damaged houses.
Table 3.2: Number of damaged buildings during 1999 earthquake
Heavily damaged or collapsed
Medium
Damaged Weakly Damaged
Sakarya 19043 12200 18720 Golcuk 12310 7789 9299 Kocaeli 19315 21287 22452 Istanbul 3073 13339 12455 Bolu 3095 4180 3303 Yalova 9462 7917 12685 Eskisehir 76 47 315 Bursa 29 104 401
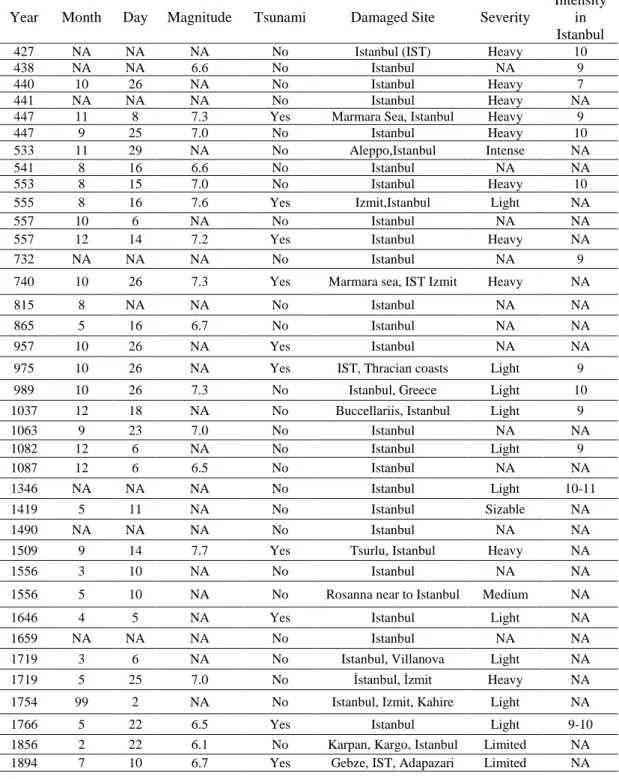
Istanbul is an overpopulated city and its population increases rapidly day by day. If we compare today’s population with 1999’s population, there is an approximately 85% increase between those years (IMM, 2005). Moreover, many of the buildings are not earthquake-resistant in Istanbul and center of the upcoming earthquake is expected to occur at Marmara Sea which is very close to Istanbul (JICA, 2002). Moreover, Griffiths et al. (2007) states that more than half of the constructed buildings in Istanbul is unmonitored and undocumented. Because of this situation, damage of the disaster will be high. In Table 3.3, all historical earthquakes that damaged Istanbul were listed to explain significance of the problem. As it is seen
19
in the table, Istanbul was heavily damaged by earthquakes most of the times and they created Tsunami in some of the years.
Table 3.3: Historical earthquake data of Istanbul
Year Month Day Magnitude Tsunami Damaged Site Severity
Intensity in Istanbul
427 NA NA NA No Istanbul (IST) Heavy 10
438 NA NA 6.6 No Istanbul NA 9
440 10 26 NA No Istanbul Heavy 7
441 NA NA NA No Istanbul Heavy NA
447 11 8 7.3 Yes Marmara Sea, Istanbul Heavy 9
447 9 25 7.0 No Istanbul Heavy 10
533 11 29 NA No Aleppo,Istanbul Intense NA
541 8 16 6.6 No Istanbul NA NA
553 8 15 7.0 No Istanbul Heavy 10
555 8 16 7.6 Yes Izmit,Istanbul Light NA
557 10 6 NA No Istanbul NA NA
557 12 14 7.2 Yes Istanbul Heavy NA
732 NA NA NA No Istanbul NA 9
740 10 26 7.3 Yes Marmara sea, IST Izmit Heavy NA
815 8 NA NA No Istanbul NA NA
865 5 16 6.7 No Istanbul NA NA
957 10 26 NA Yes Istanbul NA NA
975 10 26 NA Yes IST, Thracian coasts Light 9
989 10 26 7.3 No Istanbul, Greece Light 10
1037 12 18 NA No Buccellariis, Istanbul Light 9
1063 9 23 7.0 No Istanbul NA NA 1082 12 6 NA No Istanbul Light 9 1087 12 6 6.5 No Istanbul NA NA 1346 NA NA NA No Istanbul Light 10-11 1419 5 11 NA No Istanbul Sizable NA 1490 NA NA NA No Istanbul NA NA
1509 9 14 7.7 Yes Tsurlu, Istanbul Heavy NA
1556 3 10 NA No Istanbul NA NA
1556 5 10 NA No Rosanna near to Istanbul Medium NA
1646 4 5 NA Yes Istanbul Light NA
1659 NA NA NA No Istanbul NA NA
1719 3 6 NA No Istanbul, Villanova Light NA
1719 5 25 7.0 No İstanbul, İzmit Heavy NA
1754 99 2 NA No Istanbul, Izmit, Kahire Light NA
1766 5 22 6.5 Yes Istanbul Light 9-10
1856 2 22 6.1 No Karpan, Kargo, Istanbul Limited NA
20 3.2 The JICA Report
JICA prepared a report with Istanbul metropolitan municipality in order to gather data about expected Istanbul earthquake. A research team from JICA came to Istanbul on March 13, 2001 and they carried out the research for 19 months. Research titled “The Study on A Disaster Prevention / Mitigation Basic Plan in Istanbul Including Micro zonation in the Republic of Turkey” was completed and published in November 2002. JICA report is a detailed research which contains information about expected Istanbul earthquake and constructions in Istanbul. In this thesis, data about expected Istanbul earthquake was collected from the JICA’s report.
The JICA report was planned in 7 stages which are listed below;
Stage 1: Collecting available information for determining, analyzing and evaluating the topics of project.
Stage 2: Conducting an on-site investigation about situation of ground, buildings, population and other related issues.
Stage 3: Forming the GIS database and analyzing data.
Stage 4: Analysis of the seismic action.
Stage 5: Evaluation of the seismic hazard and damage.
Stage 6: Evaluation of hazard maps and seismic microzonation map.
Stage 7: Detailed examination of urban disaster prevention and damage mitigation issues.
JICA team created four possible scenarios for fault line breakdown of the expected earthquake. These four earthquake scenarios were created based on
21
historical earthquakes and North Anatolian fault line and listed below. Drawings of scenarios’ fault lines are shown in Figure 3.1 (JICA, 2002).
Model A: approximately 120 km long fault line of 1999 Izmit earthquake causes disaster and seismic activity goes from east to west. Moment magnitude was assumed to be 7.5 Mw.
Model B: approximately 110 km long fault line of 1912 Mürefte-Şarköy earthquake causes disaster and its moment magnitude was expected to be 7.4 Mw.
Model C: This scenario assumes that 170 km long North Anatolian fault line in Marmara Sea will break at the same time. The moment magnitude is expected to be 7.7 Mw. It is the biggest magnitude that will occur in this area. The largest earthquake that has occurred around the Marmara Sea in the history has 7.6 Mw moment magnitude.
Model D: This scenario assumes that the fault line in the north of Marmara Sea intersects with Cınarcık Graben and creates earthquake which has 6.7 mw moment magnitude.
Among these 4 earthquake scenarios, Model A has the greatest probability to take place and Model C is the worst-case scenario to happen. Therefore, the JICA report has data only for these two earthquake scenarios and only Model A and Model C were considered in the application of the mathematical model.
22
Figure 3.1: Fault lines of the expected earthquake scenarios
Stages of the JICA project was mentioned before and stage 6 contains significant data for this thesis which is hazard maps. To determine risk factors for the storage areas, maps that contain the number of heavily damaged buildings and
23
seismic intensity maps were used. Maps in Figures 3.2, 3.3, 3.4 and 3.5 were used in data collection. As shown in the figures, red and orange colored areas will be affected heavily, yellow colored areas will suffer moderate level damage, green and blue colored areas will be affected lightly from the earthquake.
As mentioned before, because of lack of data about Model B and Model D, only Model A and Model C were considered as possible earthquake scenarios. Moreover, as it is stated in JICA report, Model A has greater chance to occur, so its probability was assumed to be always higher than Model C’s probability for scenarios. The mathematical model was solved for following four scenarios.
Table 3.4: Possible Event Scenarios for Mathematical Model
Event Scenario No Probability of Model A (Earthquake Scenario 1) Probability of Model C (Earthquake Scenario 2) 1 0.9 0.1 2 0.8 0.2 3 0.7 0.3 4 0.6 0.4
24
25
26
27
28 3.3 Description of The Problem
Hazard maps show that building destruction will be high in many districts and people will need temporary shelters to live. Focus of the thesis is on inventory and distrubution of shelters to support post-disaster event of the expected earthquake so, the problem that was considered in the research is how to safely store shelters, distribute them effectively after earthquake occurs and meet shelter needs of survivors. If it is winter time, minimizing distribution distance will be critical to prevent illnesses and infant deaths and also to prevent chaos.
Why is the safety crucial for storage areas? First of all, damage in storage areas after earthquake results in unsatisfied demands. However, chosing storage areas by minimizing their total expected earthquake damage risk factors is not enough in terms of safety. Storage areas must be safe in many ways, they must be both durable against high earthquake magnitude and safe against burglars. In the past, people damaged and stole AKUT’s emergency storages. Also, in Izmit, Kızılay’s 200,000 TL worth of shelters were stolen (Bizimkocaeli, 2013). To create better inventory and distribution plan in terms of safety, universities and public schools in Kadiköy were designated as shelter storage points.
Briefly, using universities and public schools to store shelters is an easily applicable solution. Advantages of using school areas were listed below.
Shelters will be stored in standard transportation containers in the gardens of schools. Schools have wide yards convenient for loading shelters to vehicles after the earthquake. This will affect distribution process positively.
29
Most of the university and high school buildings in Istanbul are old buildings and they survived at least two earthquakes.
The schools are generally low-rise buildings and cannot damage their premises even if collapse. Thereby, loss of shelters inflicted by earthquake will be as little as possible.
Schools have their own security equipments such as cameras and security personnel. During the day time, crowd in school and presence of security personel prevent robbery. At night, security cameras could be deterrent against burglars. Moreover, some universities have security personels that work 24 hours.
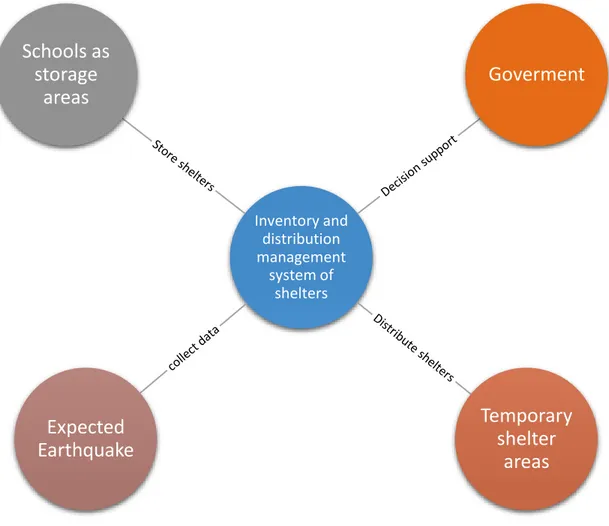
In this thesis, only public schools were included to be used as storage areas since, government or municipality can easily use their own schools. The context diagram of designed system can be seen in Figure 3.6. All units that influence the system are shown in the figure.
30
Figure 3.6: The context diagram of the problem
The contextual frame of the problem that was considered in this thesis is as follows;
Kadiköy has a shelter storage and distribution problem due to expected İstanbul Earthquake
Public schools will be used as storage areas
There is many to many relationship between TSA and SA.
Temporary shelter areas are designated by IMM and related data is provided by IMM, Kadıköy Municipality and the JICA report.
Two possible earthquake scenarios (model A and C) will be used with different probabilities. Inventory and distribution management system of shelters
Goverment
Temporary
shelter
areas
Expected
Earthquake
Schools as
storage
areas
31
The aim is to specify which schools to use as storage areas and to prepare a distribution plan by considering earthquake damage risk of storage areas, total distribution distance and penalties for unsatisfied demand.
To solve the problem that is stated above, a stochastic multi objective mixed integer mathematical model was developed.
3.4 The Developed Mathematical Model
The objectives of the model are to minimize the expected total distribution distance, expected total penalty related to unsatisfied demand and expected total earthquake damage risk factors at SA. To be able to prepare an efficient inventory and distribution plan, it is needed to efficiently:
Specify the storage areas,
Distribute shelters to temporary shelter area(s),
Determine the required number of shelters to be sent from each storage area to temporary shelter area,
Locations of potential SA and TSA are known. However, the damage of the expected earthquake is uncertain. Probabilities of earthquake scenarios change with each event scenario. Moreover, risk factors, penalty costs and demands are different in both earthquake scenarios. When all of these factors are considered, defined problem turns into a two staged stochastic problem. The model has binary and real number decision variables, so it is a mixed integer model.
32
The mathematical model involves deciding which storage areas to use as well as distributing shelters from storage areas (SA) to temporary shelter areas (TSA). Objective functions are simultaneously;
O1: Minimization of total expected distribution distance between SA and TSA O2: Minimization of total expected earthquake damage risk factors of SA O3: Minimization of total expected unsatisfied demand penalty cost of TSA
Sets;
S = {n | n=1…N} set of SA
F ⊂ S set of fixed SA
D = {j | j=1…M} set of TSA
Sc = {t | t=1,2} set of earthquake scenario in the model.
First Stage Decision Variables;
An: {1 if storage area n is used for storing shelters, n ∈ S0 otherwise;
Second Stage Decision Variables;
Xnjt: Amount of shelters sent from storage area n to shelter area j according to
scenario t, n S, j D, t Sc.
Ujt: Amount of unsatisfied demand at shelter area j according to scenario t,
j D, t Sc,
Bnjt {
1 if storage area 𝑛 serves shelter area 𝑗 according to scenario 𝑡, 𝑛 ∈ 𝑆, 𝑗 ∈ 𝐷, 𝑡 ∈ 𝑆𝑐 0 𝑜𝑡ℎ𝑒𝑟𝑤𝑖𝑠𝑒;
33 Second Stage Parameters;
Pt: Probability of earthquake scenario t, t Sc.
Supply Parameters;
Cn: Potential storage capacity of storage area n, n S.
Rnt: Potential earthquake damage risk factor of storage area n according to
scenario t, n S, t Sc. Demand Parameters;
Djt: Demand of temporary shelter area j according to scenario t, j D, t Sc.
Tnj: Distance between storage area n and temporary shelter area j in km,
n S, j D.
Mjt: Penalty cost for unsatisfied demand of temporary shelter area j according to
scenario t, j D, t Sc. Useful Definitions;
Definition 1: K is the distance limit for shelter allocation and defined as 𝐾 ≈ [ Max
𝑛∈𝑆,𝑗∈𝐷{𝑇𝑛𝑗}] 2⁄ , K value can be changed according to decision maker’s preference. Definition 2: H is a large enough number and defined as 𝐻 ≈ Max
34 The Mathematical Model:
𝑂1 = 𝑀𝑖𝑛 ∑ 𝑃𝑡∗ {∑ ∑ 𝑇𝑛𝑗∗ 𝐵𝑛𝑗𝑡 𝑗𝜖𝐷 𝑛𝜖𝑆 } 𝑡𝜖𝑆𝑐 (1) 𝑂2 = 𝑀𝑖𝑛 ∑ 𝑃𝑡∗ {∑ 𝑅𝑛𝑡 ∗ 𝐴𝑛 𝑛𝜖𝑆 } 𝑡𝜖𝑆𝑐 (2) 𝑂3 = 𝑀𝑖𝑛 ∑ 𝑃𝑡∗ {∑ 𝑀𝑗𝑡∗ 𝑈𝑗𝑡 𝑗𝜖𝐷 } 𝑡𝜖𝑆𝑐 (3) Subject to ∑ 𝑋𝑛𝑗𝑡 𝑗𝜖𝐷 ≤ 𝐶𝑛∗ 𝐴𝑛 ∀ 𝑛𝜖𝑆, 𝑡𝜖𝑆𝑐 (4) ∑ 𝑋𝑛𝑗𝑡+ 𝑈𝑗𝑡 𝑛𝜖𝑆 = 𝐷𝑗𝑡 ∀ 𝑗𝜖𝐷, 𝑡𝜖𝑆𝑐 (5) 𝑋𝑛𝑗𝑡 ≤ 𝐻 ∗ 𝐵𝑛𝑗𝑡 ∀ 𝑛𝜖𝑆, 𝑗𝜖𝐷, 𝑡𝜖𝑆𝑐 (6) 𝐴𝑛 = 1 ∀ 𝑛𝜖𝐹 (7) 𝑇𝑛𝑗∗ 𝐵𝑛𝑗𝑡 ≤ 𝐾 ∀ 𝑛𝜖𝑆, 𝑗𝜖𝐷, 𝑡𝜖𝑆𝑐 (8) 𝐵𝑛𝑗𝑡 ≤ 𝐴𝑛 ∀ 𝑛𝜖𝑆, 𝑗𝜖𝐷, 𝑡𝜖𝑆𝑐 (9) 𝐴𝑛 𝜖 {0,1} ∀ 𝑛𝜖𝑆 (10) 𝑋𝑛𝑗𝑡 𝜖 𝑅+ ∀ 𝑛𝜖𝑆, 𝑗𝜖𝐷, 𝑡𝜖𝑆𝑐 (11) 𝑈𝑗𝑡 𝜖 𝑅+ ∀ 𝑗𝜖𝐷, 𝑡𝜖𝑆𝑐 (12) 𝐵𝑛𝑗𝑡 𝜖 {0,1} ∀ 𝑛𝜖𝑆, 𝑗𝜖𝐷, 𝑡𝜖𝑆𝑐 (13)
35
As mentioned before, the math model has a total of three objectives. First one is (1) minimization of total expected distribution distance. Second one is (2) total expected earthquake damage risk factor minimization of SA. Third one is (3) minimization of total expected unsatisfied demand penalty for TSA. Constraint (4) is the distribution constraint that SA cannot distribute more shelter than stored. Constraint (5) is demand constraint that satisfies required shelter amount of TSA and prevents infeasibility with the help of unsatisfied demand variable. Constraint (6) is basic location-allocation constraint that assign “1” to variable Bnjt if related SA sends shelter to TSA. Constraint (7) is for fixed SA (already opened storage areas). Constraint (8) is the coverage distance restriction for distribution operation. Constraint (9) forbids the model to assign “1” to variable Bnjt if related storage area is not used. Constraints (10) to (13) present types of decision variables.
As the multi-objective decision making method, normalized weighted sum (weighting) method was implemented due to simplicity. The model has two stages since SA will be located before earthquake and distribution of shelters will be realized after earthquake. In the next chapter, solution approach for mathematical model was presented.
36
Chapter 4
Solution Approach
As the multi-objective decision making method, normalized weighted sum method was used due to simplicity. The mathematical model was written in “zpl” format with ZIMPL programming language, and solved with Scip Solver version 3.1.
4.1 Normalized Weighted Sum (Weighting) Method
There are several techniques such as Weighted Sum, Goal Programming, Compromise Programming (C-P), Reference Point Method, etc. to solve multi objective models. These techniques are the most widely used multi-objective decision making methodologies (Romero et al., 1998). The original C-P method aims to minimize distance between feasible objective vectors and ideal objective values (Zeleny, 2011). In C-P method, when p value is chosen as “1”, objective function turns into normalized weighted sum problem which is going to be used in this thesis in order to solve objective functions simultaneously and obtain efficient solutions (Ruiz, 2014). Each objective function is individually minimized to obtain ideal and nadir points for each scenario (Amiri et al., 2011).
37
Multi objective problem (MOP) was defined as follows:
𝑀𝑖𝑛 {𝑂1(𝑥), 𝑂2(𝑥), 𝑂3(𝑥)} (14) 𝑠. 𝑡. 𝑐𝑜𝑛𝑠𝑡𝑟𝑎𝑖𝑛𝑡𝑠 (4) − (13)
Useful definitions related to MOP (14) are given below (Samanlioglu, 2012).
A MOP, min f(x) = {f1(x), f2(x),..., fk(x)} s.t. x X is assumed to have k (k
2) competing objective functions that are to be minimized simultaneously.
Definition 1: A decision vector x’ X is efficient (Pareto optimal) for MOP if there does not exist a x X, x x’ such that fi(x) fi(x’) for i = 1,...,k with strict inequality holding for at least one index i. (x’ X is efficient, fi(x’) is non-dominated.)
Definition 2: A decision vector x’ X is weakly efficient (weakly Pareto optimal) for MOP if there does not exist x X, x x’ such that fi(x) < fi(x’) for i = 1,...,k. (x’
X is weakly efficient, fi(x’) is weakly non-dominated.)
Each objective function is solved separately in order to determine its ideal point which is presented by Oi* and its nadir point which is represented by Oin. Nadir point is the worst possible value of an objective function corresponding to the entire Pareto optimal set. It is also defined as upper bound of the Pareto optimal set (Samanlıoglu, 2012).
Objective functions were scaled (normalized) and normalized weighted sum method was used as follows;
38 𝑍 = [𝑊1∗ 𝑂1− 𝑂1∗ |𝑂1∗− 𝑂 1𝑛|+ 𝑊2∗ 𝑂2− 𝑂2∗ |𝑂2∗− 𝑂 2𝑛|+ 𝑊3∗ 𝑂3− 𝑂3∗ |𝑂3∗− 𝑂 3𝑛|] (15) Subject to Constraints (4) – (13) 𝑊ℎ𝑒𝑟𝑒, 0 < 𝑊𝑖 < 1, 𝑖 = 1. .3 𝑎𝑛𝑑 ∑ 𝑊𝑖 𝑖=3 𝑖=1 = 1.
Wi is importance of each objective function and they are assigned by decision maker. Weights take value between 0 and 1 and sum of all weights are equal to one. The solution of normalized weighted sum problem is efficient (Pareto optimal) if all weights are positive. (Marler and Arora, 2009)
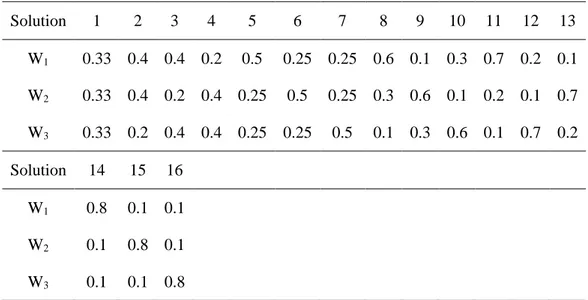
In this thesis, well-dispersed weights are used in order to have sample efficient solutions. Stuer's (1986) method is used for weight vector generation process. First, a specified amount of weight vectors are generated randomly and then, they are filtered to obtain well-dispersed weight vectors. After that, normalized weighted sum model (15) is solved with all well-dispersed weight vectors and sample efficient solutions are gathered. One of the efficient solutions is chosen to create sample inventory and distribution plan. However, in reality, decision makers have to choose the most preferred solution from solutions pool to implement it. So, implemented solution could be different from our selected solution based on decision maker’s preferences. Well dispersed 16 weight vectors can be seen in Table 4.1.
39
Table 4.1 Well dispersed 16 weight vectors
Solution 1 2 3 4 5 6 7 8 9 10 11 12 13 W1 0.33 0.4 0.4 0.2 0.5 0.25 0.25 0.6 0.1 0.3 0.7 0.2 0.1 W2 0.33 0.4 0.2 0.4 0.25 0.5 0.25 0.3 0.6 0.1 0.2 0.1 0.7 W3 0.33 0.2 0.4 0.4 0.25 0.25 0.5 0.1 0.3 0.6 0.1 0.7 0.2 Solution 14 15 16 W1 0.8 0.1 0.1 W2 0.1 0.8 0.1 W3 0.1 0.1 0.8
Mathematical model (15) was written with ZIMPL programming language (Koch, 2004) and Scip Solver version 3.1 was used to obtain sample efficient solutions using the listed weights by solving the mathematical model (15) for each time with different set of weights. ZIMPL form of model (15) can be seen in Appendix. However, first ideal and nadir points need to be calculated.
4.2 Calculation of Ideal and Nadir Points
To be able to solve the model (15), first each objective function need to be solved separately as it is discussed in section 4.1. By changing only objective function part in the ZIMPL form of model (15), three different ZIMPL models that each one contains one of the objective functions (O1, O2, O3) were created. For each scenario, ideal and nadir points were calculated and ranges of each objective function were determined. After determining all ideal and nadir points and ranges, for each set of weights and event scenarios, problem (15) was solved and efficient solutions were obtained.
40
Chapter 5
Application and Results
In this chapter, related data and application of mathematical model (15) in Kadıköy pilot area was presented.
5.1 Application Area
Kadıköy is one of the biggest districts of Istanbul and it was chosen as pilot area because during disaster there is a chaos environment, so trying to manage emergency plans at top level for the whole city might create managerial problems and may trigger more chaos in the city. Instead of that, all districts should have their own emergency plan, and they should be managed by district municipality. Another reason is that Kadiköy may suffer high damage from the expected earthquake and it has long seaside which makes it more risky in terms of potential tsunami.
5.2 Data and Input file generation
In this section, necessary data was presented. Raw data was collected from following sources; IMM, Kadiköy Municipality and The JICA Report. Finding appropriate data for the mathematical model might be troublesome. Therefore, appropriate and useful data was generated from raw data. Required data is as follows;
41
List of schools, their neighborhood, capacity and risk factors.
Distance Matrix between potential SA and TSA.
In the following sections, each data was presented respectively.
5.2.1 Temporary Shelter Area Data
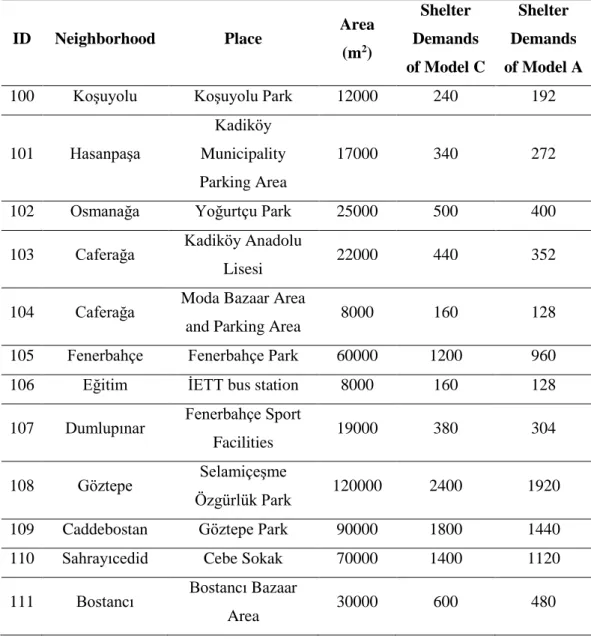
Temporary shelter areas were determined by IMM Disaster Coordination Center (AKOM) and they were mostly the biggest parks in the district. Related data was provided by Kadiköy Municipality. TSA were listed and all related data was given in Table 5.1. There are 12 places for survivors’ temporary accommodation. ID number was given to these 12 places to describe them in the model. Neighborhood column in Table 5.1 shows which neighborhood of Kadiköy each temporary shelter area belongs to. Place column defines TSA and indicates types of area. Area column shows total size of the TSA and scenario based demands are listed in the last two columns of Table 5.1.
Amount of required shelters (demands) were calculated by IMM according to the sizes of TSA and those quantities were used as demands for worst-case earthquake scenario (model C). As it was mentioned in Chapter 3, model A indicates lesser damage compared to model C so shelter requirement will be low as well. Therefore, a multiplier was used to calculate demands of model A by comparing number of heavily damaged buildings of earthquake scenarios. Model C has 2313 units of heavily buildings and model A has 1944 units (JICA, 2002). There is 17 % difference between scenarios in terms of heavily damaged buildings. Seismic intensity will also be lower in model A. So, model A’s demand was assumed to be
42
approximately 20 % lower than Model C’s demand. Scenario based demands can be seen in Table 5.1.
Table 5.1: Data of Temporary Shelter Areas
ID Neighborhood Place Area (m2) Shelter Demands of Model C Shelter Demands of Model A
100 Koşuyolu Koşuyolu Park 12000 240 192
101 Hasanpaşa
Kadiköy Municipality Parking Area
17000 340 272
102 Osmanağa Yoğurtçu Park 25000 500 400
103 Caferağa Kadiköy Anadolu
Lisesi 22000 440 352
104 Caferağa Moda Bazaar Area
and Parking Area 8000 160 128
105 Fenerbahçe Fenerbahçe Park 60000 1200 960
106 Eğitim İETT bus station 8000 160 128
107 Dumlupınar Fenerbahçe Sport
Facilities 19000 380 304
108 Göztepe Selamiçeşme
Özgürlük Park 120000 2400 1920
109 Caddebostan Göztepe Park 90000 1800 1440
110 Sahrayıcedid Cebe Sokak 70000 1400 1120
111 Bostancı Bostancı Bazaar
Area 30000 600 480
5.2.2 Storage Area Data
As it is stated earlier, storage areas are public schools in Kadiköy and list of the state schools was obtained from Kadiköy municipality. However, we needed to generate risk factors, penalty costs and capacities of storage areas. Risk factors and penalty costs are calculated using hazard maps that were given in Chapter 3.
43 5.2.2.1 Risk Factor Generation
First of all, hazard maps were scaled in size and numbers were given to each neighborhoods of Kadiköy. In this way, risk colors of each neighborhood were determined. Figure 5.1 shows risk colors according to the expected number of damaged buildings. Neighborhoods are listed according to the numbers given in this figure. Figure 5.1 and 5.2 are hazard maps of model A, and Figure 5.3 and 5.4 are for model C. First, model A’s risk factors are going to be calculated.
Before beginning to generate risk factors, weight factors should be assigned to colors.
Red color means very high risk and the weight factor is assigned as 5
Orange color means high risk and the weight factor is assigned as 4
Yellow color means moderate risk and the weight factor is assigned 3
Green color means low risk and the weight factor is assigned as 2
Blue color means very low risk and the weight factor is assigned as 1
List of neighborhoods and all related data were given in Table 5.2 and Risk factor of each neighborhoods for Scenario A was generated by taking average of damaged building factor, seismic damage factor and closeness to sea side factor because it was assumed that all of these factors have equal importance. As it is seen in the table, another factor that was taken into account is “Closeness to Sea Side”. It is the risk factor of damage by tsunami. Earthquake is expected to occur in Marmara Sea, because of that, if tsunami occurs, south shores of Istanbul might be damaged. Areas close to sea could be damaged higher than far ones (Tsunami Damage Mapping Team, 2011).