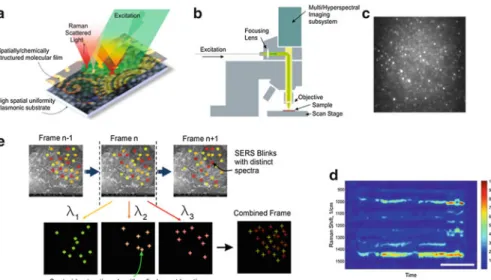
Hyperspectral stochastic optical reconstruction Raman microscopy for label-free super-resolution imaging using surface enhanced Raman spectroscopy
Tam metin
Şekil

Benzer Belgeler
The smokers’subjective life stress(school events, family events,and events related disturbance) had siginificant higher non-smokEvery semester, the school should evaluate
We propose a novel data stream ensemble classifier, called Geometrically Opti- mum and Online-Weighted Ensemble (GOOWE), which assigns optimum weights to the component classifiers
In the same year Gruffudd ap Llywelyn became king of north Wales, and after devastating Llanbadarn, drove Hywel out of his territory.. In 1041 Hywel made an effort to win
The table reveals that the sectors with the highest shares of total value added of the manufacturing sector were petroleum and coal, 12.49 percent; textiles, 12.29 percent;
Başka ifadeyle, sözlü kültürden farklı olarak, kargışa neden olan eylem de, o eyleme karşı koyuş da, yazılı kültürün sınırları içinde olup bit-
bantl seyrek sinyallerin Nyquist limiti altnda örnekleyerek, sk¸strlm¸s alglama teknikleri ile kaypsz olarak saysalla¸strl- masn saglayan Kiplemeli Geni¸s Bant
Starting from the conduction band (CB) mini- mum at the G point, we trace the POP scattering rates of the CB electrons, assuming a very high electric field applied along a
Miller’s “ Arti fi cial Agents, Cloud Computing, and Quantum Computing: Applying Floridi’s Method of Levels of Abstraction ,” Richard Lucas’ “ Levels of Abstraction
