INVESTIGATION OF TURKISH STUDENTS’ PERFORMANCE
IN MATHEMATICS, READING AND
SCIENCE LITERACY IN THE PISA 2012 DATA
A MASTER’S THESIS
BY
CEREN ÖZBAY
THE PROGRAM OF CURRICULUM AND INSTRUCTION
İHSAN DOĞRAMACI BİLKENT UNIVERSITY ANKARA MAY 2015 CEREN ÖZ B AY 2015
COM
P
COM
P
INVESTIGATION OF TURKISH STUDENTS’ PERFORMANCE IN MATHEMATICS, READING AND SCIENCE LITERACY
IN THE PISA 2012 DATA
The Graduate School of Education of
İhsan Doğramacı Bilkent University
by
Ceren Özbay
In Partial Fulfilment of the Requirements for the Degree of Master of Arts
in
The Program of Curriculum and Instruction İhsan Doğramacı Bilkent University
Ankara
İHSAN DOĞRAMACI BİLKENT UNIVERSITY GRADUATE SCHOOL OF EDUCATION
INVESTIGATION OF TURKISH STUDENTS’ PERFORMANCE IN MATHEMATICS, READING AND SCIENCE LITERACY
IN THE PISA 2012 DATA Ceren Özbay
May 2015
I certify that I have read this thesis and have found that it is fully adequate, in scope and in quality, as a thesis for the degree of Master of Arts in Curriculum and
Instruction.
--- Asst. Prof. Dr. İlker Kalender
I certify that I have read this thesis and have found that it is fully adequate, in scope and in quality, as a thesis for the degree of Master of Arts in Curriculum and
Instruction.
--- Prof. Dr. Alipaşa Ayas
I certify that I have read this thesis and have found that it is fully adequate, in scope and in quality, as a thesis for the degree of Master of Arts in Curriculum and
Instruction.
---
Asst. Prof. Dr. Semirhan Gökçe
Approval of the Graduate School of Education ---
iii
ABSTRACT
INVESTIGATION OF TURKISH STUDENTS’ PERFORMANCE IN MATHEMATICS, READING AND SCIENCE LITERACY
IN THE PISA 2012 DATA
Ceren Özbay
M.A., Program of Curriculum and Instruction
Supervisor: Asst. Prof. Dr. İlker Kalender May 2015
Every student needs to be provided a certain minimum level of acquisition in the education system. Hence, this study investigated differences in students’
performance in mathematics, reading and science literacy among the school types and geographical regions in Turkey by using PISA 2012 data. In this research, MANOVA was employed using Multivariate Linear Model procedure of SPSS. The aims of the research were to examine if there are any differences among Turkish students’ performance that live in different geographical regions in Turkey in terms of mathematics, reading and science literacy and also to examine whether there are any differences among Turkish students’ performance in mathematics, reading and science with respect to the school types or not. Analyses of the current study based on PISA 2012 data showed that Turkish students’ performance in mathematics, reading and science differed significantly across the geographical regions and school types. The major difference was observed among school types.
Key Words: PISA 2012, mathematics literacy, science literacy, reading literacy, geographical regions in Turkey, school types in Turkey
iv
ÖZET
TÜRKİYE’DEKİ ÖĞRENCİLERİN MATEMATİK, FEN BİLİMLERİ OKURYAZARLIĞI VE OKUMA BECERİLERİNDEKİ PERFORMANSLARININ
PISA 2012 VERİSİNE GÖRE İNCELENMESİ Ceren Özbay
Yüksek Lisans, Eğitim Programları ve Öğretim Tez Yöneticisi: Yrd. Doç. Dr. İlker Kalender
Mayıs 2015
Eğitim sisteminde, her öğrencinin derslerinde belirlenmiş minimum düzeye ulaşmasının sağlanması gerekir. Bu çalışma PISA 2012 verileri kullanılarak,
Türkiye’deki öğrencilerin matematik okuryazarlığı, okuma becerileri ve fen bilimleri okuryazarlığı performansları arasındaki farklılıkları hem okul türü bazında hem de coğrafi bölge bazında araştırmaktadır. Bu araştırmada, MANOVA tekniği
kullanılarak analizler gerçekleştirilmiştir. Araştırmanın amaçlarından ilki; yaşadıkları farklı coğrafi bölgeler dikkate alındığında Türk öğrencilerin matematik, okuma ve fen okuryazarlığı perfomanslarında anlamlı bir fark olup olmadığını incelemektir. Diğer amaç ise Türk öğrencilerin matematik, okuma ve fen bilimlerindeki
performansları arasında gittikleri okul türleri açısından anlamlı bir fark olup olmadığını araştırmaktır. Bu çalışmanın sonuçları, PISA 2012 sonuçları göz önüne alınarak Türk öğrencilerin matematik, okuma ve fen bilimleri performanslarında hem coğrafi bölgeler hem de okul türleri arasında anlamlı bir farklılık olduğunu
göstermiştir. Başlıca fark ise okul türü değişkeninde gözlenmiştir.
Anahtar kelimeler: PISA 2012, matematik okuryazarlığı, fen bilimleri okuryazarlığı, okuma becerileri, Türkiye’deki coğrafi bölgeler, Türkiye’deki okul türleri.
v
ACKNOWLEDGEMENTS
I would like to offer my sincerest appreciation to Prof. Dr. Ali Doğramacı and Prof. Dr. Margaret K. Sands, and to all members of the Bilkent University Graduate School of Education community for supporting me throughout the program.
My deepest gratitude is to my official supervisor, Asst. Prof. Dr. İlker Kalender, for his effort to assist me in patience and devote his time throughout the process of writing this thesis. I am extremely grateful for his suggestions and support. I would also like to thank and offer my sincere thanks to members of my committee, Prof. Dr. Alipaşa Ayas and Asst. Prof. Semirhan Gökçe for their comments and feedback about my thesis. I would also like to acknowledge Bobby Seagull, who was my contact on the high school mathematics teacher training course at Cambridge University, for all his invaluable help.
I am also thankful to my friends particularly my close friends Hüseyin Diler, Seda Ak Diler, Burcu Özbay Özfırat and classmates in Bilkent University. Their support and care helped me overcome setbacks and stay focused on my study. I greatly value their friendship and I deeply appreciate their belief in me.
The final and the most heartfelt thanks are for my wonderful family, my grandfather KAHRAMAN ÖZBAY, my grandmother SANİYE ÖZBAY, my father
HAYRETTİN ÖZBAY, my mother GÜLCAN ÖZBAY, my brother FERDİ ÖZBAY and my fiancé MİKAİL KIRBOĞA for their endless support, motivation and
encouragement. None of this would have been possible without the love and patience of my family. I dedicate this thesis to my family
vi TABLE OF CONTENTS ABSTRACT ... iii ÖZET... iv ACKNOWLEDGEMENTS ... v TABLE OF CONTENTS ... vi
LIST OF TABLES ... viii
LIST OF FIGURES ... ix CHAPTER 1: INTRODUCTION ... 1 Background ... 2 Problem ... 4 Purpose ... 5 Research questions ... 6 Significance ... 6
CHAPTER 2: REVIEW OF LITERATURE ... 7
Introduction ... 7
Turkish students’ performance in national exams ... 7
International benchmarking studies ... 9
TIMSS ... 10
PIRLS... 11
PISA ... 11
PISA results of Turkey ... 15
Factors affecting mathematics, science and reading literacy of students ... 17
Geographical regions in Turkey ... 17
School types in Turkey ... 19
CHAPTER 3: METHOD ... 21
Context ... 21
Research design ... 22
Participants ... 22
Instrumentation ... 23
Method of data collection ... 24
Methods of data analysis ... 27
vii
Findings ... 29
Differences in mathematics, reading, and science scores across geographical regions ... 30
Differences in mathematics, reading, and science scores across school types ... 36
CHAPTER 5: DISCUSSION ... 44
Introduction ... 44
Overview of study ... 44
Discussion of major findings ... 44
Geographical regions ... 45
School type ... 47
Implications of practice ... 51
Implication for further research ... 51
Limitations ... 52
REFERENCES ... 53
APPENDICES ... 64
APPENDIX 1: PISA 2012 items ... 64
viii
LIST OF TABLES
Table Page 1 Brief information about included school types………...25 2 Summary of six proficiency levels with minimum scores for mathematics, reading and science literacy……….29 3 Proficiency levels, means and standard deviations for mathematics, reading and science literacy with respect to geographical region………...31 4 Mean differences between OECD mean score and both mathematics, science and reading mean score across the geographical regions………..34 5 Turkish students’ performance in mathematics, reading and science literacy with respect to geographical regions………..….36 6 Proficiency levels, means and standard deviations for mathematics, reading and science literacy with respect to school type……….………...37 7 Mean differences between OEDC mean score and both mathematics, science and reading mean score across the school type……….40 8 Turkish students’ performance in mathematics, reading and science literacy with respect to school type………..………42
ix
LIST OF FIGURES
Figure Page
1 Sample size of geographical regions………..25
2 Sample size of school types………27
3 Mean scores of mathematics among geographical regions………32
4 Mean scores of reading among geographical regions……….32
5 Mean scores of science among geographical regions……….33
6 Mean scores of mathematics among school type………38
7 Mean scores of reading among school type………38
1
CHAPTER 1: INTRODUCTION
There can be many factors that affect achievement of students such as family background, motivation, or school type. To give an example, Demir, Ünal and Kılıç (2010) investigated the effect of technological and non-technological educational resources on students’ achievement. Their research concluded that there were positive relationships between technological and non-technological educational resources and students’ achievement. There is also some research showing that there is a positive correlation between socio-economic status and students’ achievement (Kalende & Berberoğlu, 2009; Shah, Atta, Qureshi, & Shah, 2012).
In order to observe those types of differences, each student should be provided a certain minimum level of acquisition in the education system (OECD, 2014). For example, National Council of Teachers of Mathematics (NCTM) (2000) defined some principles and standards for mathematics education in which it focused on every student deserving to access the concepts of mathematics equally. So, at the end of their education, they can have an equal chance to learn mathematics according to their own learning levels. Similarly, the National Council of Teachers of English (NCTE) (2013) stated the standards that all the students should have the same opportunities in order to improve their skills. Moreover National Research Council Report (2011) emphasized that if equal learning opportunities are provided, all the students will be capable of practicing in science even if they have diverse
backgrounds.
The school type can be also considered as one of the factors that affects students’ achievement. As of March 2015, there are 13 different school types in Turkey which
2
is categorized into two institutions as general secondary education and vocational and technical secondary education. General secondary education covers general, Anatolian, Anatolian teacher training, science, social science, fine arts and sports and also private high schools. Vocational and technical secondary education includes Imam Hatip, Anatolian Imam Hatip, vocational and technical, private education vocational and also special vocational high schools (MEB, 2015). Therefore, it is expected that as the number of school type increase, the achievement levels of the students are spread out over a wider range.
Geographical regions where students live and the type of school which students attend are the two variables focused upon in this research. This study aims to investigate whether the differences in students’ achievement are originated either from geographical region (which is also an indicator of the socio-economic level) or from school type. In this framework, Program for International Student Assessment (PISA) 2012 data set is used in order to examine students’ mathematics, reading and science literacy levels in Turkey.
Background
Turkish students demonstrate low achievement in many circumstances. One of them is nation-wide exams. In the Turkish education system, there are mainly two
important exams. One of them is administered at the end of secondary school which is called TEOG (transition system from primary to secondary education). The other one is taken at the end of high school as a two-stage exam system: YGS (Transition to Higher Education Examination) and LYS (Undergraduate Placement
Examination) (ÖSYM, 2014a). There may be differences in students’ achievement in those exams. To give an example, Bahar (2013) stated that there was a statistically
3
significant difference in students’ performance in university entrance exam dependent on the school types in Turkey.
In addition to national exams, Turkish students also perform poorly in international benchmarking studies, such as the PISA tests. It is a survey that was launched by the Organization for Economic Co-operation and Development (OECD) since 2000 and it is administrated once every three years. It assesses the key competencies such as mathematics, reading and science literacy that contribute to the successes of 15 years old students, within an internationally accepted common framework. In addition to that, PISA survey tests cover science, reading and mathematics literacy. PISA also assessed financial literacy in 2012. There are plenty of questionnaires in PISA which are mainly grouped as student- related questionnaires, family-related questionnaires and school-related questionnaires (OECD, 2014). All of those questionnaires include many factors affecting students’ mathematics literacy in PISA (Akyüz & Pala, 2010). In addition, the Ministry of National education report (2013) indicated that although Turkey has shown a progression in mathematics, science and reading literacy in PISA since participating in the test, Turkey has performed below the OECD average for each PISA test.
The mathematics literacy result in PISA is important because it refers to making connections between mathematics and real life and making mathematical judgments rather than assessing content knowledge of students (OECD, 2006). Reading literacy is also crucial for individuals to be able to develop their mental capacity to
understand and interpret what they read (OECD, 2007). Finally, scientific literacy can be defined as the awareness of characteristics features of science and if one can have scientific literacy skills then it is expected from him/her to define science-related questions, to explain reasons behind it and to be interested in science-science-related
4
issues such as environmental issues refers to scientific literacy (OECD, 2009). So, as a result of scientific literacy, students’-show an interest in science and the
environment.
Result showed that most of the Turkish students had even the basic literacy skills across all subject areas. The performance of Turkish students is not different as the results are compared with other international studies such as Trends in International Mathematics and Science Study (TIMSS) and Progress in International Reading Literacy Study (PIRLS). The studies in the literature showed that the lack of achievement is mostly explained by socio-economic status (Aikens & Barbarin, 2008). However, one of the problems in Turkish education system can be the
differentiation of school types. As of 2015, there are 23 different school types. Thus, type of school can be also considered as a factor by Berberoğlu and Kalender (2005) and the researchers examined the effects of school types and geographical regions on mathematics literacy of Turkish students by using PISA 2003 results. This study will also include geographical regions and school type as factors that affect students’ performance in literacies. Although the authors focused only on mathematics literacy of Turkish students, this study will include not only students’ mathematics literacy but also science and reading literacy of students in Turkey. This study will utilize recent information about these factors and Turkish students’ performance in mathematics, reading and science based on PISA 2012 results.
Problem
Every student deserves to have equal access to all the concepts of mathematics, reading and science and also teachers must provide the right circumstance for this situation to be feasible (NCTM, 2000; National Research Council, 2011; NCTE
5
2013).This condition is valid not only for mathematics but also for all the subject areas (OECD, 2013). In this framework, students should encounter equity in
education (OECD, 2014). It means that the schools in Turkey ought to provide equal accessibility to mathematics, reading and science literacy to improve students’ performance.
Students’ performances are generally both in national exams and international studies in Turkey (MEB, 2013a; ÖSYM, 2015b). There can be some reasons behind this issue. For example, geographical regions in Turkey may have different social, economic and environmental characteristics and the difference in those
characteristics can bring about many disadvantages, especially for eastern part of Turkey (Bülbül & Köse, 2010). Since the eastern part of Turkey is worse than the other parts of Turkey in YGS and PISA 2012, it is important to find out such differences in students’ performance across geographical regions.
Many school types also can bring about many different curricula among the schools. This means there can be some differences in curricula in terms of weekly courses hours, content of courses and level of courses among the school types in Turkey. Those differences can be one of the reasons behind such low achievement because Alacaci and Erbas (2010) stated that school type is important for the academic performance of students in Turkey.
Purpose
There are two purposes of this study, the first of which is to investigate how much students’ academic performance in mathematics, reading and science literacy vary statistically according to their location i.e. the geographical region based on PISA 2012 results. The second one is to examine how much the performance of Turkish
6
students in mathematics, reading and science literacy differs statistically according to the school types based on PISA 2012 results or not.
Research questions
Are there any significant differences among Turkish students’ academic performance according to their location i.e. different geographical regions of Turkey in terms of mathematics, reading and science literacy?
Are there any significant differences among Turkish students’ academic performance in mathematics, reading and science with respect to their school types?
Significance
The present study is expected to reveal statistically significant information as to the sources of achievement differences in Turkey across three subjects: mathematics, science and reading. Although socio-economic status is mostly stated as one of the main factors explaining the achievement differences, having a large number of school types in education system may also create a problem in setting a minimum standard for all students. Thus, the current study compares the literacy level differences across regions and school types.
7
CHAPTER 2: REVIEW OF LITERATURE
Introduction
Turkey has participated in some international studies to measure Turkish students’ achievement like PISA. According to OECD (2014) report, Turkish students performed below average in PISA 2012 for mathematics, science and reading
literacy. This is not the first time that the averages of Turkish PISA scores were low. As Kilic, Cene and Demir (2012) stated, Turkish students had also the lower
performance in mathematics literacy in PISA 2009.
In the light of these issues, this chapter focused on the literature reviewing information about national and international studies, international benchmarking studies, Turkish students’ performance both in national and international studies and in general.
Turkish students’ performance in national exams
In the Turkish education system, students have to take exams in order to enter high schools and universities (ÖSYM, 2009a). In the recent years, there have been some major changes in these exams in terms of both content and sessions (“University entrance exam”, 2009).
There are some examples to highlight the changes. For example, while student selection examination was just a one-stage multiple choice test system and then it was turned into two-stage multiple choice exam system in 2010 (ÖSYM, 2009b). The first exam is YGS. It is administered in April and aimed to measure high school
8
learning outcomes of Turkish students (ÖSYM, 2014b). The score of YGS ranges from zero to 500. The students who get threshold score (greater than or equal to 180) from YGS, they can take LYS in June (ÖSYM, 2015a). There are also five sessions within the LYS which are science, social sciences, mathematics, Turkish and foreign language. Afterwards students are allocated to departments of universities according to their scores and preferences (MEB, 2013a).
Interesting results were also obtained in the last YGS, in 2015. For instance, there were 1.986.995 students who participated in exam but only 68.89% of the students got the score ranging from 180 to 500 (ÖSYM, 2015b). As students who wish to partake in higher education are supposed to take the exam YGS, the number of students who get threshold score from YGS should be higher. In addition to that, YGS covers major subjects which are Turkish, foreign language, social studies, basic mathematics and science (ÖSYM, 2013). So it was expected that all the students attending YGS should get at least the score 180 without taking into consideration which school they go or which geographical region they live in (Kartal, 2009).
In addition, some previous national exam results demonstrated that there were big differences among means of different school types. To give an example, 2014 LYS results can show clearly such differences (ÖSYM, 2015a). After categorizing students’ score according to their area like mathematics-science, Turkish-mathematics and Turkish-social studies, differences in schools’ mean score
appeared. When the mean scores of science high schools were 373.306, general high school had only 199.983 mean score for the area mathematics-science. Moreover, although social science high schools give importance to social science courses, they could not exceed the mean score of science high schools (360.272) with their score 337.246 in LYS 2014 according to the area Turkish-mathematics. There was the
9
same case in the area Turkish-social studies. Science high school had the greatest mean score (365.216) among the different types of schools (ÖSYM, 2014a).
In general, it can be expressed by taking into consideration the YGS 2015 and LYS 2014 results that there can be large differences in students’ achievement level across school types in Turkey. Some students do not get even the minimum threshold score (180) to continue their education at the universities.
Turkish students had low scores not only in university entrance examinations and in national studies but also in the international benchmarking studies as well.
International benchmarking studies
There are many international studies across the world. Turkey participates in some of them such as TIMSS, PIRLS and PISAprojects periodically in order to examine whether the desired quality of education is applied in a contemporary manner or not (EARGED, 2005).
The Ministry of National Education also stated that participating in these enables Turkey to establish to what extent they are making progress in education at both national and international levels. In addition to standardized tests, there are some student, teacher and school related questionnaires which are applied to students in those international tests. According to this feedback and information, what students know or what to extend students reach the learning-outcomes can be determined (MEB, 2013a). Moreover, there is a chance to contrast and compare Turkish education system with other education systems in terms of educational policies, teaching strategies, qualification of teachers and materials used in classes (MEB, 2013b).
10
There are many differences among the international studies TIMSS, PILRS and PISA in terms of subjects that they measure, years that they are applied to and the age range of students that they address (Rindermann, 2007). Basic characteristics of the tests are given in the following paragraphs as well as the Turkish students’ academic performance in these tests.
TIMSS
TIMSS is an international assessment that has measured mathematics and science skills of both fourth and eighth grade students around the world. TIMSS has been administered every four years since 1995. It was applied by the International Association for the evaluation of Educational Achievement (IEA) in order to compare the achievement of students (IEA, 2015a).
Turkey joined TIMSS in 1999 the first time (EARGED, 2003a) and participated in the last administration in 2011 most recently (IEA, 2015b). The results are
remarkable and showed that Turkey got higher scores gradually for eight graders (Büyüköztürk, Çakan, Tan, & Atar, 2014). Despite of the fact that Turkey had 452 points from mathematics, it was below the TIMSS average score (500) (IEA, 2012a). TIMSS 2011 results also emphasized that mathematics scores varied across the geographical regions of Turkey but Turkish students could not reach the TIMSS mean score in any of the regions. Whilst the Marmara region had the greatest mean score (465), the southern Anatolian region had the lowest mean score (416) in TIMSS 2011 (MEB, 2014b).
In addition, science score in Turkey (483) was also below the TIMSS mean score (500) (IEA, 2012b). However, this time Black sea region reached the TIMSS mean
11
score with the greatest mean score (500) across the geographical regions. Southern Anatolian region also had the lowest mean score (447) again (MEB, 2014b).
In conclusion, there is a gap among geographical regions in Turkey in terms of mathematics and science scores in TIMSS 2011 results. Such differences provide evidence for the existence of inequality in education among students from different locations of Turkey.
PIRLS
PIRLS has measured only the reading knowledge of only fourth graders since 2001.The study has been developed within years by IEA. In contrast to TIMSS, PIRLS has been conducted every five years (Mullis, Martin, Gonzalez, & Kennedy, 2003). The aim of the study is to gather information about students’ academic knowledge in reading and emphasize the factors increasing students’ achievement in reading (Elley, 1994).
In addition to that, prePIRLS has started to be conducted in 2001. The aim of the study is to give chance to developing countries for assessing reading performance of their students. It has the same characteristics with PIRLS except the difficulty level of questions IEA (2013). PrePIRLS is less difficult than PIRLS.
Lastly, Turkey participated in PIRLS just when it was first conducted, in 2001. PIRLS 2001 results resembled TIMSS results such that Turkey had a lower score (449) than the PIRLS mean score (500) (EARGED, 2003b).
PISA
PISA is one of the international studies that has been organized by the OECD. It was developed in 1997 but it has been conducted since 2000. In contrast to TIMSS and
12
PIRLS, PISA has been administered once every three years. Since countries have different curricula and education systems, the test is given to 15 years-old students in PISA (OECD, 2003).
In addition to that, the PISA study is more comprehensive than TIMSS or PIRLS. It has measured not only students’ performance in mathematics and science literacy but also their performance in reading literacy among the OECD countries. Although it puts emphasis on one of those three subjects in PISA in the year when it is applied, students have items to solve from all of three subjects: mathematics, reading and science. During the last PISA administration conducted in 2012, financial literacy of young people and problem solving assessment were included for the first time and that was optional for countries (OECD, 2014).
Furthermore, the achievement of students is defined by the OECD in a different way. According to OECD achievement in mathematics, science or reading is to find out how much students can apply their knowledge of these areas in real life situations rather than determine students’ academic knowledge (OECD, 2012). That is why PISA uses the term “literacy” instead of the term “achievement” or “success”. PISA has also assessed some of the key competencies that contribute to the successes of students, within an internationally accepted common framework (Pons, 2011). This means PISA aims to search in order to provide a basis for collaboration of teachers in defining and implementing educational goals in terms of mathematics, reading and science literacy.
PISA defines mathematics literacy as the capacity of students to make connections between mathematics and real life, to make mathematical judgments. According to PISA, mathematics literacy is the ability of students to express mathematics
13
problems in their own words (OECD, 2006). It refers to that students are expected to go beyond the mathematics taught in schools, find their own way to solve problems and connect mathematics to real life (Ilbagi & Akgun, 2013).
In addition to that, PISA focused on mathematics literacy in 2003 for the first time. Then, mathematics literacy was the focus in PISA 2012 again (OECD, n.d.). So, countries had chances to observe the differences in students’ mathematics performance through the years (Thomson, Cresswell, & De Bortoli, 2004).
In addition, in PISA 2012 it was the first time that mathematics covered an optional computer-based test (OECD, 2014). This means, students could use computers to respond the PISA items in addition to paper-based test which depended on the question types such as multiple-choice or open-ended.
The content of mathematics is determined according to their relevancy and connectivity in real situations and context. It is also related to the performance of students and countries. In general, mathematics content has consisted of quantity, space and shape, change and relationships and uncertainty in PISA since 2000 (Neidorf, Binkley, Gattis, & Nohara, 2006). Additionally in PISA 2012 one more topic called “data” was included (OECD, 2014).
According to PISA, reading literacy is an individual’s mental ability to understand and interpret what they read in order to reach their own aims. Moreover, reading literacy is described as the capability of young people to use and engage with what is written in text in to be a part of society (OECD, 2006). This means PISA measures to what extent students connect their reading knowledge to real life.
Reading literacy was the first major subject of PISA both in 2000. Then it became a major subject in 2009 again. PISA also takes into consideration the attitudes of
14
students towards reading and their learning strategies to reading through student questionnaires which were quite useful for the assessment of students’ performance in reading (OECD, 2010b). For example, there is a strong relation between the students’ performance in reading and their wide range of reading activities (Guthrie, 2008). Skinner, Kindermann and Furrer (2009) stated that lower achievement in reading at school work may stem from less practicing in reading or ineffective learning strategies. Thus, PISA results showed that students’ achievement in reading does not only depend on their academic knowledge.
Reading content has covered both continuous texts and non-continuous texts in PISA since 2000. PISA 2012 also covered mixed and multiple texts. Continuous texts include mainly different types of prose like narrative prose and argumentative prose. In contrast to continuous text, non-continuous texts consist of graphs, forms and lists. In addition to that, the combination of continuous and non-continuous texts
comprises mixed text and finally the aim of multiple texts is also to compare
independent texts with each other (OECD, 2010c). Because PISA has different types of questions which is a kind of multiple intelligence activity, students can engage with the PISA questions rather than school work and improve their reading skills (Burman & Evans, 2003).
PISA describes scientific literacy in many ways. Initially, scientific literacy is to be aware of the characteristics features to make up science. Scientific literacy and science cannot be thought of as a separate entity. In addition to that, scientific literacy means that students should be able to define science-related questions, explain reasons behind it and be interested in science-related issues such as environmental issues (OECD, 2007).
15
The major subject was science for PISA 2006 assessment. Science literacy will be the major area in the 2015 administration. In addition, PISA 2006 showed some results that pointed out the differences among school type in Turkey. For example, Alacaci and Erbas (2010) indicated how different that the students’ performances in science among the schools are.
The content of science test includes mainly the following subjects: physics, chemistry, biological sciences, and earth and space sciences (Fensham, 2009). However, the content may change for the following PISA according to the new trends in education and economies. For example, in PISA 2009 science content was composed two parts as knowledge of science and knowledge about science but there was no such a categorization in PISA 2012. In addition to that, items do not ask for being recalled the whole topic of those subjects; they are integrated with the content of the items (OECD, 2014). In a nutshell, this content was organized in order to engage science with real life situations.
PISA results of Turkey
Rankings of Turkey can range according to international studies. To begin with, there were 42 participating countries for eight graders in TIMSS 2011 with Turkey ranking in 24th in mathematics (452 mean score), 21st in science (483 mean score). It means that although Turkey’s means score for mathematics and reading was below the TIMSS means score (500). Turkey showed improvement in science and
mathematics from TIMSS 1999 to TIMSS 2011. To give an example, Turkey had 429 mean score in mathematics in 1999 and 23 points increase was observed in TIMSS 2011 in mathematics means score of Turkish students (Oral & McGivney, 2013).
16
In addition to that, Turkey participated in the PISA in 2003 for the first time and in that assessment nearly 28% of the students in Turkey could not even reach the minimum proficiency level in mathematics as defined by the PISA scale (National Education Publications, 2005). Moreover, Turkey had 424 mean score in
mathematics literacy in PISA 2006 when the OECD average was 500 (Baldi, Jin, Green, & Herget, 2007) which means that Turkey still performed below the OECD average. In the following exam, Turkey increased its mathematics mean score to 445 (OECD, 2010a)
In addition to that, according to Aksit (2007), PISA 2003 results indicated that both private and public schools in Turkey performed below the OECD average with 441 mean score in reading literacy. In PISA 2006, Turkey had 447 mean score which means that Turkey could not reach OECD average. Although Turkey increased its reading result in PISA 2009, it could not pass through the average of OECD countries again with 464 mean score (EARGED, 2010a).
Although the OECD international mean score was 500 with 100 standard deviation, Turkey had just the score 434 in science literacy in PISA 2003. The results differed from geographic regions and school types (EARGED, 2005). In PISA 2006, the main focus was the scientific literacy. Turkey still performed under the average of OECD countries with 425 mean score in PISA 2009 (EARGED, 2010a). In addition, Turkey increased the science mean score to 455 in PISA 2009 (EARGED, 2010b).
Finally, according to PISA 2012 results, Turkey generally performed better in mathematics, reading and science literacy compared with previous PISA
administrations. To give an example, Turkey was ranked in 44th in mathematics literacy with 448 mean score in PISA 2012 (OECD, 2014). It means that Turkey
17
showed a progress in mathematics performance but ranking could not be improved when it was compared to previous PISA results. Reading mean score of Turkey also increased (475) with ranking in 42th (Yıldırım, Yıldırım, Yetişir, & Ceylan, 2013). Moreover, Turkey had 463 mean score with ranking in 43th in science literacy in PISA 2012 (MEB, 2013). This shows that Turkey indicates progress in science literacy.
Factors affecting mathematics, science and reading literacy of students
Questionnaires administered during PISA study can mainly be grouped as student-related questionnaires, family-student-related questionnaires and school-student-related
questionnaires. All of those questionnaires include many factors affecting students’ mathematics, reading and science literacy in PISA (Akyüz & Pala, 2010; Anagün, 2011; Yıldırım, 2012). This study will focus on geographical regions and school types in Turkey as factors that affect students’ performance in mathematics, reading and science literacy based on PISA 2012 data.
Geographical regions in Turkey
Turkey is divided into geographical regions: Aegean Region, Black Sea Region, Central Anatolia Region, Eastern Anatolia Region, Marmara Region, Mediterranean Region and Southeastern Anatolia Region in 1941 based on some factors like socio-economic issues, habitat, transportation and climate (Darkot, 1955). These kinds of factors may bring with it some drawbacks and it may impact students’ achievement in many ways.
To begin with, it was found that education levels of parents had a positive effect on students’ performance in mathematics literacy based on PISA 2003 results (Akyüz &
18
Pala, 2010). Gürsakal (2012) also focused on the same issue based on PISA 2009 results and stated that parents’ educational level was one of the important factors for students’ achievement level. There is a link between education level of parents and the regions where they live and generally parents who lived in eastern part of Turkey are less-educated compared with the western part (Tunç, 2009).
In addition, Kasapoglu (2014) indicated that, there is a positive correlation between education levels of parent and students’ performance in reading literacy by using PISA 2006. The study showed especially the importance of mothers’ level of education on students’ achievement. The author also focused on the effect of economic background of the families on students’ achievement by taking into consideration school quality factor. Aikens and Barbarin (2008) also claimed that there was an impact of socioeconomic status on children's early reading. The authors demonstrated that if the socio economic status of the family is better, then students can take the advantage in reading in terms of school conditions or home
environment. So it is important for students’ performance in reading where they live, what kind of facilities they can reach.
Some research results demonstrated that low-income is one of the factors that have an effect on students’ performance in science literacy (Baratelli, West-Olatunji, Pringle, Adams, & Shure, 2007). PISA 2006 also resulted that families’ economic background can also impact students’ science literacy performance because there is a link between socio-economic status and having a computer at home (Özer & Anıl, 2011). Western parts of Turkey have higher socio economic status (Bülbül & Köse, 2010) so it is more probable that people living there can supply these types of technological equipment in for their children to improve their achievement.
19
In general, there can be differences in students’ achievement with respect to geographical regions in Turkey. However, Berberoğlu and Kalender (2005) stated that geographical regions do not affect Turkish students’ achievement as much as school type based on PISA 2013 results.
School types in Turkey
In PISA 2012, there were 12 different school types in Turkey that participated in. They were basically general high school, Anatolian high school, science high school, and Anatolian teacher training high school, social science high school, vocational high school, Anatolian vocational school, technical high schools, Anatolian technical high school, multi program high school, and police training high school (OECD, 2012). Although it is not the only reason that affects students’ performance, there is research that reported the effect of school type on students’ achievement (Berberoglu & Kalender, 2005; Fındık & Kavak, 2013).
First of all, Alacacı and Erbaş (2010) indicated that because schools’ qualities differed in Turkey, school types had great effects on students’ mathematics
performance based on PISA 2006 results. In addition to that some research showed school climate was also an important factor to improve mathematics literacy (Demir, Kılıç, & Depren, 2009). Since school climate and school type are related to each other, students can get disadvantage to improve their own achievement just because of school-related factors. For example, students who enter private school instead of a public school can get better opportunity to access higher education because most of the private schools give importance to school climate mostly (Nata, Pereira, & Neves, 2014).
20
In addition to that, differentiated instruction can act an important role in students’ reading performance. According to related research, implementation of differentiated instruction affects students’ achievement in terms of their reading skills in a better way (Little, McCoach, & Reis, 2014). However, differentiated instruction is mostly applied in private schools. So, students who go to private school or can reach school materials quickly can get more advantage to increase their performance in reading (Thapa, 2015).
There are also some school-based factors like teacher quality and adequacy of physical and instructional materials in the literature. All those factors can influence students’ performance (UNICEF, 2000). To give an example, Ercan (2014) focused on the importance of accessibility and use of technology in science classrooms. The author also indicated that there is positive effect using multimedia learning material on students’ science achievement of students. However, some teachers in some schools in Turkey may not use technology in their classes although they have the technological devices in classrooms (Seferoğlu, 2009). It can be easier for the private schools to use technology in classes (Demirci, Taş, & Özel, 2007). So, there can be differences among students’ science performance and students may not reach all the concepts of science (National Research Council, 2011).
In conclusion, reviewing the literature makes it easier to draw a picture of the factors related to Turkish students’ performance in mathematics, science and reading all with respect to different school types. In addition, there are also differences in students’ performance in both national and international exams among the
geographical regions. There are many researches showing that socio-economic status of families and education level of parents are important factors of students’
21
CHAPTER 3: METHOD
In this chapter, methodological issues are presented. First of all, context and sample are described and then methods of data collection are given. Finally, methods of data analyses are stated.
Context
PISA 2012 data will be used in this study. The study includes 4848 Turkish students aged 15 from all the geographical regions who participated in PISA 2012 (OECD, 2013).
In modern societies, application of knowledge learned in classes both in and outside of school is crucial as much as acquisition of knowledge. For this reason PISA focuses not only on what students know but also what students can do by using their prior knowledge across countries. Based on PISA results, educators and policy makers can realize how important and acceptable it is increasing students’ performance. This assessment gives also opportunity to find out similarities and differences among countries’ education system (OECD, 2014).
Moreover, PISA has some exclusive features. To give an example, PISA can be a guide for countries to follow their progression. One of the characteristics of PISA is the breadth of its coverage. It means that PISA is administered in many countries. In PISA 2012, there were around 510 000 students from 34 OECD member countries and 31 partner countries and economies (OECD, 2014).
22
Research design
This study is a quantitative research in which causal-comparative research method is used. Causal-comparative research method determines cause (or effect) that has occurred and looks for effect (or cause) from it (Fraenkel, Wallen, & Hyun, 1993).It means that, the effect is the main focus on causal comparative research.
Participants
In this study, Turkish students participating in PISA 2012 were used as sample. In Turkey, the PISA sample is determined according to the number of 15-year-old students and schools that they attend. All the information is taken from the Ministry of Education, Department of Strategy Development and sent to an international statistics firm (Westat) in order to determine the sample. The firm uses lamination techniques to determine the schools that participate in PISA by taking into
consideration some criteria such as 12 statistical regions or school type in Turkey. Then, 35 students are selected randomly by using a computer program called KeyQuest because 35 students from each school were expected to participate in PISA (MEB, 2011). In light of this issue, 4848 Turkish students of 170 schools were selected from 56 provinces in 12 statistical regions in PISA 2012 (MEB, 2013b).
Because of differences among countries and their education system, it is hard to compare students’ performance on key subject areas internationally based on their grade levels across countries. So, PISA determined a particular age range. Ages of participating students were between 15 years three months and 16 years two months. Participating students must be studying for at least six years officially and can be any private schools, public school, vocational and academic programmes (OECD, 2014).
23
Instrumentation
The PISA 2012 data set will be used in this study which includes student questionnaire and cognitive booklets as instruments (Grønmo & Olsen, 2006).
Tests in the PISA study consist of multiple-choice and open-ended items from mathematics, reading and science literacy. They are all related to real life situations because literacy is not about students’ academic achievement within school. It is not just about exam grades. It refers to students’ capacity to make a connection between real life and those main subjects (mathematics, reading and science) (OECD, 2006). To sum up, literacy measures how much of knowledge is used in daily life.
In addition, students have two-hours to complete the paper-based test. Test items have different combinations for different students. To give an example,there are at least 13 different booklets for each country in PISA 2012 (OECD, 2014).
Finally, students are supposed to take a background questionnaire that covers some information about themselves, their families, homes, schools and their learning activities. It takes 30 minutes. In addition to that, school principals answered a questionnaire which is related to the school system and learning environment. There also some optional questionnaires for parents. It covers some questions about their child’s career expectations, their support for learning and involvement in their child’s education. In addition to that, there are two more questionnaires for students that are mainly related to their use of information technology and thoughts about future careers (OECD, 2014). In addition to that, Turkish students answered only the main student questionnaire and the school principal answered their own questionnaire (Yıldırım, Yıldırım, Yetişir, & Ceylan, 2013). Sample PISA paper-based test items can be found in Appendix 1.
24
Method of data collection
PISA data on students’ performances in mathematics is used in the study. Anyone with access to this PISA 2012 data set can do analysis accordingly.
School coordinators are in charge of communication between students and the PISA National Centre in case of participation. They create a list that comprises the name of all the 15-years of students from their schools and send it PISA National Center in the country. The PISA National Centre chooses 35 students randomly and informs school coordinators. Then, school coordinators contact selected students and their parents to get permission (OECD, 2014).
Generally, the PISA National Centre appoints test administrators in order to conduct the test session of PISA. The test administrator and school coordinator determine together the date and time of the test. Then, the test administrator distributes different booklets to different students. The test administrator is also responsible for sending the booklets to the PISA National Centre (OECD, 2014). In Turkey, all processes of PISA are carried out by the Ministry of National Education (Yıldırım, Yıldırım, Yetişir, & Ceylan, 2013).
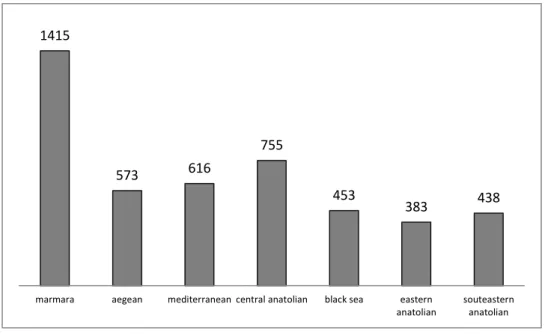
Data in PISA 2012 was gathered from all 12 statistical regions in Turkey which is called Nomenclature of Territorial Units for Statistics (NUTS). However, in this study NUTS of Turkey was converted to seven geographical regions which are Marmara, Aegean, Mediterranean, Central Anatolia, Black sea, Eastern Anatolia and Southeastern Anatolia. Figure 1 shows the sample size of each geographical region.
25
Figure 1. Sample size of geographical regions.
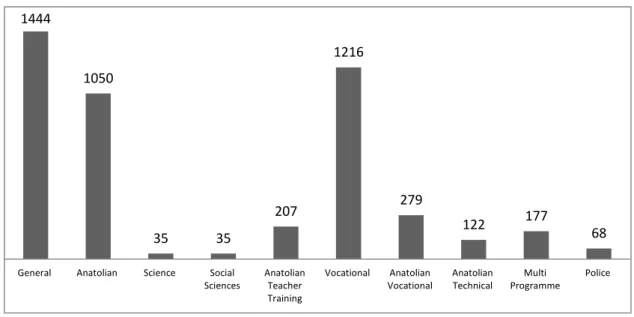
As a second independent variable, school type in Turkey was used. There are many types of school in Turkey. In PISA, data was collected from 12 different school types in Turkey. In the following, there is some information about schools in which PISA 2012 was conducted. In this study, primary school and technical high school were excluded because their sample size was small. Table 1 gives a brief explanation for each school type included in the present study. In addition to that, Figure 2 showed the numbers of students attending to the test from different schools.
Table 1
Brief information about included school types
General high school Any students who complete eight years of education can enter without taking any entrance exam. The school supports development of students’ general knowledge and citizenship consciousness.
Anatolian high school
Students have to take entrance exam in order to enter these schools. It is four-years long including one year English education. 1415 573 616 755 453 383 438
marmara aegean mediterranean central anatolian black sea eastern anatolian
souteastern anatolian
26 Table 1 (cont’d)
Brief information about included school types
Science high school These schools admit high ability students with entrance exams. Generally, students are trained for higher education in science, technical or medical fields.
Social Sciences high school
Those schools put emphasis on social science courses.
Anatolian Teacher Training high school
Those schools give importance to teacher training education. Students take history of education, education theory and methodology in general.
Vocational high school
Graduates can go on higher vocational education at the end of this school without taking any university entrance exam. Anatolian
Vocational high school
Students are prepared for employment in those schools. They attach importance to foreign language learning of students.
Anatolian Technical high school
Those schools are a sub-type of Anatolian schools that offer technical courses such as electronics and communications. Multi Programme
high school
Those schools contain general, vocational and technical schools’ curriculum.
Police high school Selective students are trained to be police officers in those schools.
27
Figure 2. Sample size of school types.
Methods of data analysis
In this study, Statistical Package for the Social Sciences (SPSS) was used for data analysis. Multivariate Analysis of Variance (MANOVA) was employed by Multivariate Linear Model procedure of SPSS. Independent variables were
geographical regions and school types, while three dependent variables were Turkish students’ mathematics, science and reading literacy scores. Due to the fact that there are three dependent variables, two-way MANOVA was preferred in order to
minimize type1 error.
Before conducting MANOVA, means of mathematics, reading and science literacy for both each geographical region and school type in Turkey were calculated. Then, one sample t-tests were conducted in order to compare means of mathematics, reading and science scores with respect to geographical regions and school types with OECD mean score (500 points) (OECD, 2014). After that, means of Turkish students’ mathematics, science and reading literacy scores were examined according to school types and geographical regions in Turkey through MANOVA.
1444 1050 35 35 207 1216 279 122 177 68
General Anatolian Science Social Sciences Anatolian Teacher Training Vocational Anatolian Vocational Anatolian Technical Multi Programme Police
28
Effect size was assessed using partial eta squared (η2
). In addition to that the size of effect is categorized as small, medium or large. When the value of η2
is around .02, there may be a small affect. If effect size is around .13, it may be a medium effect and finally .26 or more than that means large effect (Cohen, 1988). All analyses were conducted at 0.05 significance level.
Prior to MANOVA, statistical assumptions were checked (Huck, 2011). The first assumption is that the measurement of two or more dependent variables needs to be at interval or ratio scale. This assumption was considered to be satisfied because mathematics, science and reading literacy are continuous variables. Secondly, the assumption that independent variable should be divided into two or more categories. This study includes two independent variables, school types and geographical regions in Turkey. School types consist of 12 categorical independent groups and geographical regions include seven categorical independent groups in this study. Another assumption is the independence of observations. Because PISA is applied under the responsibility of the Ministry of National Education, required measures were taken to ensure that there was no interaction among students. Since the total sample size in this study was 4848, it was assumed that the number of observations was sufficient to conduct a MANOVA. Since it was not feasible to check all dependent and independent variables for normality, only dependent variables were investigated against normality and the results indicated that normality was held. And last, the assumption that there should not be a relationship among independent variables. It refers to the lack of multicollinearity. Inter-item correlations were checked. There was no correlation coefficient above 0.80.
29
CHAPTER 4
In this chapter, results of the analyses conducted were presented.
Findings
In PISA 2012, mathematics, reading and science scores were set as 500 points with a standard deviation of 100. The scale was also divided into levels which were
determined by the range of difficulty of the tasks based on the outcomes of PISA 2003. The lowest level is level 1 and the highest level is level 6. Those levels are called as proficiency levels. Table 2 shows the summary descriptions proficiency levels of mathematics, reading and science literacy. Detailed descriptions of the proficiency levels are given in OECD (2014).
Table 2
Summary of six proficiency levels with minimum scores for mathematics, reading and science literacy
P. L. Mathematics Reading Science
1 (the lowest
level)
Students can typically answer questions that are clearly defined. They also can recognize the
information and apply what they learn through familiar procedures (358). B (the lowest level within reading)
Students can make simple connections between the given information and figures in text. Texts generally include repetition of information with figures or familiar symbols (262).
Students can describe obvious scientific explanations. Students can define limited scientific information (335).
A Students can find out the main idea or purpose of author in text. Students can also link between
information in the text and daily knowledge (335).
2 Students can interpret results literally. Students can use basic algorithms and formulas to solve problems (420).
Students can compare information in the text and everyday knowledge. Students can make inference to gather pieces in the text (407).
Student can give adequate scientific information in order to draw solution by facilitating simple investigation (409).
3 Students can use calculation techniques in an appropriate way. (482).
Students can combine some piece of information which refers to multi-cases in order to find main idea and
understand the concept of idioms and phrased used in the text (480).
Students can provide a clear scientific knowledge within the context. (484).
30
Differences in mathematics, reading, and science scores across geographical regions
According to PISA 2012 results, mathematics proficiency levels in Turkey show many variations within geographical regions. Table 3 represented the range from level 1 to level 2. It refers to that although students can answer well-defined questions, they can have difficulties in using basic formulas including geometric properties to solve questions or justifying answers. In addition to that, Table 2 shows students’ proficiency levels in reading vary from level 2 to level 3 within the
geographical regions. Students can make connections along a text, but it can be challenge for students to evaluate the text critically or to go beyond content of the Table 2(cont’d)
Summary of six proficiency levels with minimum scores for mathematics, reading and science literacy
P. L. Mathematics Reading Science
4 Students can link between two dimension objects and three
dimension objects. Students also can compare and these type of questions by using geometric rules (545).
Students can think the text as a whole. Students can also evaluate the long and more complex text in a critical way by using categorization (553).
Students can link between scientific issues and daily life based on taking into consideration of the role of science or technology. Students can reflect their experiences within the scientific context (559).
5 Students can use theorems in order to solve problems. Students can analyze questions through appropriate assumptions (607).
Students can evaluate the text critically. Students can understand unfamiliar and detailed content of the text fully (626).
Students can use scientific contents in complex life situations. Students can evaluate those situations with appropriate scientific evidence (633). 6 (the highest level)
Students can solve mixed multiple representations based questions. Students can also justify their finding and generalize them (669).
Students can go beyond the text in order to apply their sophisticated and deeply understanding. Students can also handle unfamiliar ideas within multiple inferences (698).
Students can justify their conclusion with scientific evidence. Students can also reflect their scientific and critical thinking on more complex personal, social and global situations (708).
31
text to find the main idea. Finally, according to Table 3, proficiency levels in science do not differ so much. It is at level 2 for all geographical regions. It means that students have adequate scientific knowledge within the context. However, they can have problems to integrate scientific context on more complex life situations or global issues.
Table 3
Proficiency levels, means and standard deviations for mathematics, reading and science literacy with respect to geographical region
Geographical regions
Mathematics Reading Science
M SD P.L. M SD P.L. M SD P.L. Marmara 469.460 94.412 2 493.750 83.720 3 482.304 80.220 2 Aegean 463.582 87.889 2 490.244 76.262 3 475.549 76.262 2 Mediterranean 445.104 96.616 2 474.553 91.248 2 463.973 79.535 2 Central Anatolian 473.320 94.873 2 498.468 84.034 3 481.856 80.450 2 Black sea 431.009 82.664 2 465.276 78.359 2 456.737 70.935 2 Eastern Anatolian 417.221 79.083 1 454.316 77.959 2 440.201 70.745 2 Southeastern Anatolian 398.151 77.069 1 429.765 75.721 2 416.717 67.986 2
Note: P.L.: Proficiency level
In addition to that, mathematics, reading and science mean scores were compared with the OECD mean score (500 points) all across the geographical regions. Figure 3 showed that mathematics mean scores in almost all the geographical regions did not reach the OECD mean score. Science mean scores of Turkish students were also below the OECD mean score in Figure 4 for all geographical regions. Figure 5 also indicated that reading mean scores had the same result with mathematics and reading mean scores. Any of literacy means’ scores were not relative to the OECD mean score all across the geographical regions.
32
Figure 3. Mean scores of mathematics among geographical regions.
33
Figure 5. Mean scores of science among geographical regions.
One-sample t-test indicated statistically significant difference in mathematics, reading and science score among the geographical regions except reading score in Central Anatolian. It means that the reading score in Central Anatolia was relative to OECD mean score. However, Table 4 showed that mathematics, reading and science mean scores were below the OECD mean score.
The analysis of the data indicated that differences between the OECD means and means for all three subject areas are becoming larger from west to east.
34 Table 4
Mean differences between OECD mean score and both mathematics, science and reading mean score across the geographical regions
According to MANOVA results, geographical region was found to be a significant factor (Wilks’Λ= .978, F (6, 4633) = 5.780, p < .05). Effect size for the geographical region was small (η2=.008).
Explained variances were found to be .587 (Adjusted R Squared = .583), .473 (Adjusted R Squared = .468), and .508 (Adjusted R Squared = .504) for
mathematics, reading, and science literacy, respectively. These values refers to the variation in geographical regions explaining a significant amount of variability of students’ literacy scores.
Geographical
Regions in Turkey Literacies
Test Value = 500
T df Sig. (2-tailed) Mean Difference
Marmara Mathematics -12.168 1414 .000 -30.540 Reading -2.808 1414 .005 -6.250 Science -8.298 1414 .000 -17.696 Aegean Mathematics -9.919 572 .000 -36.418 Reading -3.062 572 .002 -9.756 Science -7.350 572 .000 -24.451 Mediterranean Mathematics -14.102 615 .000 -54.896 Reading -6.922 615 .000 -25.447 Science -11.242 615 .000 -36.027
Central Anatolian Mathematics -7.727 754 .000 -26.680
Reading -.0501 754 .617 -1.532
Science -6.197 754 .000 -18.144
Black Sea Mathematics -17.763 452 .000 -68.991
Reading -9.432 452 .000 -34.724
Science -12.981 452 .000 -43.263
Eastern Anatolian Mathematics -20.485 382 .000 -82.779
Reading -11.468 382 .000 -45.684
Science -16.542 382 .000 -59.799
South Eastern Anatolian Mathematics -27.658 437 .000 -101.849
Reading -19.412 437 .000 -70.235
35
In addition to that, MANOVA results showed there are statistically significant differences of students’ performance in mathematics (F (6, 4633) = 12,832, p <0.05), reading (F (6, 4633) = 7.726, p < 0.05) and science (F (6, 4633) = 9.807, p < 0.05) literacy all across the geographical regions in Turkey. Moreover geographical region had an effect on students’ performance in mathematics literacy (η2= .17). For reading literacy, effect size was estimated as large (η2=.10) and for science literacy, it was also estimated as large (η2=.13) respectively. MANOVA results also indicated that there is a statistically significant difference of students’ performance in mathematics literacy among all geographical regions except Marmara and central Anatolian region (p > .05), Aegean and Black sea region (p>.05), Eastern Anatolian and Southeastern Anatolian region (p > .05). Table 5 shows mean differences between regions. MANOVA results pointed out that there is also a statistically significant difference of students’ performance in reading literacy among all geographical regions except Marmara and central Anatolian region (p > .05), Aegean and Black sea region (p>.05), Eastern Anatolian and Southeastern Anatolian region (p > .05) and also Mediterranean region and Central Anatolian (p >.05). Table 5 showed mean difference of reading scores among the schools. In addition, based on mean differences between regions on Table 5 , it can be seen that there is a statistically significant difference of students’ performance in science literacy among all
geographical regions except Aegean and Black sea region (p>.05), Eastern Anatolian and Southeastern Anatolian region (p > .05) and also Mediterranean region and Central Anatolian (p > .05).
36 Table 5
Turkish students’ performance in mathematics, reading and science literacy with respect to geographical regions
Geographical regions Mathematics Reading Science
I J M.D. (I-J) Sig. M.D. (I-J) Sig. M.D. (I-J) Sig. Marmara Aegean 34.863 .000 25.631 .000 30.179 .000 Mediterranean 15.747 .000 9.474 .040 13.157 .002 Central Anatolian 1.312 .741 2.325 .568 8.568 .021 Black sea 39.730 .000 24.880 .000 29.851 .000 Eastern Anatolian 75.740 .000 47.033 .000 60.311 .000 South Eastern Anatolian 80.346 .000 62.722 .000 59.372 .000 Aegean Mediterranean -19.116 .000 -25.631 .000 -17.022 .000
Central Anatolian -33.551 .000 -23.306 .000 -21.611 .000
Black sea 4.867 .494 -.750 .918 -.328 .961
Eastern Anatolian 40.878 .000 21.403 .000 30.132 .000 Southeastern Anatolian 45.484 .000 37.091 .000 29.193 .000 Mediterranean Central Anatolian -14.435 .003 -7.148 .155 -4.589 .317
Black sea 23.983 .001 15.407 .044 16.694 .017 Eastern Anatolian 59.993 .000 37.560 .000 47.154 .000 Southeastern Anatolian 64.599 .000 53.248 .000 46.215 .000 Central Anatolian Black sea 38.418 .000 22.555 .002 21.283 .001
Eastern Anatolian 74.428 .000 44.708 .000 51.743 .000 Southeastern Anatolian 79.034 .000 60.396 .000 50.804 .000 Black sea Eastern Anatolian 36.011 .000 22.153 .006 30.460 .000 Southeastern Anatolian 40.617 .000 37.841 .000 29.521 .001 Eastern Anatolian Southeastern Anatolian 4.606 .602 15.688 .084 -.939 .910
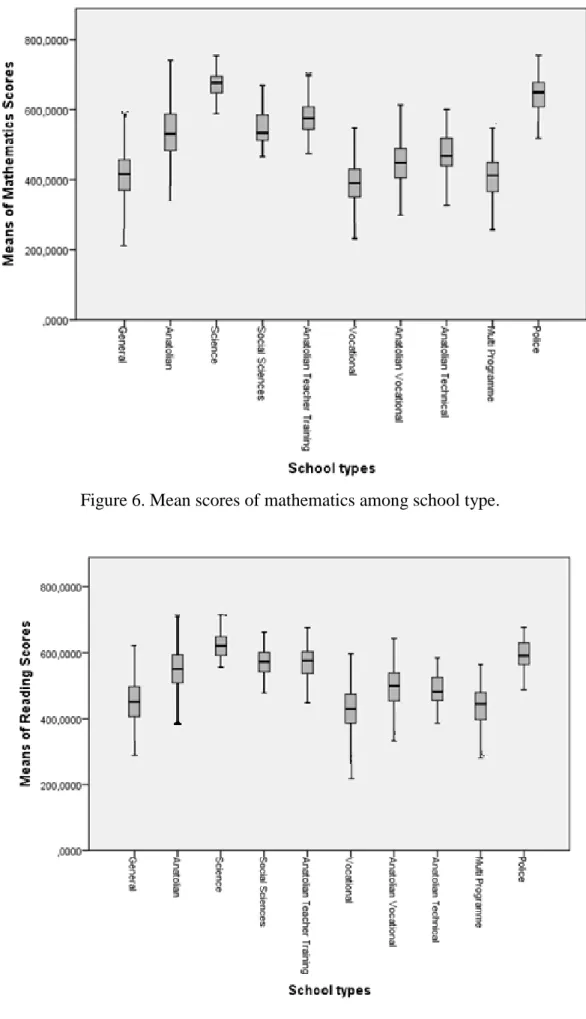
Differences in mathematics, reading, and science scores across school types
To begin with, Table 6 showed that proficiency levels vary within the school types more than it happens in the geographical regions. To give an example, there is a wide range of mathematics proficiency levels across the school type in Turkey in PISA 2012. It ranges from level 1 to level 6. Table 6 stated that nevertheless some students in vocational high school may not solve questions that they are not familiar with, some students in science high school can go beyond the scope of the questions by justifying their answers. Moreover, Table 6 indicated proficiency levels in reading differ from level 2 to level 4. Science literacy has also the same situation with