Journal of Instrumentation
Brightness and uniformity measurements of plastic
scintillator tiles at the CERN H2 test beam
To cite this article: S. Chatrchyan et al 2018 JINST 13 P01002
View the article online for updates and enhancements.
Related content
Radioactive source calibration test of the CMS Hadron Endcap Calorimeter test wedge with Phase I upgrade electronics
S. Chatrchyan, A.M. Sirunyan, A. Tumasyan et al.
-Tests of CMS hadron forward calorimeter upgrade readout box prototype
CMS HCAL collaboration
-The performance of the CMS muon detector in proton-proton collisions at s TeV at the LHC
The CMS collaboration
-2018 JINST 13 P01002
Published by IOP Publishing for Sissa Medialab
Received: October 3, 2017 Revised: December 4, 2017 Accepted: December 13, 2017 Published: January 5, 2018
Brightness and uniformity measurements of plastic
scintillator tiles at the CERN H2 test beam
The CMS HCAL collaboration
E-mail: [email protected]
Abstract: We study the light output, light collection efficiency and signal timing of a variety of organic scintillators that are being considered for the upgrade of the hadronic calorimeter of the CMS detector. The experimental data are collected at the H2 test-beam area at CERN, using a 150 GeV muon beam. In particular, we investigate the usage of over-doped and green-emitting plastic scintillators, two solutions that have not been extensively considered. We present a study of the energy distribution in plastic-scintillator tiles, the hit efficiency as a function of the hit position, and a study of the signal timing for blue and green scintillators.
Keywords: Calorimeters; Radiation-hard detectors; Scintillators and scintillating fibres and light guides
2018 JINST 13 P01002
Contents 1 Introduction 1 2 Experimental area 2 3 Scintillators 3 4 Data samples 5 5 Charge analysis 5 6 Time analysis 7 7 Conclusion 8The CMS HCAL collaboration 12
1 Introduction
The analysis of the collision and calibration data collected by the CMS Collaboration at the end of Run-I (fall 2012) demonstrated that the light yield of the hadronic endcap calorimeter is decreasing due to radiation damage much faster than anticipated (e.g., [1], Ch. 3). In particular, it is estimated that the hadronic calorimeter will not be able to survive until the end of its originally planned lifetime without the replacement of part of its active material. Moreover, it is estimated that the material currently used is not radiation-tolerant enough to be usable for a replacement detector, since it would degrade too fast in the time interval between scheduled upgrades of the CMS detector. We set to investigate the performance of a few plastic scintillators that seem to offer an increased radiation tolerance with respect to SCSN-81, the scintillator currently used in the CMS hadronic calorimeter. The improved radiation tolerance is obtained in two different ways: increasing the concentration of the scintillating dopants; using green-emitting dopants instead of the more common blue-emitting ones. Increasing the dopant concentration has the effect of reducing the light yield of an unirradiated scintillator because light self-absorption by the dopant is increased. However, as radiation damages the scintillator base, and reduces its attenuation length, increasing the dopant concentration enhances the probability that light is wavelength-shifted by the dopant, and then more efficiently travels through the damaged base. A similar effect is obtained by using green-emitting dopants, in which the scintillation light is emitted at longer wavelengths, thus being less sensitive to damage in the scintillator base.
Experimental data are collected at the H2 test-beam area at CERN, where an asynchronous 150 GeV muon beam is available. We study the energy response, measured in units of integrated charge, of different scintillator tiles when they are traversed by high-energy muons, the detection
2018 JINST 13 P01002
efficiency as a function of the muon position on the tile, the integrated charge distribution in 25 nstime slices, and the distribution of the difference between the signal times of pairs of scintillator tiles. The last measurements are of particular interest for green-emitting scintillators, which are usually considered to be considerably slower than blue-emitting scintillators.
2 Experimental area
This experiment was conducted at the H2 Beam Line located at the North Area of the CERN accelerator complex, in the Prevessin site. The H2 Beam Line is serviced by the Super Proton Synchrotron (SPS). The SPS is capable of accelerating protons to 450 GeV; protons are then extracted from the SPS accelerator, and directed towards the T2 target. The emerging beam is filtered to remove secondary particles such as electrons, and the momentum of the remaining muons is selected to be 150 GeV.
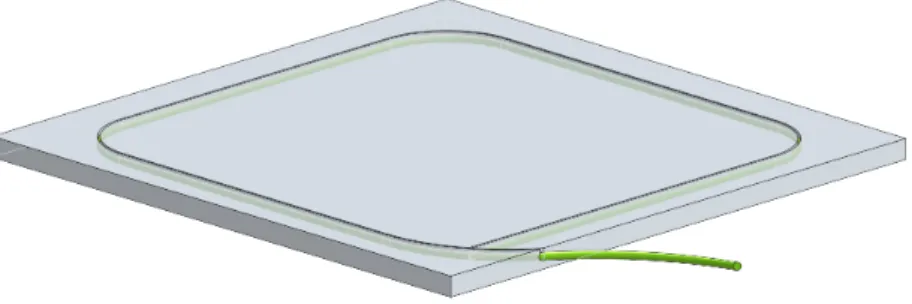
The devices under test are 100 × 100 × 4 mm3 plastic scintillator tiles. A σ-shaped groove is carved into each tile; a wavelength-shifting fiber (WLS) is installed inside the grooves, as shown in figure1. The plastic tiles are wrapped in Tyvek1paper, and enclosed in black-plastic 3D-printed
boxes, which offer two distinct services: they provide a support for the tile, thus reducing the risk of breaking a readout fiber by accident, and simplify keeping the tiles in a dark environment, thus reducing noise. The Tyvek wrapping has been demonstrated to enhance the light yield by a factor of two, by diffusing the light that reaches the scintillator walls back into the tile. The tiles are located on top of a moving table. The table is aligned in such a way that, as best as possible, the muon beam is centered in the middle of the scintillator tiles.
Figure 1. Drawing of a scintillator tile, including the WLS fiber installed inside a σ-shaped groove.
Prior to reaching the table, the beam path passes through several instruments for triggering and precise tracking. In order of increasing distance from the beam extraction point, the following instruments are installed: wire chamber “A”, wire chamber “B”, four large scintillating plastic trigger counters, and wire chamber “C”.
A trigger signal is produced by requiring a coincidence among selected trigger counters. The first and fourth trigger counters are 140 × 140 mm2, the second counter is 40 × 40 mm2, and the third counter is 20 × 20 mm2. In this analysis, the coincidence between the first and fourth trigger counters was used to select events. While this trigger selection is larger than the actual size of
2018 JINST 13 P01002
the tiles, the usage of tracking information from the wire chambers allows us to define during theanalysis whether a muon had crossed a tile or not.
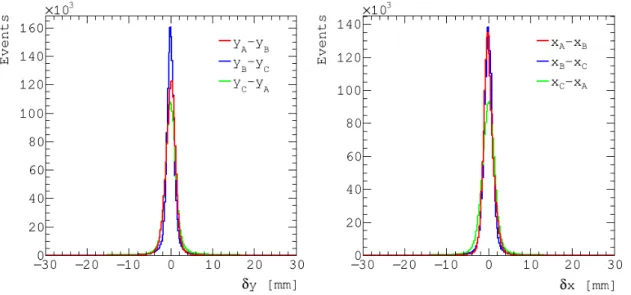
The three wire chambers are 100 × 100 mm2drift chambers, each of which has a resolution of about 0.5 mm in the x and y directions, perpendicular to the direction of the beam. The position measurements of the three chambers are used to determine the trajectory of each muon and hence its intersection point with each tile. An alignment procedure is established by assuming that the muons are moving along straight lines, and therefore that the distribution of position differences between pairs of wire chambers must be zero-mean Gaussian-distributed. Figure2shows the distribution of the position differences along the y and x directions for each pair of wire chambers, after the alignment corrections.
Figure 2. Hit position difference along the y (left) and x (right) directions between each pair of wire
chambers. The distributions contain an offset correction calculated assuming that muons are travelling along a straight line.
The data acquisition system is built with the front-end and back-end electronics designed for the Phase-I upgrade of the CMS hadronic calorimeter (HCAL). The system is described in detail in [2]. The light produced by the scintillator is transmitted via a wavelength-shifting fiber, connected to a plastic clear fiber, to a silicon photomultiplier (SiPM). The current pulse produced by the SiPM is integrated by a charge-integration-and-encoder (QIE;[2], Ch.3.1) chip, expressively designed for the CMS HCAL detector. The encoded signal is transmitted, via an optical link, to the back-end electronics; encoded signals from the QIE chips and the wire chambers are then built into events, which are saved to disk. The beam is asynchronous, in that muons are produced without a fixed timing structure in spills containing about thirty thousand muons within a 10 s window. About two spills per minute are provided.
3 Scintillators
The scintillators under test are cut in 100 × 100 × 4 mm3tiles, with a σ-shaped groove carved in the plastic, which holds a wavelength-shifting fiber. The materials at disposal include both commercial
2018 JINST 13 P01002
scintillators and specially-formulated ones. A sample of the scintillator used in the constructionof the current CMS HCAL system is also used, from the same production lot. This scintillator, SCSN-81, is not produced any more, but commercial equivalents are available. Table1summarizes the main features of the scintillators tested. The other scintillators under test are produced by Eljen Technology. [3] Studies of how radiation affects the transmission of light through some of these plastic scintillators have been presented in [4].
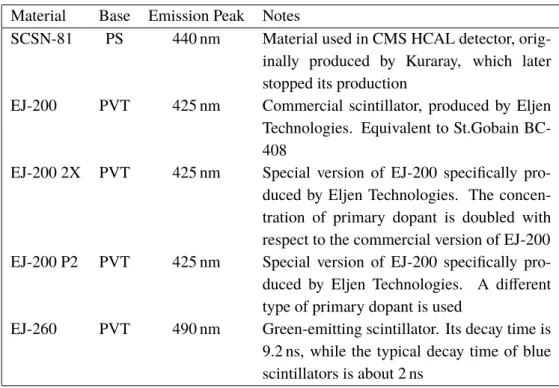
Table 1.Main characteristics of scintillators included in analysis. Material Base Emission Peak Notes
SCSN-81 PS 440 nm Material used in CMS HCAL detector, orig-inally produced by Kuraray, which later stopped its production
EJ-200 PVT 425 nm Commercial scintillator, produced by Eljen Technologies. Equivalent to St.Gobain BC-408
EJ-200 2X PVT 425 nm Special version of EJ-200 specifically pro-duced by Eljen Technologies. The concen-tration of primary dopant is doubled with respect to the commercial version of EJ-200 EJ-200 P2 PVT 425 nm Special version of EJ-200 specifically pro-duced by Eljen Technologies. A different type of primary dopant is used
EJ-260 PVT 490 nm Green-emitting scintillator. Its decay time is 9.2 ns, while the typical decay time of blue scintillators is about 2 ns
The majority of the tiles are fabricated from blue-emitting scintillator. The wavelength-shifting fiber that matches the peak of their emission is Y11, produced by Kuraray. The re-emitted light peaks at 476 nm, in the green range. EJ-260 is instead a green-emitting scintillator. It is matched to a O2 wavelength-shifting fiber, also produced by Kuraray. The emission peak of the O2 fiber is 538 nm, in the red/orange range. The emission spectra of the Y11 and O2 wavelength-shifting fibers are reported in [5], while the emission spectra of the EJ-200 and EJ-260 scintillators are reported in [3], respectively.2
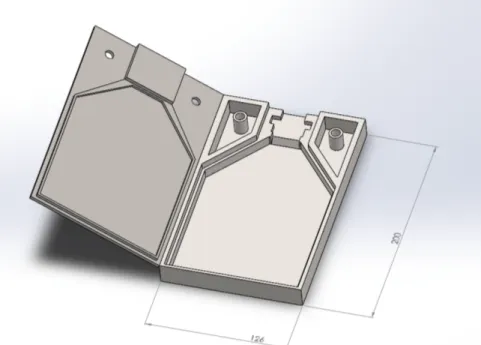
Each tile is individually housed inside a 3D-printed black plastic box. An example of this box is shown in figure 3. A scintillator tile is set inside the box, and its wavelength-shifting fiber is connected to an adapter firmly blocked by plastic supports. This setup greatly reduces the probability of breaking the wavelength-shifting fiber by inadvertently pulling or twisting the connector.
2The production of SCSN-81 has been discontinued, and no documentation about this scintillator is available on the Kuraray website. A copy of an old Kuraray catalog containing SCSN-81 spectra is available athttp://www.phenix.bnl. gov/WWW/publish/donlynch/RXNP/Safety%20Review%206_22_06/Kuraray-PSF-Y11.pdf.
2018 JINST 13 P01002
Figure 3. Drawing of a container for plastic tiles; its dimensions are expressed in millimeters.
4 Data samples
The data sample before any selection is about 5 million triggered events. Events are required to have a single muon hitting each of the three wire chambers. This ensures that the energy measurement correspond to a single MIP signal, and allows us to map the detection efficiency as a function of the hit position on a tile. This requirement selects a data sample of 1,416,624 events.
5 Charge analysis
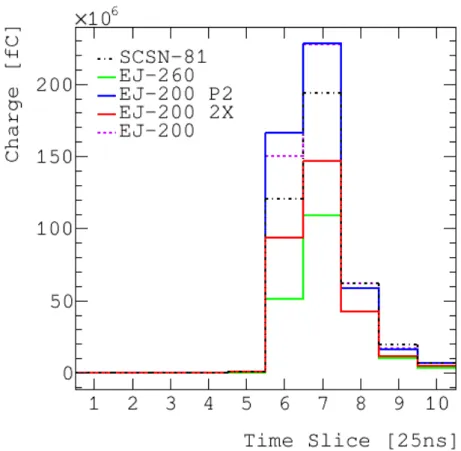
The energy loss of minimum-ionizing particles crossing a scintillator tile is reported in units of integrated charge. The DAQ system reports the energy measured in time slices corresponding to 25 ns each. Figure4presents the energy distribution per time slice, which shows that the energy corresponding to a hit is distributed in time slices 6 to 9. It also shows that all the channels corresponding to different scintillators are timed-in similarly; this allows us to select the same time slices for all scintillators. The plot also contains an indication that the EJ-260/O2 scintillator/WLS-fiber system is slightly slower than the others: its corresponding energy distribution is spread more among time slices. The fraction of integrated charge in the first two time slices (6-7) is 81% for the blue EJ-200 scintillator, and 74% for the green EJ-260 scintillator, with negligible uncertainties.
A more precise analysis of the arrival time structure of signals in different scintillators is presented in section6.
Integrated charge spectra report the following features:
• a pedestal peak, corresponding to signal observed when no particle hits the tile: electronic noise; SiPM dark current; light leaking into the tile. The pedestal peak is typically located below 25 fC.
2018 JINST 13 P01002
Figure 4. Distribution of integrated charge per 25 ns time slice in the whole data sample.
• a set of peaks extending up to a few thousand of femtocoulombs. These correspond to photo-electrons produced by the passage of a muon through the tile. It is interesting to note that the energy resolution of a SiPM allows us to distinguish each peak corresponding to a different number of photo-electrons.
We require that the integrated charge be larger than 25 fC to identify MIP hits. This requirement is set by observing an energy spectrum without any selection cut on the muon hit positions, i.e., without enforcing the passage of a muon through the tile.
Second, it is necessary to identify the position of the tiles with respect to the beam and the wire chambers. We perform a 2-dimensional measurement of the hit efficiency as a function of x and y. The hit efficiency is defined as the fraction of events in an x-y cell with an integrated charge larger than 25 fC.
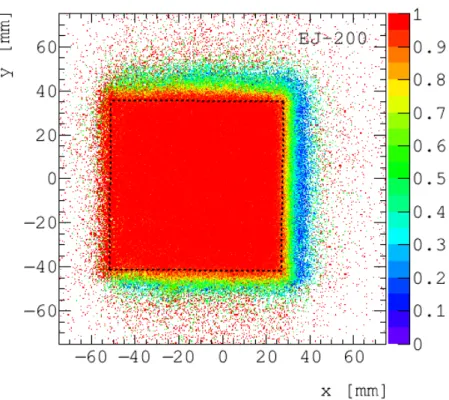
The efficiency map for the EJ-200 tile is shown in figure5; similar maps have been produced for the other tiles under test, and show the same features. It is clear from the map that as soon as a tile is centered, its hit efficiency exceeds 95%, and that the efficiency is rather uniform on the tile. This is a result of the σ shape adopted for the wavelength-shifting fiber. Its shape has been optimized to enhance uniformity of light-collection efficiency. [6]
The efficiency maps allow us to determine the position of each scintillator tile with respect to the wire-chamber measurements. It is therefore possible, after inspecting the efficiency maps, to set a tile-dependent x and y cut that selects only events in which a single muon crosses the active
2018 JINST 13 P01002
Figure 5. Map of the hit efficiency as a function of the hit position in the EJ-200 tile. Scintillator tiles are
not completely centered with respect to wire-chamber position; the areas where the efficiency is about 20% correspond to a location not covered by plastic scintillator. The efficiency is not zero because a small signal due to electronic noise or light leaks can still be recorded. The dashed lines identify a fiducial area within the scintillator tile. The light-collection efficiency of a tile is measured using exclusively muons crossing that fiducial area.
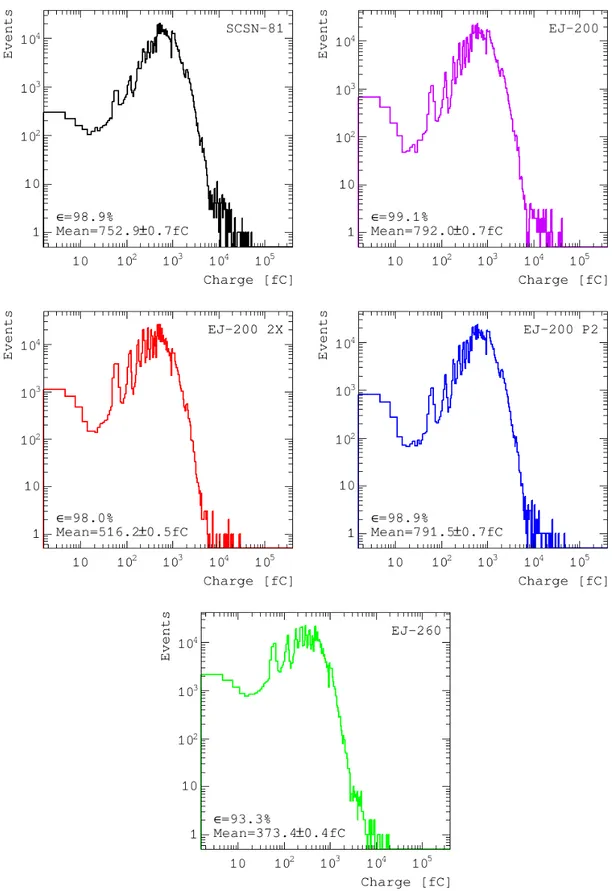
material of a tile. These requirements allow us to define the light-collection efficiency, i.e., the probability that a muon crossing a tile produces a signal above 25 fC. The distributions of the energy released by muon MIP crossing the fiducial area within a tile is shown in figure6.
We note that the over-doped sample of EJ-200 has a smaller average number of photo-electrons collected per muon MIP with respect to SCSN-81, which we will use as reference material. This is consistent with the expectation: the increase in dopant concentration causes a reduction in light yield by enhancing self-absorption by the dopant itself. We similarly observe that the light yield of EJ-260 is also smaller than SCSN-81. This can be partly explained by the fact that EJ-260 is less bright than EJ-200 (9,200 photons per 1 MeV electron versus 10,000), the quantum efficiency of SiPM is lower for red/orange light than for green light [7], and the green-to-red/orange conversion in WLS fibers is less efficient than the blue-to-green one.
6 Time analysis
The upgraded front-end readout electronics allow for the first time the precise measurement of the time at which a signal pulse is produced. The resolution of the time measurement is 0.5 ns, as it has been checked by injecting light into a tile with a laser, and using the laser itself to produce a
2018 JINST 13 P01002
trigger signal. Unfortunately, it is not possible to produce an absolute timing measurement becausethere is no available time reference in the beam data. Muons arrive asynchronously, during a spill that lasts about 10 s. It is not possible to measure when a muon hits a tile, and compare that time with the measurement of the electronics, which would allow one to measure the decay time of each scintillator.
However, it is possible to compare how fast the scintillators are with respect to each other by looking at the difference between the signal timing of two scintillators. This distribution does not depend on the time at which the muon hits the tiles, because it is the same for all tiles. This distribution can also be analytically modelled by assuming that it is the difference between two Gaussian distribution, each of which corresponds to the distribution of pulse leading-edge times in one of the scintillators that are being compared.
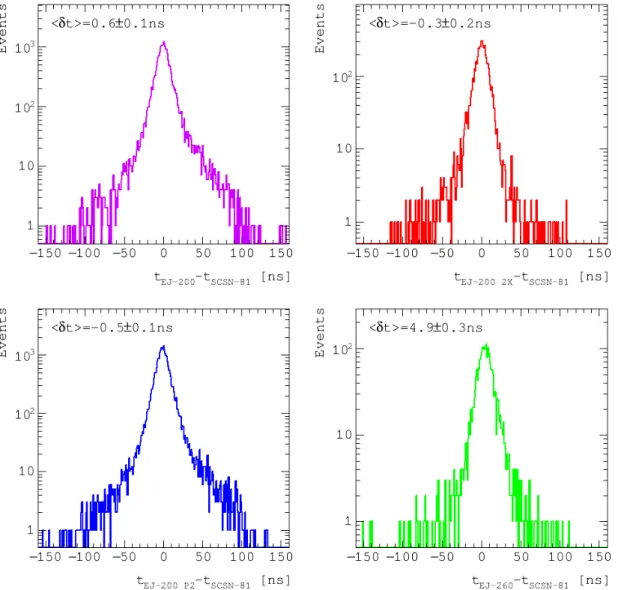
The distributions of time differences are presented in figure7. They show that the blue scintil-lators (SCSN-81, different flavors of EJ-200) have a similar timing; the corresponding distributions are roughly centered at 0 ns. The EJ-260 green scintillator is slower than the blue-emitting scintilla-tors. The mean of the time-difference distribution is about 5 ns. However, we do not think that this precludes the usage of EJ-260 for a calorimeter at the LHC, where the bunch-crossing separation is about five times larger, 25 ns. It has also been noted in section5that the EJ-260 signal is wider in time than the signal from blue scintillators.
7 Conclusion
We measure the performance of plastic scintillator tiles using a 150 GeV muon beam at the CERN H2 test-beam area. The materials are tested for light-collection efficiency and light yield. Commer-cially available scintillators are compared to custom-made ones, in an attempt at investigating the possibility of increasing their radiation tolerance. Over-doping a scintillator and shifting to a longer wavelength-emitting dopant are considered two simple methods to increase the radiation tolerance of a scintillator. The analysis of light yield and signal timing indicate that both methods are viable, and do not prevent their application to produce a usable scintillator.
Acknowledgments
The authors would like to thank CERN for the operations of the SPS accelerator; Dragoslav Lazic for supporting operations in the H2 test-beam area; Janina Gielata (FNAL) for the preparation of optical connections. This work was supported in part by U.S. Department of Energy Grants.
2018 JINST 13 P01002
Figure 6.Integrated charge per muon in femtocoulombs. Events are selected requiring that a single muon be
crossing the scintillator tile. The fraction of events in the plot with integrated charge above 25 fC represents the hit efficiency.
2018 JINST 13 P01002
Figure 7. Distribution of the time difference between signals obtained in pairs of scintillator tiles. Events
are selected requiring that a single muon be crossing the scintillator tile. The distributions show that blue-emitting scintillators are roughly equivalent (the time-difference distributions are centered at 0 ns), while the green-emitting EJ-260 scintillator is slower (the time-difference distribution with EJ-260 is centered at about 5 ns).
2018 JINST 13 P01002
References[1] D. Contardo, M. Klute, J. Mans, L. Silvestris and J. Butler, Technical Proposal for the Phase-II
Upgrade of the CMS Detector,CERN-LHCC-2015-010(2015).
[2] J. Mans et al., CMS Technical Design Report for the Phase 1 Upgrade of the Hadron Calorimeter,
CERN-LHCC-2012-015(2012). [3] http://www.eljentechnology.com/.
[4] S. Liao, R. Erasmus, H. Jivan, C. Pelwan, G. Peters and E. Sideras-Haddad, A comparative study of the
radiation hardness of plastic scintillators for the upgrade of the Tile Calorimeter of the ATLAS detector,J. Phys. Conf. Ser. 645(2015) 012021.
[5] http://www.kuraray.com/products/plastic/psf.html.
[6] P. de Barbaro et al., Research and Development results on scintillating tile fiber calorimetry for the
CDF and SDC detectors,Nucl. Instrum. Meth. A 315(1992) 317.
[7] A. Heering, Yu. Musienko, R. Ruchti, M. Wayne, A. Karneyeu and V. Postoev, Parameters of the
preproduction series SiPMs for the CMS HCAL phase I upgrade,Nucl. Instrum. Meth. A 824(2016) 115.
2018 JINST 13 P01002
The CMS HCAL collaborationYerevan Physics Institute, Yerevan, Armenia
S. Chatrchyan, A.M. Sirunyan, A. Tumasyan
National Centre for Particle and High Energy Physics, Minsk, Belarus
A. Litomin, V. Mossolov, N. Shumeiko†
Universiteit Antwerpen, Antwerpen, Belgium
M. Van De Klundert, H. Van Haevermaet, P. Van Mechelen, A. Van Spilbeeck
Centro Brasileiro de Pesquisas Fisicas, Rio de Janeiro, Brazil
G.A. Alves, W.L. Aldá Júnior, C. Hensel
Universidade do Estado do Rio de Janeiro, Rio de Janeiro, Brazil
W. Carvalho, J. Chinellato, C. De Oliveira Martins, D. Matos Figueiredo, C. Mora Herrera, H. Nogima, W.L. Prado Da Silva, E.J. Tonelli Manganote, A. Vilela Pereira
Charles University, Prague, Czech Republic
M. Finger, M. Finger Jr., A. Kveton, J. Tomsa
Institute of High Energy Physics and Informatization, Tbilisi State University, Tbilisi, Georgia
G. Adamov, Z. Tsamalaidze1
Deutsches Elektronen-Synchrotron, Hamburg, Germany
U. Behrens, K. Borras, A. Campbell, F. Costanza, P. Gunnellini, A. Lobanov, I.-A. Melzer-Pellmann, C. Muhl, B. Roland, M. Sahin, P. Saxena
Indian Institute of Science Education and Research, Pune, India
V. Hegde, K. Kothekar, S. Pandey, S. Sharma
Panjab University, Chandigarh, India
S.B. Beri, B. Bhawandeep, R. Chawla, A. Kalsi, A. Kaur, M. Kaur, G. Walia
Saha Institute of Nuclear Physics, Kolkata, India
S. Bhattacharya, S. Ghosh, S. Nandan, A. Purohit, M. Sharan
Tata Institute of Fundamental Research-B, Mumbai, India
S. Banerjee, S. Bhattacharya, S. Chatterjee, P. Das, M. Guchait, S. Jain, S. Kumar, M. Maity, G. Majumder, K. Mazumdar, M. Patil, T. Sarkar
Vilnius University, Vilnius, Lithuania
A. Juodagalvis
Joint Institute for Nuclear Research, Dubna, Russia
S. Afanasiev, P. Bunin, Y. Ershov, I. Golutvin, A. Malakhov, P. Moisenz†, V. Smirnov, A. Zarubin
National Research Nuclear University Moscow Engineering Physics Institute, Moscow, Russia
M. Chadeeva, R. Chistov, M. Danilov, E. Popova, V. Rusinov
Institute for Nuclear Research, Moscow, Russia
2018 JINST 13 P01002
Institute for Theoretical and Experimental Physics, Moscow, Russia
V. Epshteyn, V. Gavrilov, N. Lychkovskaya, V. Popov, I. Pozdnyakov, G. Safronov, M. Toms, A. Zhokin
Moscow State University, Moscow, Russia
A. Baskakov, A. Belyaev, E. Boos, M. Dubinin2, L. Dudko, A. Ershov, A. Gribushin, A. Kaminskiy, V. Klyukhin, O. Kodolova, I. Lokhtin, I. Miagkov, S. Obraztsov, S. Petrushanko, V. Savrin, A. Snigirev
P.N. Lebedev Physical Institute, Moscow, Russia
V. Andreev, M. Azarkin, I. Dremin, M. Kirakosyan, A. Leonidov, A. Terkulov
State Research Center of Russian Federation, Institute for High Energy Physics, Protvino, Rus-sia
S. Bitioukov, D. Elumakhov, A. Kalinin, V. Krychkine, P. Mandrik, V. Petrov, R. Ryutin, A. Sobol, S. Troshin, A. Volkov
Kyungpook National University, Daegu, South Korea
S. Sekmen
CERN, European Organization for Nuclear Research, Geneva, Switzerland
T. Medvedeva, P. Rumerio3
Cukurova University, Adana, Turkey
A. Adiguzel, N. Bakirci4, F. Boran, S. Cerci5, S. Damarseckin, Z.S. Demiroglu, F. Dölek, C. Dozen, I. Dumanoglu, E. Eskut, S. Girgis, G. Gokbulut, Y. Guler, I. Hos, E.E. Kangal, O. Kara, A. Kayis Topaksu, C. Işik, U. Kiminsu, M. Oglakci, G. Onengut, K. Ozdemir6, S. Ozturk4, A. Polatoz, D. Sunar Cerci5, B. Tali5, U.G. Tok, H. Topakli4, S. Turkcapar, I.S. Zorbakir, C. Zorbilmez
Middle East Technical University, Physics Department, Ankara, Turkey
B. Bilin, B. Isildak, G. Karapinar, A. Murat Guler, K. Ocalan7, M. Yalvac, M. Zeyrek
Bogazici University, Istanbul, Turkey
I.O. Atakisi8, E. Gülmez, M. Kaya8, O. Kaya9, O.K. Koseyan, O. Ozcelik10, S. Ozkorucuklu11, S. Tekten9, E.A. Yetkin12, T. Yetkin13
Istanbul Technical University, Istanbul, Turkey
K. Cankocak, S. Sen14
Institute for Scintillation Materials of National Academy of Sci-ence of Ukraine, Kharkov, Ukraine
A. Boyarintsev, B. Grynyov
National Scientific Center, Kharkov Institute of Physics and Technology, Kharkov, Ukraine
L. Levchuk, V. Popov, P. Sorokin
University of Bristol, Bristol, United Kingdom
2018 JINST 13 P01002
Baylor University, Waco, U.S.A.
A. Borzou, K. Call, J. Dittmann, K. Hatakeyama, H. Liu, N. Pastika
The University of Alabama, Tuscaloosa, U.S.A.
A. Buccilli, S.I. Cooper, C. Henderson, C. West
Boston University, Boston, U.S.A.
D. Arcaro, D. Gastler, E. Hazen, J. Rohlf, L. Sulak, S. Wu, D. Zou
Brown University, Providence, U.S.A.
J. Hakala, U. Heintz, K.H.M. Kwok, E. Laird, G. Landsberg, Z. Mao, D.R. Yu
University of California, Riverside, Riverside, U.S.A.
J.W. Gary, S.M. Ghiasi Shirazi, F. Lacroix, O.R. Long, H. Wei
University of California, Santa Barbara, Santa Barbara, U.S.A.
R. Bhandari, R. Heller, D. Stuart, J.H. Yoo
California Institute of Technology, Pasadena, U.S.A.
Y. Chen, J. Duarte, J.M. Lawhorn, T. Nguyen, M. Spiropulu
Fairfield University, Fairfield, U.S.A.
D. Winn
Fermi National Accelerator Laboratory, Batavia, U.S.A.
S. Abdullin, A. Apresyan, A. Apyan, S. Banerjee, F. Chlebana, J. Freeman, D. Green, D. Hare, J. Hirschauer, U. Joshi, D. Lincoln, S. Los, K. Pedro, W.J. Spalding, N. Strobbe, S. Tkaczyk, A. Whitbeck
Florida International University, Miami, U.S.A.
S. Linn, P. Markowitz, G. Martinez
Florida State University, Tallahassee, U.S.A.
M. Bertoldi, S. Hagopian, V. Hagopian, T. Kolberg
Florida Institute of Technology, Melbourne, U.S.A.
M.M. Baarmand, D. Noonan, T. Roy, F. Yumiceva
The University of Iowa, Iowa City, U.S.A.
B. Bilki15, W. Clarida, P. Debbins, K. Dilsiz, S. Durgut, R.P. Gandrajula, M. Haytmyradov, V. Khristenko, J.-P. Merlo, H. Mermerkaya16, A. Mestvirishvili, M. Miller, A. Moeller, J. Nachtman, H. Ogul, Y. Onel, F. Ozok10, A. Penzo, I. Schmidt, C. Snyder, D. Southwick, E. Tiras, K. Yi
The University of Kansas, Lawrence, U.S.A.
A. Al-bataineh, J. Bowen, J. Castle, W. McBrayer, M. Murray, Q. Wang
Kansas State University, Manhattan, U.S.A.
2018 JINST 13 P01002
University of Maryland, College Park, U.S.A.
A. Baden, A. Belloni, J.D. Calderon17, S.C. Eno, Y. B. Feng, C. Ferraioli, T. Grassi, N.J. Hadley, G-Y Jeng, R.G. Kellogg, J. Kunkle, A. Mignerey, F. Ricci-Tam, Y.H. Shin, A. Skuja, Z.S. Yang, Y. Yao18
Massachusetts Institute of Technology, Cambridge, U.S.A.
S. Brandt, M. D’Alfonso, M. Hu, M. Klute, X. Niu
University of Minnesota, Minneapolis, U.S.A.
R.M. Chatterjee, A. Evans, E. Frahm, Y. Kubota, Z. Lesko, J. Mans, N. Ruckstuhl
University of Notre Dame, Notre Dame, U.S.A.
A. Heering, D.J. Karmgard, Y. Musienko19, R. Ruchti, M. Wayne
Princeton University, Princeton, U.S.A.
A.D. Benaglia20, K. Mei, C. Tully
University of Rochester, Rochester, U.S.A.
A. Bodek, P. de Barbaro, M. Galanti, A. Garcia-Bellido, A. Khukhunaishvili, K.H. Lo, D. Vishnevskiy, M. Zielinski
Rutgers, the State University of New Jersey, Piscataway, U.S.A.
A. Agapitos, M. Amouzegar, J.P. Chou, E. Hughes, H. Saka, D. Sheffield
Texas Tech University, Lubbock, U.S.A.
N. Akchurin, J. Damgov, F. De Guio, P.R. Dudero, J. Faulkner, E. Gurpinar, S. Kunori, K. Lamichhane, S.W. Lee, T. Libeiro, T. Mengke, S. Muthumuni, S. Undleeb, I. Volobouev, Z. Wang
University of Virginia, Charlottesville, U.S.A.
S. Goadhouse, R. Hirosky, Y. Wang
†: Deceased
1: Also at Joint Institute for Nuclear Research, Dubna, Russia 2: Also at California Institute of Technology, Pasadena, U.S.A. 3: Also at The University of Alabama, Tuscaloosa, U.S.A. 4: Also at Gaziosmanpasa University, Tokat, Turkey 5: Also at Adiyaman University, Adiyaman, Turkey 6: Also at Piri Reis University, Istanbul, Turkey
7: Also at Necmettin Erbakan University, Konya, Turkey 8: Also at Marmara University, Istanbul, Turkey
9: Also at Kafkas University, Kars, Turkey
10: Also at Mimar Sinan University, Istanbul, Turkey 11: Also at Istanbul University, Istanbul, Turkey 12: Also at Istanbul Bilgi University, Istanbul, Turkey 13: Also at Yildiz Technical University, Istanbul, Turkey 14: Also at Hacettepe University, Ankara, Turkey 15: Also at Beykent University, Istanbul, Turkey 16: Also at Erzincan University, Erzincan, Turkey
2018 JINST 13 P01002
17: Now at NOAA, National Oceanic and Atmospheric Administration, U.S.A. 18: Now at University of California, Davis, Davis, U.S.A.
19: Also at Institute for Nuclear Research, Moscow, Russia 20: Now at INFN Sezione di Milano-Bicocca, Milano, Italy