A GIS ‐ based framework for hazardous materials transport risk assessment
12
0
0
Tam metin
(2) 1110 diction. This typically involves assessment of the total transport risk imposed on the public by the movement of a multiplicity of dangerous goods between a large number of origin–destination (o–d) pairs. It is important to note that almost all of the academic literature on hazmat transportation adopts a carrier’s perspective and focuses on single commodity, single o–d problems. A notable exception is the recent work of Lovett et al.(1) on the risks associated with the transportation of liquid hazardous waste in London from various locations to a single landfill. In this study, we focused on assessment of the transport risk when hazmat shipments involve multiple commodities and multiple o–d pairs. We developed a model to represent the population distribution, road network structure, and dangerous goods movements in a prespecified region. The model enabled us to assess the total transport risk as well as the equity of its spatial distribution. In order to make large-scale implementations possible, we incorporated the model into a Geographical Information System (GIS). Our GIS-based model facilitates estimation of the routes used by carriers, which serves as a basis for representing distribution of the transportation activity across the road network. The model can also be used to estimate the impact of alternative routing policies for hazmat shipments. The model was illustrated within the context of dangerous goods shipments on the highway network of Quebec and Ontario. The provincial and residential streets were not included in our transportation network. Therefore, this study was intended to provide a methodology for comparing different routing scenarios rather than to conduct a detailed risk assessment on a local scale.. Verter and Kara hazmat risk assessment models, they are not stated explicitly in all cases. In a transport network, any path P between a given o–d pair would typically consist of a series of links. It is well known that the likelihood of a traffic accident varies with road structure (e.g., the number of lanes). Also, the probability of an incident, such as fire or explosion, depends on the type of dangerous good being carried. Let ps,m denote the probability of having an incident, involving hazmat type m while traversing a unit road segment on link s. For the ease of exposition, we will omit index m, when referring to incident probabilities. Assumption 1. ps is constant on link s. Note that any transport network can be redefined so as to satisfy Assumption 1. It is possible to divide a link that violates this assumption into sublinks, each with constant incident probability. Thus, the probability of having an incident on unit segment k of link s is (1 2 Ps)k21 ps. Let ps 9 denote the probability of having an incident on link s, and ls denote the length of link s. Observe that, p s 9 5 p s 1 ( 1 2 p s )p s 1 ( 1 2 p s ) p s 2. 1 … 1 ( 1 2 ps ). ps. ls21. 5. ^ (1 2 p ) p . i. s. i50. s. Given that the incident probabilities are on the order of 1028, the following assumption is quite common in the hazmat literature: Assumption 2. P s ù 0 for i . 1. i. Without loss of generality, let P 5 {1, 2, . . . , r}. The incident probability of a single shipment on path P is: r. 2. THE RISK ASSESSMENT FRAMEWORK Hazmat transport risk is a measure of the possible undesirable impact of dangerous goods movements on the public and environment. As pointed out by Erkut and Verter,(2) there is no consensus among authors on how to model the risk associated with a hazmat shipment. In the present risk assessment framework we used the three most popular risk models: societal/traditional risk (e.g., Alp,(3) Erkut & Verter(4)), population exposure (e.g., ReVelle et al.,(5) Batta & Chiu(6)), and incident probability (e.g., Saccomanno & Chan,(7) Abkowitz et al.(8)). Let us first begin by providing formal definitions of these risk models as well as their underlying assumptions. Although these assumptions have been commonly used by many authors in building. l s 21. P1 9 1. s21. ^ & ( 1 2 P 9 ) P 9. k. s. s51 k51. Based on Assumptions 1 and 2, the incident probability of path P simplifies to: r. ^P 9 s. s51. r. 5. ^l P . s. s. (1). s51. Representation of the spatial distribution of population, within the geographical region of concern, is another crucial issue in hazmat transport risk assessment. A very common model in the literature is the point representation of population centers. That is, each population center is modeled as a point on the plane, and all of the people living in that center are.
(3) GIS-Based Risk Assessment. 1111. considered to be affected from an incident if the point representing the center lies within the impact area of an incident. Traditionally, the impact area of an incident is assumed to be a circle centered at the incident location and it is called the danger circle. The radius of a danger circle depends on the type of hazmat being shipped. Recently, Erkut and Verter(4) proposed an extended model, in which population centers are represented as polygons rather than points. Clearly, the polygon representation provides a more accurate model of the spatial distribution of population than the traditional point representation. It is possible to further improve the accuracy of a risk assessment framework by using raster data. There exist surface models for population distribution(9) in which the centroids that represent local population density are at very high resolution, that is, up to 10-m precision. We believe that detailed mapping of residential populations via surface modeling would become more popular in the future as a result of the current developments in high-resolution satellite imagery. In this article, however, we use the polygon representation in our analysis mainly due to the lack of detail in the available data. Let ds denote the population density around a unit road segment on link s. Assumption 3. ds is constant on link s. Let Cs,m denote the number of people living within the danger circle of hazmat type m around link s, and lm denote the impact radius of hazmat type m. Cs,m 5 plm2ds . The societal or traditional risk of a single shipment on path P is the expected number of people that will be affected as a result of an incident during transportation. Based on the assumptions mentioned above, the societal risk of path P simplifies to: r. ^ P 9C s. s51. r. s ,m. 2 5 l s P s d s pl m . s51 . ^. (2). The population exposure of a single shipment on path P is the total number of people who will be exposed to the potentially hazardous vehicle. It is possible to consider the hazmat shipment over a link as the movement of the danger circle along that link. This movement carves out a band on both sides of the link that is the region of possible impacts. We refer to that area as the exposure zone, and denote the exposure zone of hazmat type m around link s as EZs,m. Let. C s,m represent the number of people living in EZs,m. When link s is a straight line, C s,m 5 ds(2ls lm 1 plm2). Clearly, the population exposure of path P is r. ^C. s ,m. .. (3). s51. The GIS-based model, which is outlined in Section 4, uses the three risk models presented in this section in two ways: (1) to identify a path that minimizes a certain risk measure and (2) to evaluate the societal risk, population exposure, and incident risk of a given path. To allow for such calculations, however, the model that represents the road network and population centers has to satisfy Assumptions 1 and 3. In the process of describing the GIS-based model, the procedure that needs to be followed in extending a traditional network model of the road system to a model that is suitable for dangerous goods shipments is outlined. We now turn to the description of the Quebec and Ontario case, which will be used in presenting the GIS-based model. 3. THE QUEBEC AND ONTARIO DATA We focused on the truck shipments of gasoline, fuel oil, petroleum and coal tar, and alcohol through the highway network of Quebec and Ontario. These four materials constitute 56% of all the hazmats transported via the Canadian highway network. The origin, destination, type of material carried, monetary value, and the number of trucks used for each dangerous good shipment are recorded by Statistics Canada. These records are aggregated annually on the basis of census subdivisions. We assumed that the shipment origin and destination points are at the centroids of the associated census subdivisions. In 1998, there were 251 o–d pairs for gasoline, 239 o–d pairs for fuel oil, 210 o–d pairs for petroleum and coal tar, and 75 o–d pairs for alcohol. Because the records did not contain reliable information with regard to the amount of hazmat carried, we focused on the number of shipments between each pair. Thus, we assumed that each truck carrying a certain hazmat posed the same risk regardless of the amount of its cargo. Within the two provinces there were 102,420 gasoline shipments, 70,414 fuel oil shipments, 40,566 petroleum and coal tar shipments, and 4,781 alcohol shipments in 1998. According to the 1996 population census, there were 1,149 census subdivisions in Quebec and 543 census subdivisions in Ontario. Longeuil and Mon-.
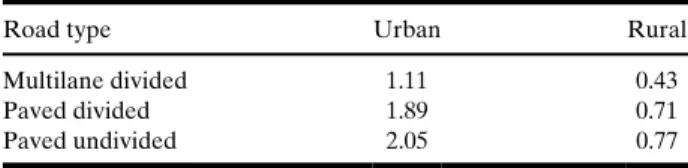
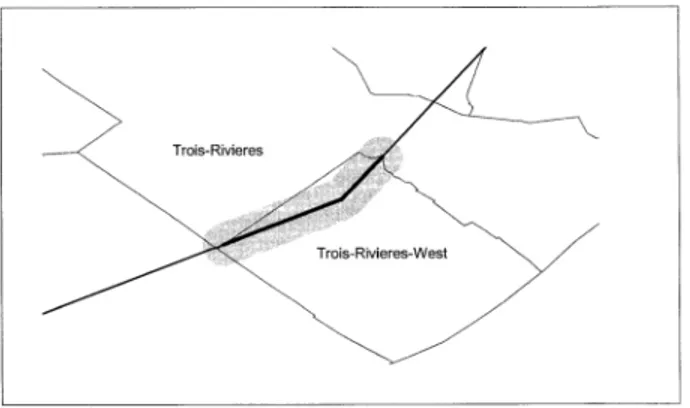
(4) 1112. Verter and Kara. Table I. Accident Frequency per Million Kilometers Road type Multilane divided Paved divided Paved undivided. Urban. Rural. 1.11 1.89 2.05. 0.43 0.71 0.77. treal were the two most densely populated subdivisions in Quebec, with 1,485 and 1,138 people per square kilometer, respectively. In Ontario, York and Toronto were the top two subdivisions in terms of population density, with 4,540 and 4,099 people per square kilometer, respectively. We focused on the census subdivisions with population densities larger than 40 people per square kilometer. Thus, our model included 108 zones in Quebec with a total population of 3.8 million, and 72 zones in Ontario with a total population of 7.6 million. We used the highway network of Quebec and Ontario provided with the ArcView 3.1 GIS software. This digitized map contains 130 links and the road type is specified for each link—that is, multilane divided, paved undivided, and paved divided. Clearly, the outcome of our study was dependent on the level of detail used in representing the available transport network. That is, the results might have been somewhat different if the road network was not confined to the highways. We adopted the estimates provided by Shortreed et al.(10) for accident probabilities (see Table I). These authors also suggested a 5% conditional probability for the occurrence of an incident, given a traffic accident involving a hazmat truck. That is, our ps values were obtained by multiplying the values in Table I by 0.05. A link segment corresponds to an urban road if it lies within a population center; otherwise, it corresponds to a rural road. In terms of incident type, we focused on spills that involved gasoline, fuel oil, and alcohol trucks; and fires that involved trucks carrying petroleum and coal tar. For these types of incidents, Transport Canada(11) requires evacuation of the people residing within 800 meters of an incident site. Thus, the undesirable consequence of our concern was evacuation of people, and the impact radius used in our analysis was 800 m. 4. THE GIS-BASED MODEL Representation of the population centers, the road network, and the origin and destination points for the hazmat shipments constitutes the ground-. work for the development of a GIS-based risk assessment model. GISs provide a natural environment for polygon representation of population centers. Thus, we obtained a digitized map of the 180 census subdivisions from Statistics Canada, and incorporated this as the initial layer of information. We used the latitude and longitude information in representing the origin and destination points of the shipments as the second layer. The highway network of Quebec and Ontario was incorporated as the third layer. To construct a GIS-based model that was suitable for representing the transportation of hazmats in Quebec and Ontario, the above-mentioned three layers of data needed to be processed. Many of the origin and destination points were not on the highway network. On average, our 132 distinct origin and/or destination points were approximately 10 km away from the closest highway. Fortunately, the distance between 53 of these points and the closest highway was, in fact, less than 5 km, whereas there were 28 points within the 5- to 10-km range. Because our analysis was intended to be at the strategic level, we projected each origin and destination point onto the closest highway link, and used the resulting points as the origins and destinations in our model. The original links were divided so that each origin and destination in our network model was an end point of a link. The outcome of this process was a transport network with 445 links. This amounted to assuming that the trucks would be required to use the shortest routes when they were off the highway network, which is a plausible assumption within many municipalities, especially in large population centers. We had to further process the 445-link highway network, because it contained a number of links that violated Assumptions 1 and 3. These links were divided so that each link either lay in one population center or it was a rural road. The resulting transport network had 1,170 links, each satisfying Assumption 1. This transformation, however, did not guarantee that the population density around each link was uniform. It was possible that more than one population center could be affected by a shipment on a link. For example, as depicted in Fig. 1, the exposure zone around the link in Trois-Rivieres-West also contained a portion of Trois-Rivieres. To overcome this problem, we decided to use the weighted population density around the links that violated Assumption 3. Let da denote the population density of population center a and A(a) denote its area. Naturally, the weighted population density of link s depends on the hazmat being shipped:.
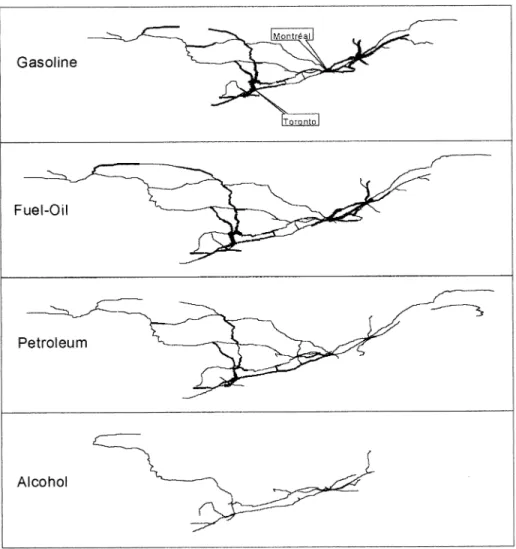
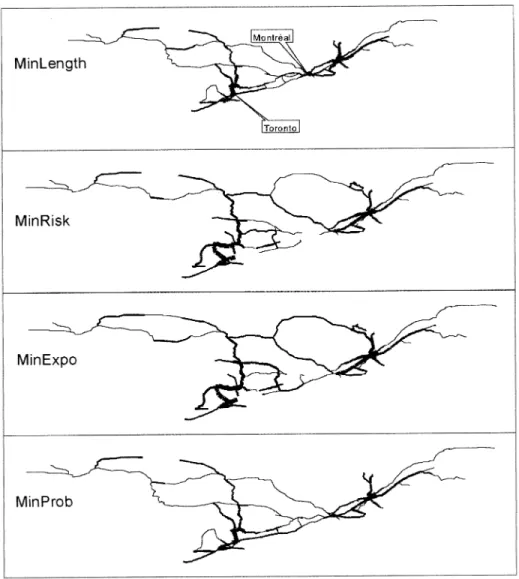
(5) GIS-Based Risk Assessment. 1113 that wds,m 5 0 for a significant majority of the rural roads in our model. For these links, we used the travel distance as a tiebreaker within the shortest-path algorithm under the MinRisk and MinExpo criteria. 5. TRANSPORT RISK IMPLICATIONS OF DIFFERENT FLOW PATTERNS. Fig. 1. Eight hundred-m exposure zone around a link in TroisRivieres-West.. ^. d a A ( EZ s ,m > a ) a -. wd s ,m 5 ----------------------------------------------A ( EZ s ,m ). (4). The impact radius was the same for all four hazmats studied. Consequently, the weighted population density around a link did not vary according to the hazmat type. Thus, there were three attributes associated with each link in our 1,170-link network: ps, ls, and wds,m. This GIS-based network model satisfied all the assumptions stated in Section 2, and it constituted the framework used in assessing the risk of hazmat transportation on Quebec and Ontario highways. One of the powerful features of the GIS environment is the ability to calculate the area of the exposure zone around a polyline, such as in Fig. 1. Thus, we did not have to further divide the links into straightline segments. Although the straight-line representation of road links has been used previously (e.g., Erkut and Verter(4)), it would have increased the size of our network considerably. Thus, in our GIS-based model, C s,m 5 wds,mA(EZs,m). It is important to note that the Statistics Canada database contains information with regard to the origin and destination of each shipment, and the actual route that has been used is not recorded. We assumed that the carriers would use the shortest paths (MinLength) for their shipments. This assumption is quite plausible, unless a hazmat truck is trying to avoid the inspection centers on the road. As alternative routing strategies, we studied minimization of societal risk (MinRisk), population exposure (MinExpo), and incident probability (MinProb). Under each criterion, the routing problem for a given o–d pair is amenable to solution by the use of a shortest-path algorithm. We used the Dijkstra(12) implementation provided in the Network Analyst extension of ArcView 3.1. Note. We now can report on transport risk implications of the flow patterns associated with the four routing criteria mentioned above. In an effort to estimate the current situation, we identified the shortest route between each o–d pair. (Clearly an alternative way to do this would have been to identify the shortest time routes, which might be preferred by some carriers. The necessary data, however, were not readily available.) Based on the number of shipments along each route, we calculated the number of trucks that use each road link. Thus, Fig. 2 depicts the hazmat transportation activity on the Quebec and Ontario highways in 1998. The thickness of a link in Fig. 2 represents the annual number of trucks that use the link. We also generated the flow patterns under the MinRisk, MinExpo, and MinProb criteria. Clearly, the link impedances in the associated shortest path problems are ps9Cs,m, C s,m, and ps9, respectively. Table II depicts the average travel distance and average population exposure for a hazmat truck under each criterion. On average, alcohol trucks travel the longest distances and expose the largest number of people to risk under each criterion. From the viewpoint of total societal risk, however, these trucks cause the least concern. This is primarily due to the relatively small number of alcohol shipments. Table III provides our assessment of the total societal risk. The most important message one can draw from Table III is that the expected number of evacuations can be reduced 41% by using the MinRisk rather than MinLength criterion in routing the hazmat trucks. Also, the ranking of the routing criteria in terms of their transport risk implications varies with the hazmat being shipped. For example, switching to the use of the MinProb criterion leads to a reduction in the societal risk of the gasoline shipments, whereas it causes an increase in the expected number of evacuations associated with the other three hazmats. We focused on the gasoline trucks for a more detailed analysis of the trade-off between the routing criteria. Fig. 3 shows the gasoline flows in Quebec and Ontario with respect to each routing criterion. In terms of the flow patterns, the MinLength and MinProb paths are quite similar for gasoline trucks..
(6) 1114. Verter and Kara. Fig. 2. Flow patterns under the MinLength criterion.. There is also an apparent similarity between the MinRisk and MinExpo paths in Fig. 3. These similarities can be explained on the basis of the common factors among the routing criteria. Note that travel distance is the common factor for MinLength and MinProb, whereas both MinRisk and MinExpo incorporate population density.. Table IV depicts the trade-off between the routing criteria in terms of travel distance, societal risk, and population exposure. Assuming that the carriers are using MinLength paths, the 102,420 gasoline shipments traversed a total of 24 million km on the Quebec and Ontario highways in 1998. The societal risk associated with these shipments is the expected evac-. Table II. Average Travel Distance and Population Exposure per Truck Kilometers Criterion MinLength MinRisk MinExpo MinProb. Number of people. Gasoline. Fuel oil. Petroleum. Alcohol. Gasoline. Fuel oil. Petroleum. Alcohol. 230 359 437 235. 242 550 761 275. 212 417 488 235. 392 962 1,139 410. 73,983 43,839 43,207 71,763. 100,272 53,144 50,104 102,146. 88,558 43,225 42,451 90,123. 164,297 55,181 52,993 170,450.
(7) GIS-Based Risk Assessment. 1115. Table III. Total Societal Risk Expected number of people evacuated Criterion MinLength MinRisk MinExpo MinProb. Gasoline 545 365 374 530. Fuel oil Petroleum Alcohol 469 266 286 476. 237 124 126 240. 51 19 20 53. Total 1,302 774 806 1,299. uation of 545 people, and the total population exposure is the equivalent of 7.57 billion people-trucks. Note that the use of shortest paths results in the highest total population exposure. On average, 73,983 people are exposed to a gasoline truck that is routed. according to the MinLength criterion. The average exposure of a gasoline truck can be reduced 41% by the use of the MinExpo criterion (see Table II). Each gasoline truck that follows the shortest path between Simcoe County and Toronto exposes 136,830 people to evacuation risk. This number, which is the highest average exposure in our case, is reduced to 64,800 people under the MinExpo criterion. The indexes in Table IV are obtained by dividing the total values with the smallest number in the associated column. Thus, it is possible to achieve a 33% reduction in the societal risk of gasoline shipments by using the MinRisk paths rather than the MinLength paths. This would result in a 56% increase in the distance to be traveled. An important insight provided by Table IV is that there is not much incentive to use. Fig. 3. Gasoline flows on the highways of Quebec and Ontario..
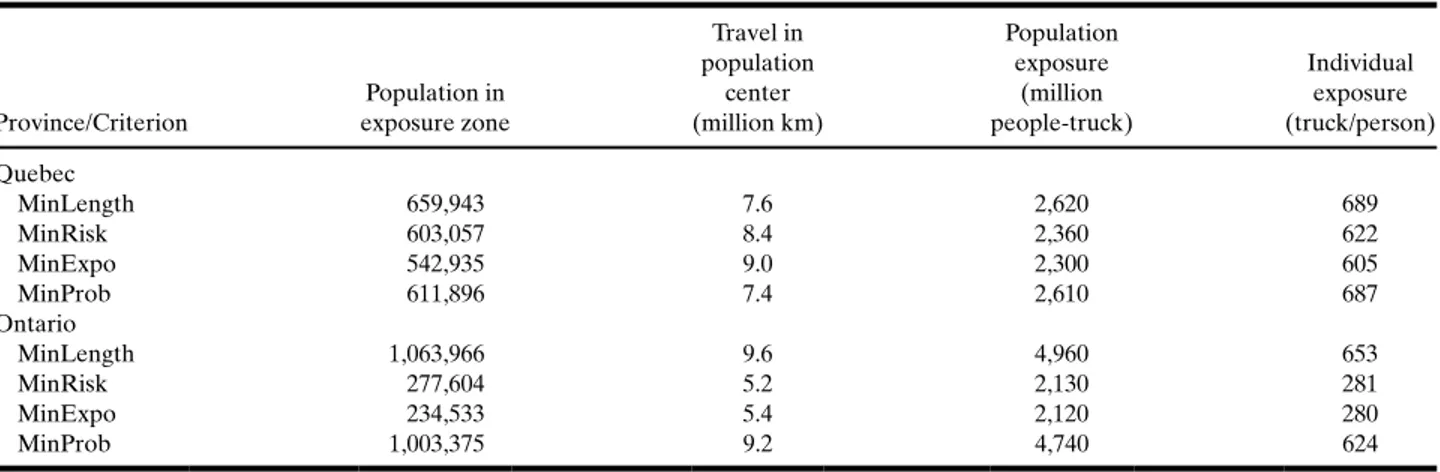
(8) 1116. Verter and Kara Table IV. The Societal Impact of Gasoline Shipments Total. Criterion Min Length MinRisk MinExpo MinProb. Distance (million km). Expected evacuation. Exposure (million people-truck). 24 37 45 24. 545 365 374 530. 7,570 4,490 4,420 7,350. the MinExpo criterion for routing gasoline trucks. The MinRisk paths have almost the same societal risk and population exposure and they require considerably shorter travel distances. Furthermore, it is evident from Tables II and III that this observation holds true also for the other three hazmats included in our analysis. Table IV reemphasizes the similarity between the MinLength and MinProb paths. In fact, for petroleum, fuel oil, and alcohol there are no gains associated with the use of the MinProb criterion rather than MinLength. Tables II and III show that the MinLength paths are superior to MinProb paths with respect to all three attributes. 6. SPATIAL DISTRIBUTION OF RISK In the previous section, the trade-off between hazmat routing criteria in terms of their overall impact was analyzed. Now, we turn to an analysis of the spatial distribution of transport risk, and provide a comparison of the two provinces, as well as present an assessment of risk equity at the level of census subdivisions. The analysis in this section is based on four. Index Distance. Expected evacuation. Exposure. 1.00 1.56 1.89 1.02. 1.49 1.00 1.02 1.45. 1.71 1.01 1.00 1.66. attributes at each population center: (1) number of people exposed to evacuation risk (i.e., population residing in an exposure zone); (2) total distance traveled by the hazmat trucks within the population center; (3) total population exposure (i.e., the sum of the population exposure values for each link within the population center, where the population exposure of a link is the number of people living in its exposure zone multiplied by the number of trucks using that link); and (4) individual exposure, which is the total population exposure divided by the number of people living in the population center. Note that individual exposure represents the average number of trucks to which a person is exposed, and, hence, it can be used as a measure of individual risk at a population center. Based on gasoline shipments, Table V depicts a comparison of Quebec and Ontario in terms of the four attributes mentioned above. Clearly, the provincewide values are obtained by adding up the population center attributes, except for the individual exposure values, which are calculated by dividing the population exposure in each province by the population of that province. It is evident from Table V that the. Table V. The Impact of Gasoline Flows in Quebec and Ontario. Province/Criterion Quebec MinLength MinRisk MinExpo MinProb Ontario MinLength MinRisk MinExpo MinProb. Travel in population center (million km). Population exposure (million people-truck). Individual exposure (truck/person). 659,943 603,057 542,935 611,896. 7.6 8.4 9.0 7.4. 2,620 2,360 2,300 2,610. 689 622 605 687. 1,063,966 277,604 234,533 1,003,375. 9.6 5.2 5.4 9.2. 4,960 2,130 2,120 4,740. 653 281 280 624. Population in exposure zone.
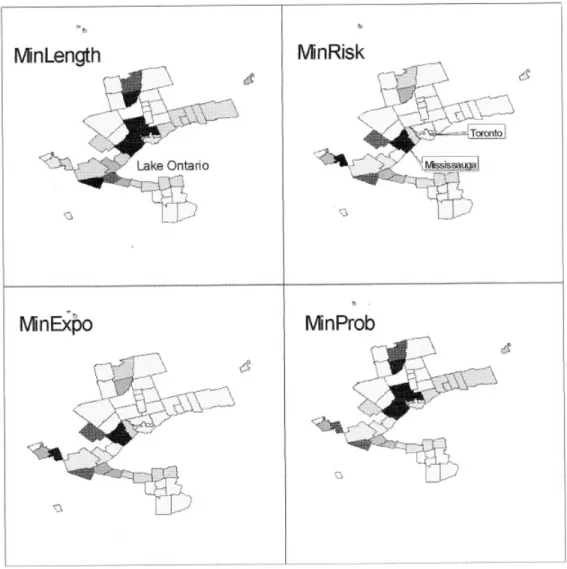
(9) GIS-Based Risk Assessment use of MinRisk or MinExpo paths rather than MinLength paths makes a big difference in Ontario, whereas the associated impact is much smaller in Quebec. In our opinion, this is due to the star-shaped structure of the highway network in Quebec, which makes it impossible to totally avoid populated areas. Note that the travel distance within population centers increases in Quebec when the MinRisk or MinExpo paths are used. This simply means that the only way to avoid heavily populated areas is to pass through less-populated zones. In contrast, Ontario’s highway network allows for the use of rural roads under the MinRisk and MinExpo criteria, and hence the travel distance within population centers decreases when these paths are used. In Quebec, the maximum population in an exposure zone is observed in Montreal regardless of the. 1117 routing criterion used. The number of people exposed to evacuation risk is 236,878 under MinLength, which reduces to 183,339 under MinExpo. In Ontario, the MinLength paths expose a maximum of 179,720 people (in North York). When MinExpo paths are used, however, the maximum is observed in Ottawa, where 61,051 people live in an exposure zone. With regard to individual exposure, the maximum in Quebec is 4,080 trucks per person (in Beauport) under MinLength, which increases to 4,748 (in Sainte-Foy) under MinExpo. In Ontario, however, the maximum individual exposure—3,192 trucks per person under MinLength—is always observed in Mississauga, which reduces to 3,085 under MinExpo. It is interesting to note that none of the maximum values in Ontario are observed in Toronto, which is one of the most densely populated areas in the province.. Fig. 4. Individual exposure in the Greater Toronto area due to gasoline shipments..
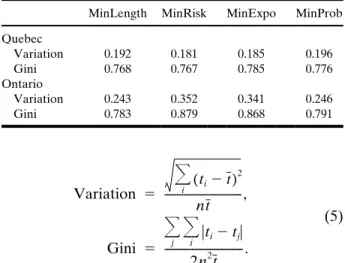
(10) 1118 Although each of the four attributes studied was appropriate for evaluating the spatial distribution of risk, the discussion in the remainder of this section is confined to individual exposure, for the purpose of brevity. Figure 4 shows the individual exposure at the census subdivisions in the Greater Toronto area due to gasoline shipments. The darkness of the shading in Fig. 4 is proportional to the trucks per person value. There are clear differences between population centers in terms of individual exposure to gasoline trucks, which might raise concerns over fairness of the spatial distribution of risk. Recently the use of GIS in analyzing environmental equity assessment has received increasing attention. For example, Chakraborty and Armstrong(13) provided a comparison of circular and plume-based risk assessment approaches in terms of environmental equity analysis. Their results were based on the implementation of these methodologies in the city of Des Moines, Iowa. Another example is the work of Cutter et al.,(14) on South Carolina, where they examined the differential burdens of potentially toxic facilities on low-income minority communities. In their comprehensive review of GIS-based environmental equity and risk assessment, McMaster et al.(15) pointed out that almost all of the prevailing studies in this area were focused on the impacts of hazardous facility sites. They viewed the lack of detailed data on transportation of hazmats as one of the drawbacks of the state of the art in this field. The basis for McMaster et al.’s(15) above-mentioned concern is the fact that most acute incidents occur when trucks or trains are involved in transportation accidents, and hazardous substances are quickly released into the environment. In this study, we utilized our GIS-based framework to also provide an analysis of equity in the spatial distribution of transport risk in Quebec and Ontario. The concept of equity has been studied also in the operations research literature within the context of undesirable facility location. Marsh and Schilling(16) provided a comprehensive review of the different equity measures; whereas, Erkut(17) presented two equity axioms and showed that the Gini coefficient and the coefficient of variation are the only measures that satisfy both of these axioms. We used the two equity measures mentioned above within the context of hazmat transportation. Let ti denote the individual exposure at population center i, n represent the number of population centers included in the analysis, and t denote the average individual exposure. The equity measures used in our analysis can be represented as follows:. Verter and Kara Table VI. Equity of Gasoline Transport Risk Distribution in Quebec and Ontario. Quebec Variation Gini Ontario Variation Gini. MinLength. MinRisk. MinExpo. MinProb. 0.192 0.768. 0.181 0.767. 0.185 0.785. 0.196 0.776. 0.243 0.783. 0.352 0.879. 0.341 0.868. 0.246 0.791. ^. ( ti 2 t ) i -, Variation 5 -----------------------------nt 2. ^^ t 2 t i. (5). j. j i Gini 5 -------------------------------. 2 2n t. The coefficient of variation evaluates equity in terms of the deviation from average individual exposure at the population centers. The Gini coefficient, however, focuses on the difference between individual exposure levels of each subdivision pair. Clearly, smaller values of these equity measures correspond to higher levels of fairness in risk distribution. A value of 0 represents perfect equity, whereas a value of 1 represents absolute inequality. Table VI depicts the two equity measures for gasoline shipments in Quebec and Ontario under each routing criterion. Apparently, the coefficient variation values are much lower than the Gini coefficient values. Thus, risk distributions are fairly equitable according to the former measure, whereas they are quite unfair according to the latter. Figure 5 explains this seemingly counterintuitive result on the basis of gasoline shipments in Ontario. Note that the. Fig. 5. Individual risk in the population centers of Ontario due to gasoline shipments..
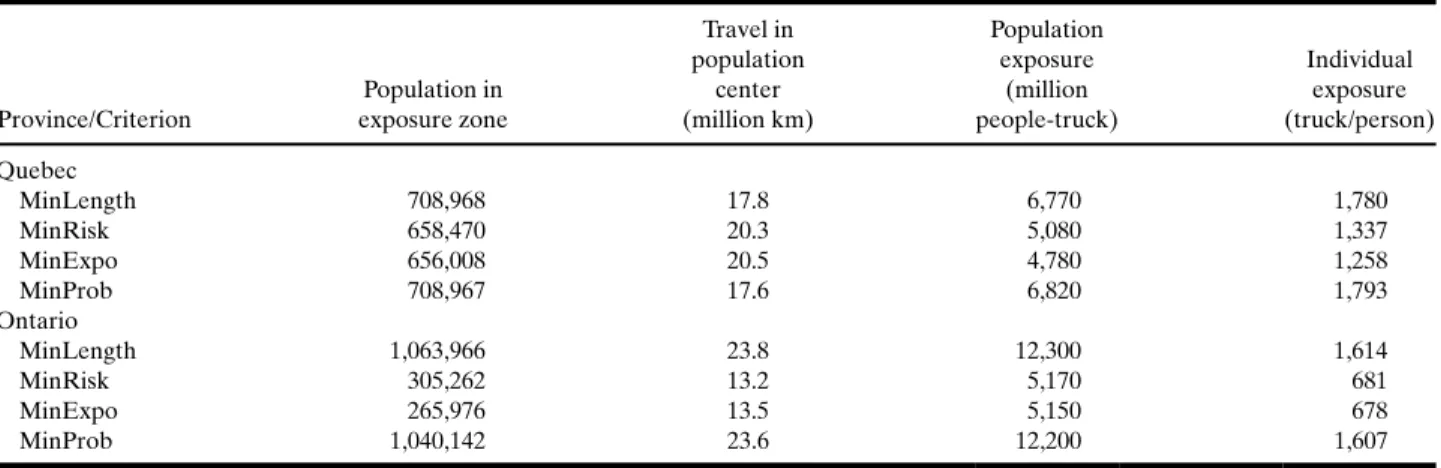
(11) GIS-Based Risk Assessment. 1119. Table VII. The Impact of All Four Hazmat Flows in Quebec and Ontario. Province/Criterion Quebec MinLength MinRisk MinExpo MinProb Ontario MinLength MinRisk MinExpo MinProb. Population in exposure zone. Travel in population center (million km). Population exposure (million people-truck). Individual exposure (truck/person). 708,968 658,470 656,008 708,967. 17.8 20.3 20.5 17.6. 6,770 5,080 4,780 6,820. 1,780 1,337 1,258 1,793. 1,063,966 305,262 265,976 1,040,142. 23.8 13.2 13.5 23.6. 12,300 5,170 5,150 12,200. 1,614 681 678 1,607. average individual exposure values under the MinLength and MinRisk criteria are 653 and 281, respectively (see Table V). Most of the population centers are quite close to the average individual exposure, and hence the low coefficient of variation values. The high Gini values, however, are due to the small number of subdivisions with high individual exposure. Many authors have suggested that the use of MinRisk paths would lead to a deterioration in risk equity. This is precisely what we observed in Ontario. Under the MinLength criterion, there were eight population zones with more than 1,000 trucks per person. This number reduced to three when MinRisk paths were used. Note that the case of three outlying zones was less equitable than the case of eight outlying zones, according to the equity measures used. It is important to note that conventional wisdom does not prevail in Quebec, where the use of MinRisk paths, in fact, fosters risk equity. In Quebec, there are 13 subdivisions with more than 1,000 trucks per person under MinLength, which increases to 16 under the MinRisk criterion. Thus, the impact of transport risk minimization on risk equity clearly depends on the topology of the road network, as well as the spatial distribution of population centers. In closing this section, we provide Table VII, which depicts the impact of all hazmat flows in Quebec and Ontario. The conclusions one can draw from Table VII would be parallel with those stated with regard to Table V. 7. CONCLUDING REMARKS In this article, we presented a GIS-based methodology for hazmat transport risk assessment. The. distinguishing features of the proposed methodology include the polygon representation of population centers, the polyline representation of road links, and the use of a weighted population density model. It is due to these features that our methodology is an effective means for risk assessment in a multihazmat, multiple o–d environment. On the basis of a large-scale implementation, we concluded that the transport risk in a geographical region heavily depends on the types of hazmat being carried and the topology of the road network, as well as the spatial distribution of population. Thus, it is quite unlikely that general rules of thumb can be established with respect to the trade-off between hazmat routing criteria. However, the proposed methodology facilitates an analysis of the nature of this trade-off in each case. This enabled us to develop a concrete understanding of the transport risk implications of different routing criteria within the prespecified region. From a methodological perspective, we suggest that there is a need for the development of more adequate equity measures for hazmat transport risk. Note that the prevailing equity measures deteriorate when the number of population centers with high individual risk is decreased. This may not truly reflect the preferences of many of the stakeholders in the field of hazmat transportation. The proposed methodology can be useful to a government agency in the process of developing policies with regard to dangerous goods shipments. In this article, we reported on an implementation focusing on the hazmat trucks in Quebec and Ontario. Our analysis showed that it is possible to achieve significant improvements in Ontario’s public and environmental safety by making policies that would lead to an increase in the use of routes with less transport risk. In.
(12) 1120 Quebec, however, improvements of an equal magnitude would be possible only with the construction of new road segments that avoid heavily populated areas.. Verter and Kara. 6. 7.. ACKNOWLEDGMENTS This research was conducted while the second author was a postdoctoral fellow at McGill University. This project was partially funded through a Young Researcher Grant awarded to the first author by FCAR (NC-1762) and McGill’s Faculty of Management provided financial support. Bhanu Prakash assisted in the data collection phase. The authors are grateful to three anonymous referees who were helpful in improving the manuscript through their comments and suggestions.. 8. 9. 10.. 11. 12. 13.. REFERENCES 14. 1. Lovett, A. A., Parfitt, J. P., & Brainard, J. S. (1997). Using GIS in risk analysis: A case study of hazardous waste transport. Risk Analysis, 17, 625–633. 2. Erkut, E., & Verter, V. (1998). Modeling of transport risk for hazardous materials. Operations Research, 46, 625–642. 3. Alp, E. (1995). Risk-based transportation planning practice: Overall methodology and a case example. Information Systems and Operations Research, 33, 4 – 19. 4. Erkut, E., & Verter, V. (1995). A framework for hazardous materials transport risk assessment. Risk Analysis, 15, 589–601. 5. ReVelle, C., Cohon, J., & Shobrys, D. (1991). Simultaneous. 15.. 16. 17.. siting and routing in the disposal of hazardous wastes. Transportation Science, 25, 138–145. Batta, R., & Chiu, S. S. (1988). Optimal obnoxious paths on a network: Transportation of hazardous materials. Operations Research, 36, 84–92. Saccomanno, F. F., & Chan, A. (1985). Economic evaluation of routing strategies for hazardous road shipments. Transportation Research Record, 1020, 12–18. Abkowitz, M., Lepofsky, M., & Cheng, P. (1992). Selecting criteria for designating hazardous materials highway routes. Transportation Research Record, 1333, 30–35. Bracken, I., & Martin, D. (1995). Linkage of the 1981 and 1991 UK censuses using surface modelling concepts. Environment and Planning A, 27, 379–390. Shortreed, J., Belluz, D., Saccomanno, F. F., Nassar, S., Craig, L., & Paoli, G. (1994). Transportation risk assessment for the Alberta special waste management system (Final Report). Waterloo, Ontario, Canada: Institute for Risk Research, University of Waterloo. Transport Canada. (1996). North American emergency response guidebook. Ottawa, Ontario, Canada: Canutec. Dijkstra, E. (1959). A note on two problems in connection with graphs. Numerical Mathematics, 1, 269–271. Chakraborty, J., & Armstrong, M. P. (1997). Exploring the use of buffer analysis for the identification of impacted areas in environmental equity assessment. Cartography and Geographic Information Systems, 24, 145–157. Cutter, S. L., Holm, D., & Clark, L. (1996). The role of geographic scale in monitoring environmental justice. Risk Analysis, 16, 517–526. McMaster, R. B., Leitner, H., & Sheppard, E. (1997). GISbased environmental equity and risk assessment: Methodological problems and prospects. Cartography and Geographic Information Systems, 24, 172–189. Marsh, M. T., & Schilling, D. A. (1994). Equity measures in facility location analysis: A review and framework. European Journal of Operations Research, 74, 1–17. Erkut, E. (1993). Inequality measures for location problems. Location Science, 1, 199–217..
(13)
Şekil
+5
Benzer Belgeler
Finally, let me also consider a recent proposal by André Sant’Anna ( 2020 ), of what he calls a ‘hybrid view of episodic memory’, that is, one that is inspired by the
Various techniques exist for reconstructing the missing data for parallel imag- ing, such as the simultaneous acquisition of spatial harmonics (SMASH) and gen- eralized
-Yayılışı: Avusturya, Azores, Balearic Adaları, Belarus, Belçika, İngiltere, Bulgaristan, Kanarya Adaları, Korsika, Kıbrıs, Çek Cumhuriyeti, Danimarka, Estonya,
As a result it can be concluded that the proposed procedure can satis- factorily be considered as an alternative application for determination of Mn(II) spectrophotometrically and
2011 第一次國際事務主管交流會議~高等教育國際化之策略 財團法人高等教育國際合作基金會(FICHET)委由本校辦理之「2011
We are consigned to stressing over the "terrible" social media remarks, fascinating for activities, warm elective business status and understanding
Implementation of Corporate Social Responsibility in large trading of goods production sub sector companies listed on Indonesia Stock Exchange in 2014-2016 shows that
In the AORRP cohort, 10 patients (10%) were diagnosed with dysplasia or carcinoma in situ in addition to papilloma, and 5 patients (5%) had malignant transformation to
